| Param | Original file | Final file |
|---|---|---|
| Filename | modeM0/AS1A03_053T01_9000001542_10712cztM0_level2.evt | modeM0/AS1A03_053T01_9000001542_10712cztM0_level2_quad_clean.evt |
| Size (bytes) | 536,212,800 | 85,222,080 |
| Size | 511.4 MB | 81.3 MB |
| Events in quadrant A | 3,061,705 | 555,479 |
| Events in quadrant B | 5,133,505 | 537,546 |
| Events in quadrant C | 3,637,991 | 544,976 |
| Events in quadrant D | 3,980,350 | 504,503 |
| Mode M0 | |||
|---|---|---|---|
| Quadrant | BADHDUFLAG | Total packets | Discarded packets |
| A | 0 | 13332 | 3 |
| B | 0 | 19359 | 2 |
| C | 0 | 15145 | 2 |
| D | 0 | 15954 | 2 |
| Mode M9 | |||
|---|---|---|---|
| Quadrant | BADHDUFLAG | Total packets | Discarded packets |
| A | 0 | 16 | 0 |
| B | 0 | 16 | 0 |
| C | 0 | 16 | 0 |
| D | 0 | 17 | 0 |
| Mode SS | |||
|---|---|---|---|
| Quadrant | BADHDUFLAG | Total packets | Discarded packets |
| A | 0 | 128 | 0 |
| B | 0 | 128 | 0 |
| C | 0 | 128 | 0 |
| D | 0 | 128 | 0 |
| Quadrant | Total seconds | Saturated seconds | Saturation percentage |
|---|---|---|---|
| A | 6274 | 55 | 0.876634% |
| B | 6274 | 525 | 8.367867% |
| C | 6274 | 199 | 3.171820% |
| D | 6274 | 158 | 2.518330% |
Noise dominated data is calculated using 1-second bins in cleaned event files. If a bin has >2000 counts, and if more than 50% of those come from <1% of pixels, then it is considered to be noise-dominated and hence unusable.
| Quadrant | # 1 sec bins | Bins with >0 counts | Bins with >2000 counts | High rate bins dominated by noise | Noise dominated (total time) | Noise dominated (detector-on time) | Marked lightcurve |
|---|---|---|---|---|---|---|---|
| A | 7544 | 6275 | 25 | 25 | 0.33% | 0.40% | 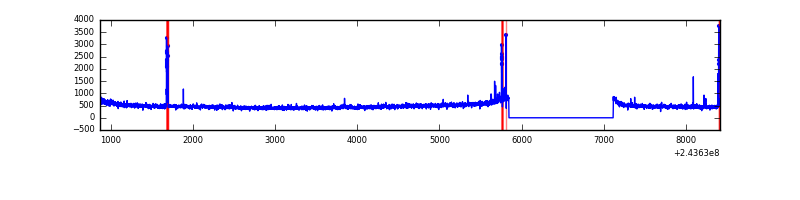 |
| B | 7544 | 6275 | 320 | 320 | 4.24% | 5.10% | 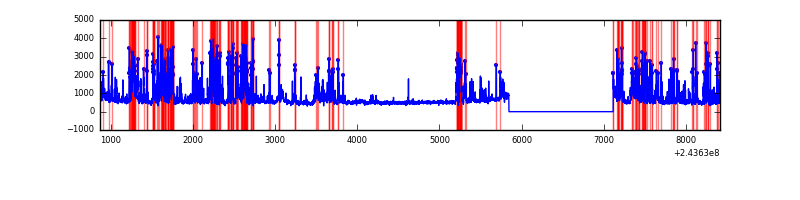 |
| C | 7544 | 6275 | 102 | 102 | 1.35% | 1.63% | 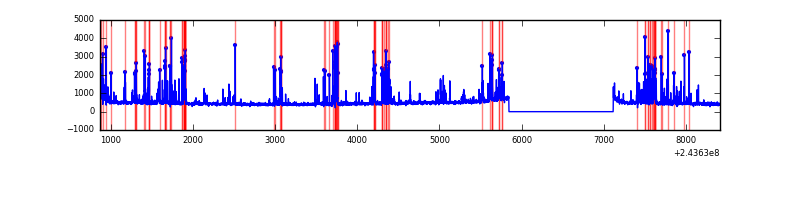 |
| D | 7544 | 6275 | 147 | 147 | 1.95% | 2.34% | 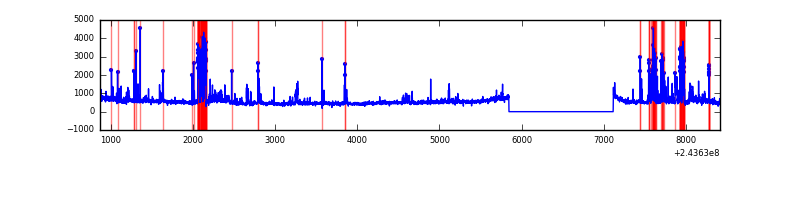 |
Top three noisy pixels from each quadrant. If the there are fewer than three noisy pixels in the level2.evt file, extra rows are filled as -1
| Pixel properties | Quadrant properties | ||||||
|---|---|---|---|---|---|---|---|
| Quadrant | DetID | PixID | Counts | Sigma | Mean | Median | Sigma |
| A | 15 | 174 | 99301 | 643.5 | 757 | 743 | 153.2 |
| A | 1 | 162 | 17033 | 106.36 | 757 | 743 | 153.2 |
| A | 11 | 29 | 8534 | 50.87 | 757 | 743 | 153.2 |
| B | 4 | 239 | 1816809 | 12829.15 | 745 | 728 | 141.6 |
| B | 4 | 81 | 166425 | 1170.52 | 745 | 728 | 141.6 |
| B | 0 | 219 | 114193 | 801.54 | 745 | 728 | 141.6 |
| C | 4 | 254 | 798720 | 4758.09 | 724 | 730 | 167.7 |
| C | 14 | 234 | 8500 | 46.33 | 724 | 730 | 167.7 |
| C | 13 | 61 | 5468 | 28.25 | 724 | 730 | 167.7 |
| D | 10 | 199 | 383865 | 2204.37 | 715 | 695 | 173.8 |
| D | 8 | 195 | 298862 | 1715.35 | 715 | 695 | 173.8 |
| D | 7 | 71 | 177280 | 1015.89 | 715 | 695 | 173.8 |
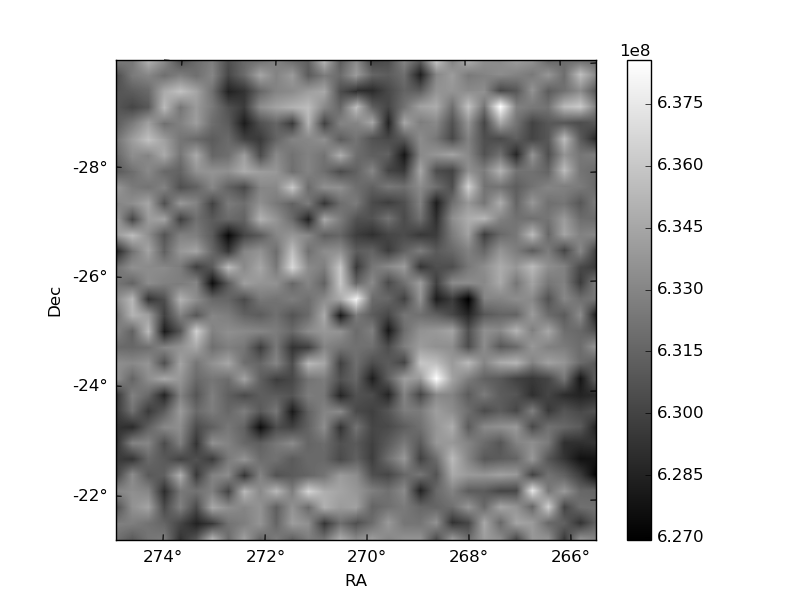
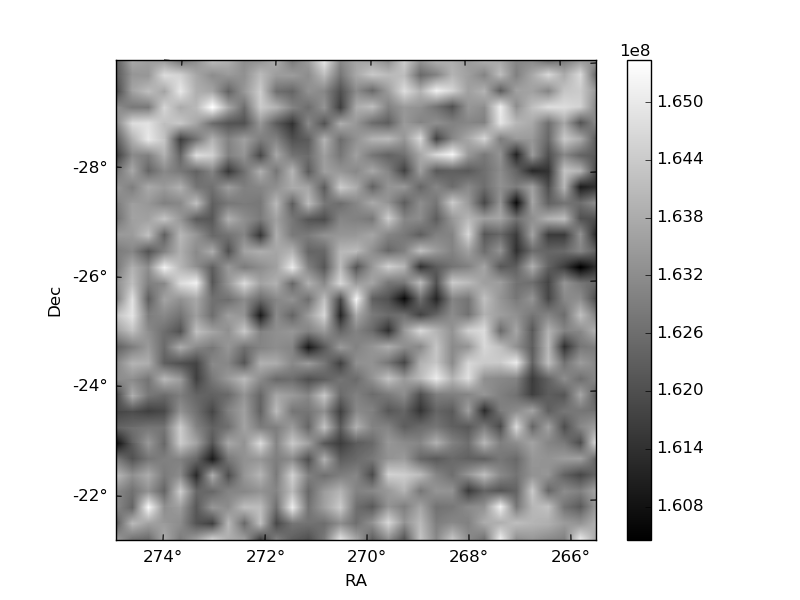
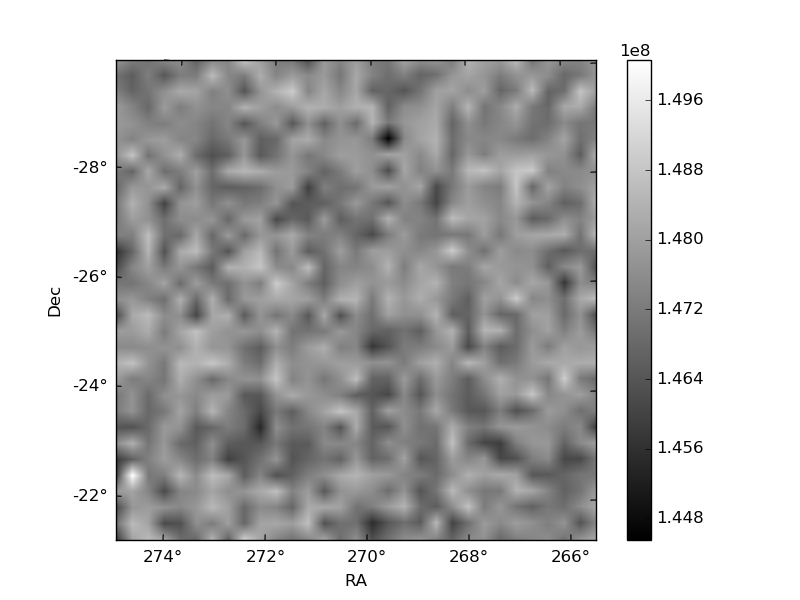
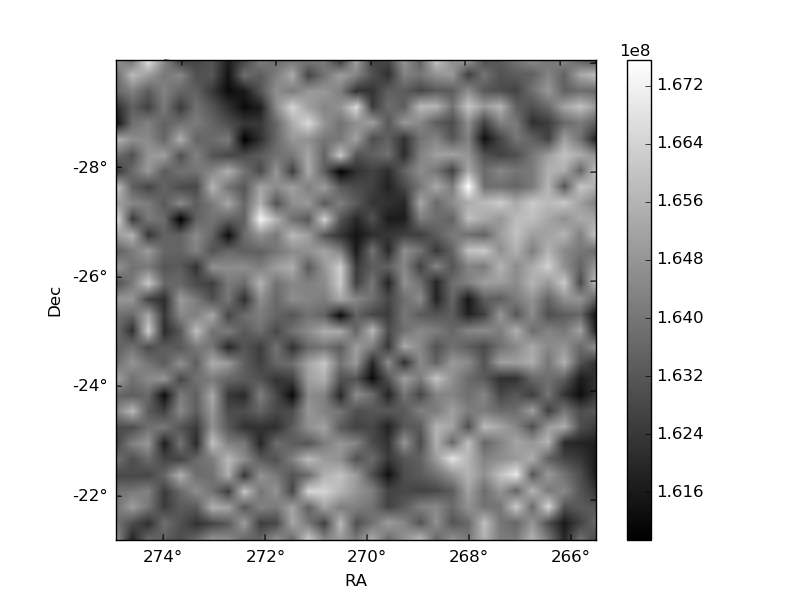
Histogram calculated using DETX and DETY for each event in the final _common_clean file
| Quadrant A | 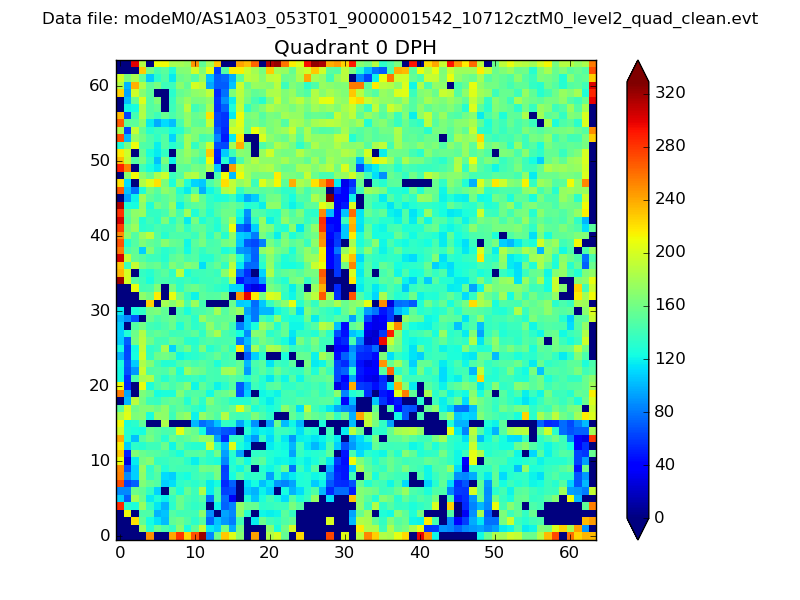 |
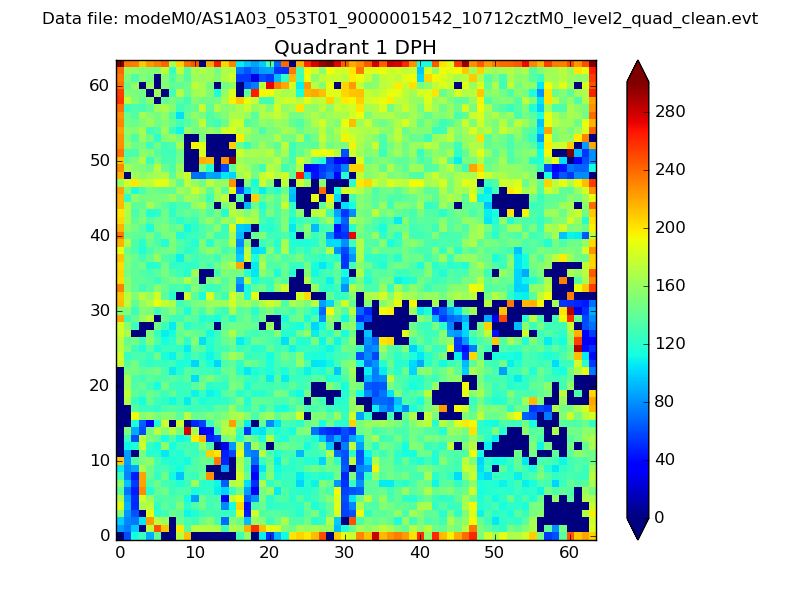 |
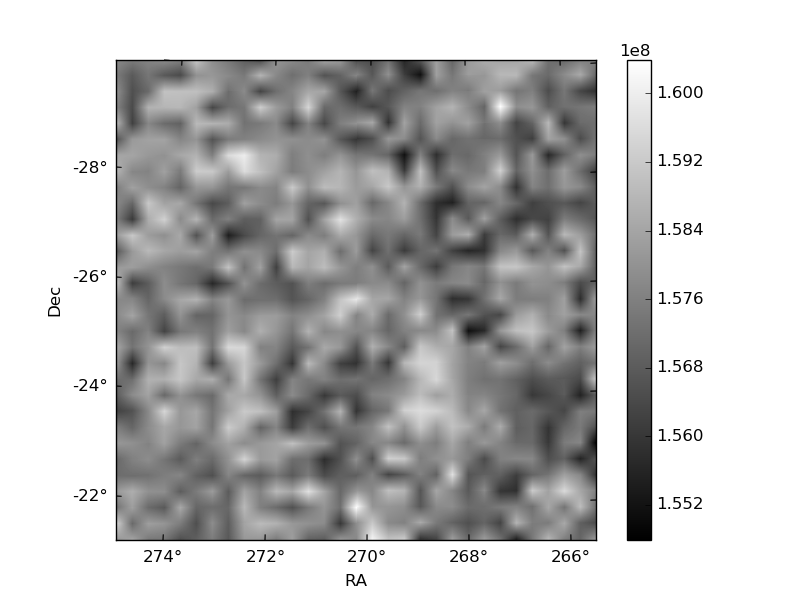
Quadrant B |
|---|---|---|---|
| Quadrant D | 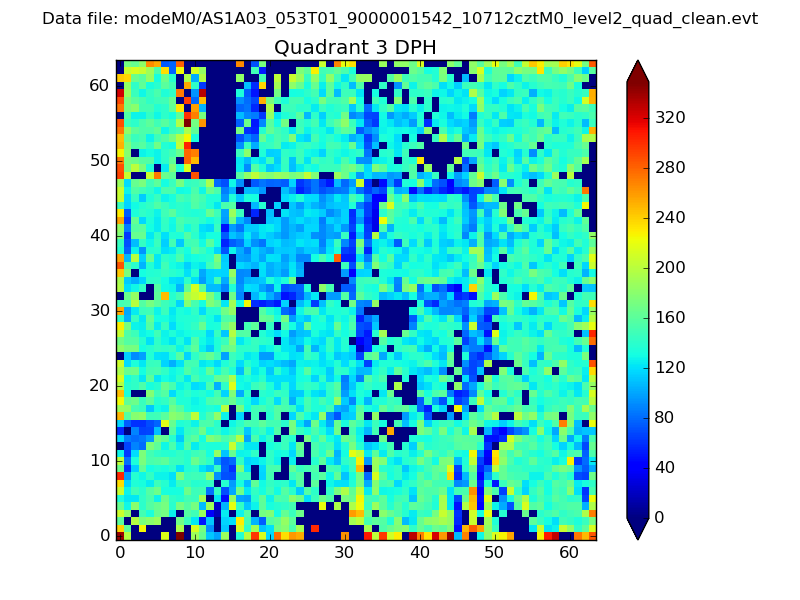 |
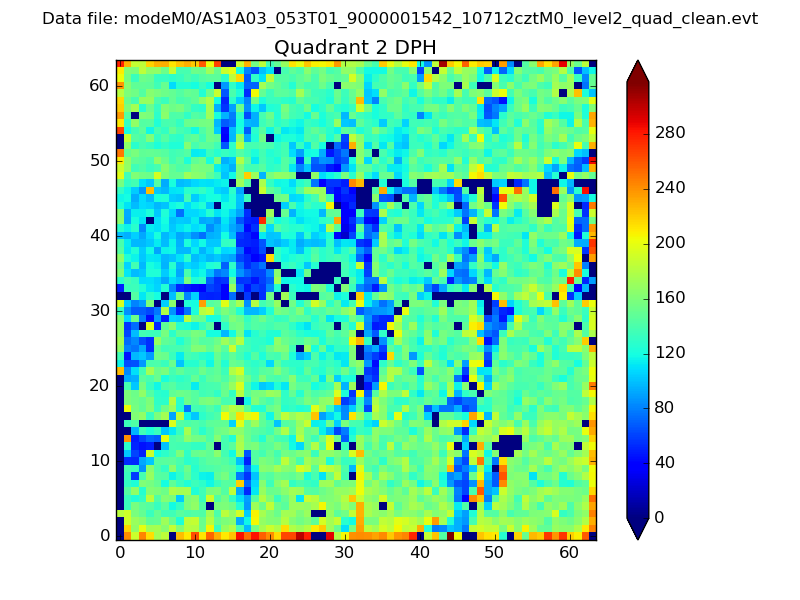 |
Quadrant C |
| Plot type | Count rate plots | Images |
|---|---|---|
| Comparison with Poisson distribution Blue bars denote a histogram of data divided into 1 sec bins. Red curve is a Poisson curve with rate = median count rate of data. |
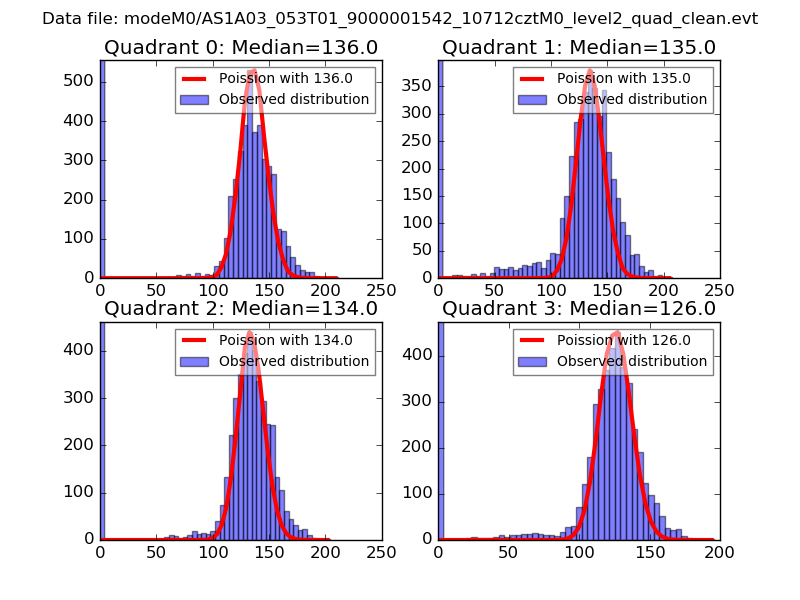 |
 |
| Quadrant-wise count rates Data is divided into 100 sec bins |
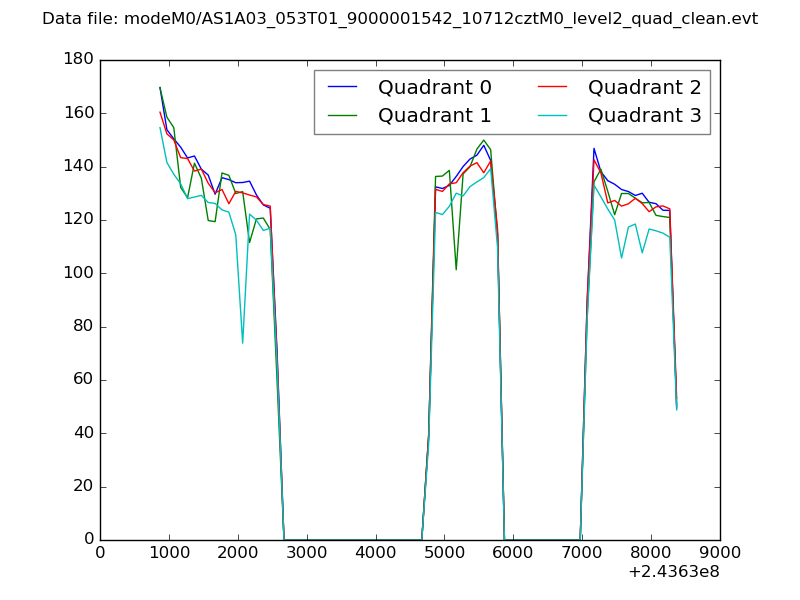 |
|
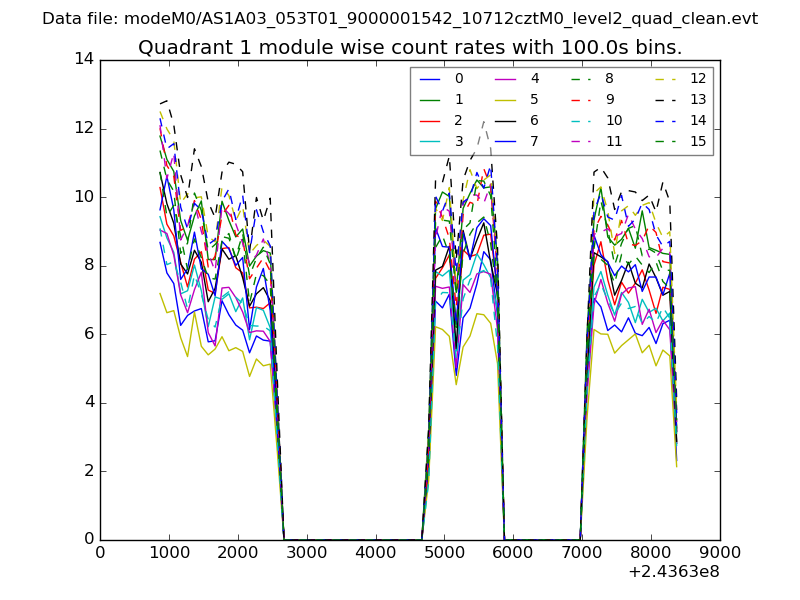
| Module-wise count rates for Quadrant A Data is divided into 100 sec bins |
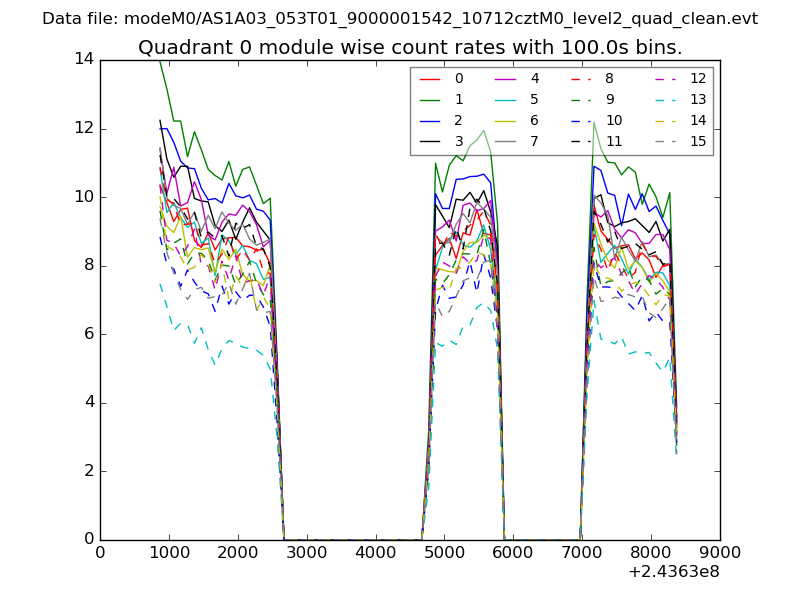 |
 |
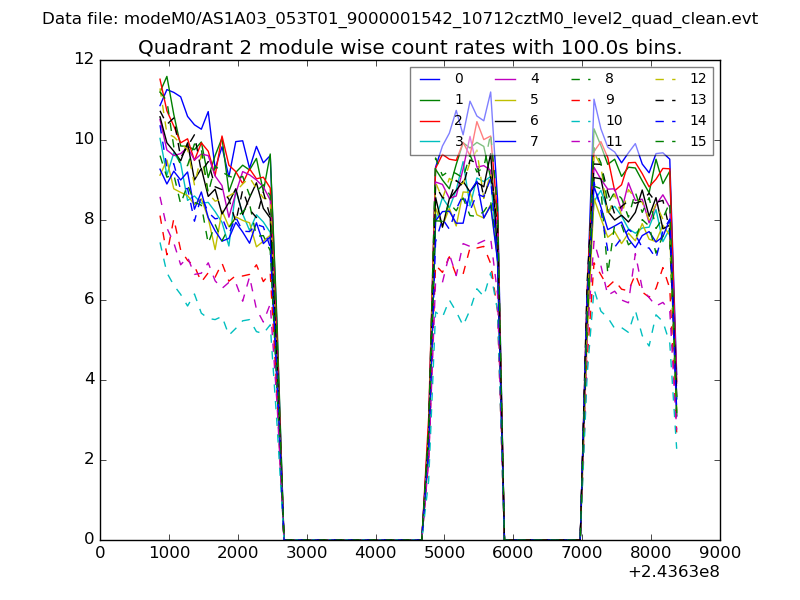
| Module-wise count rates for Quadrant B Data is divided into 100 sec bins |
 |
 |
| Module-wise count rates for Quadrant C Data is divided into 100 sec bins |
 |
 |
| Module-wise count rates for Quadrant D Data is divided into 100 sec bins |
 |
 |
| Parameter | Plot |
|---|---|
| CZT HV Monitor | 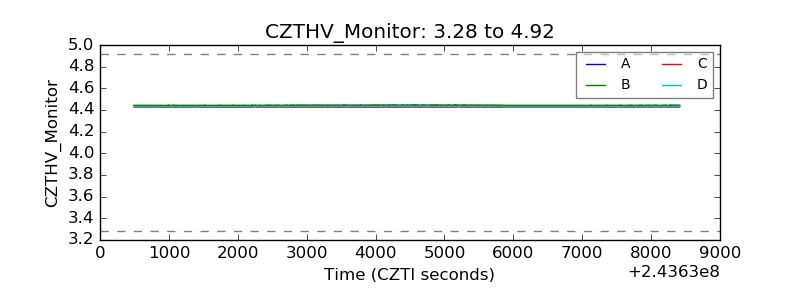 |
| D_VDD | 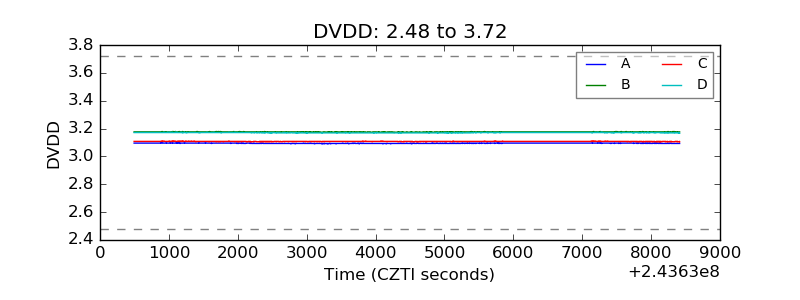 |
| Temperature 1 | 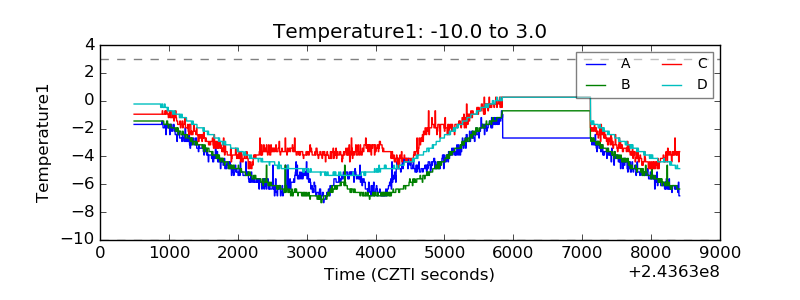 |
| Veto HV Monitor | 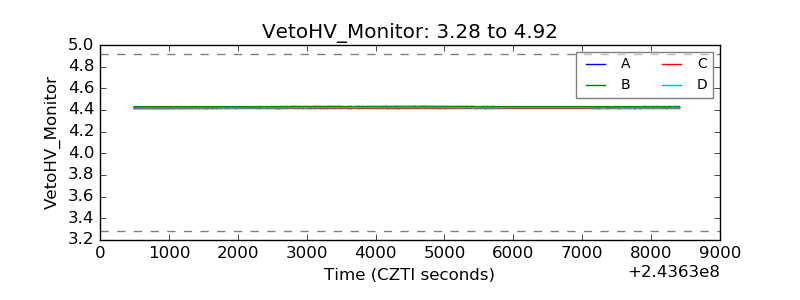 |
| Veto LLD | 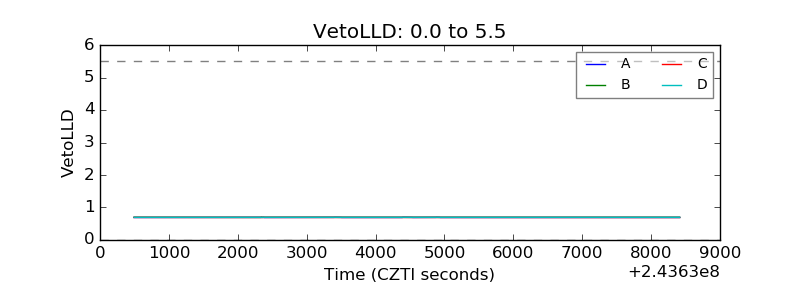 |
| Alpha Counter | 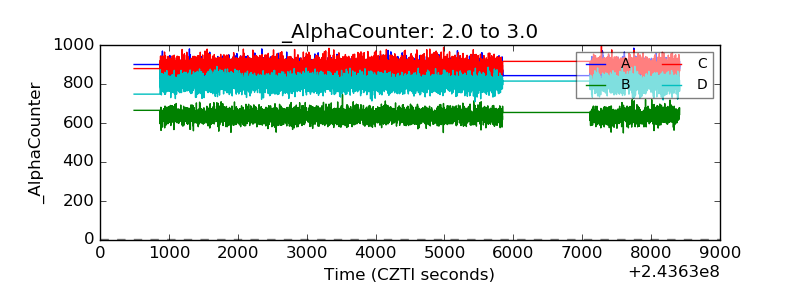 |
| _CPM_Rate | 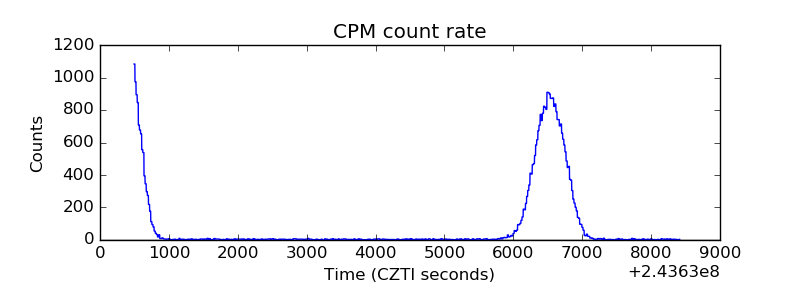 |
| CZT Counter | 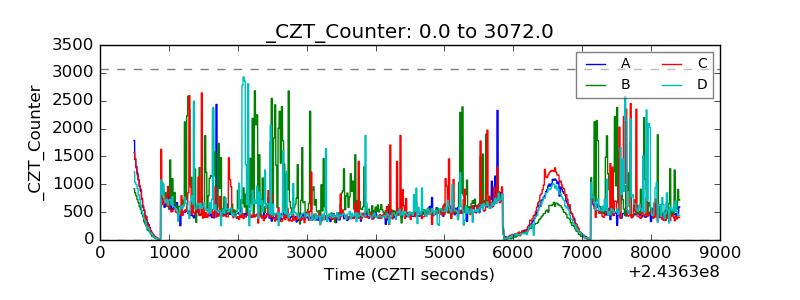 |
| +2.5 Volts monitor |  |
| +5 Volts monitor | 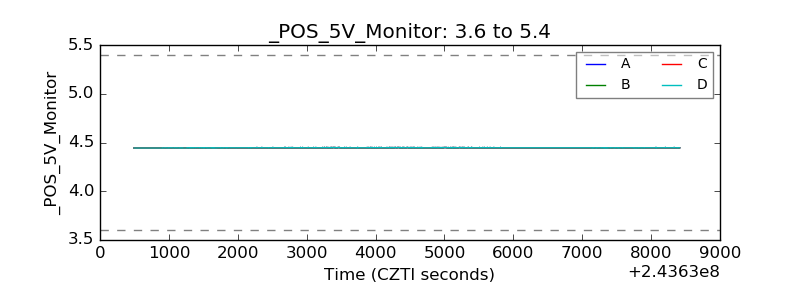 |
| _ROLL_ROT | 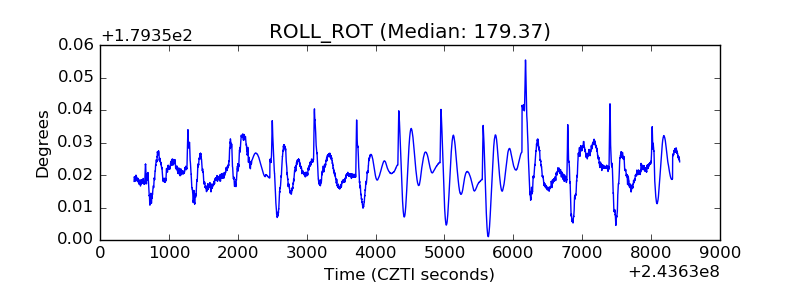 |
| _Roll_DEC | 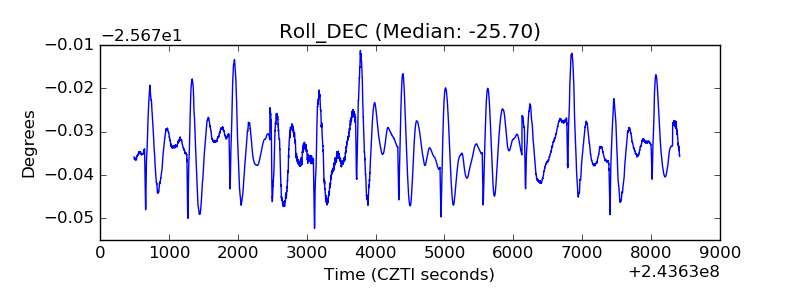 |
| _Roll_RA | 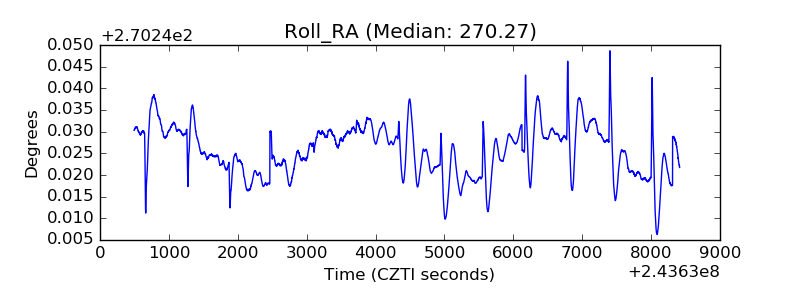 |
| Veto Counter | 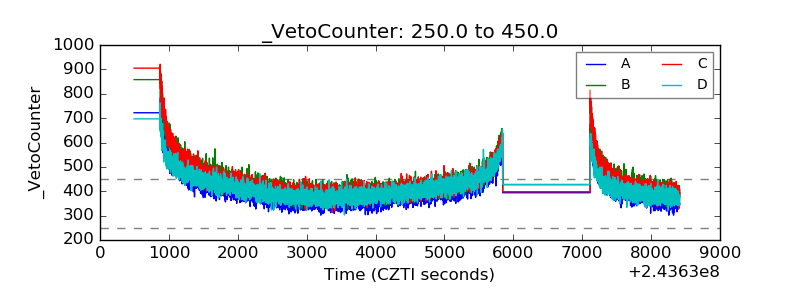 |