| Param | Original file | Final file |
|---|---|---|
| Filename | modeM0/AS1A03_078T01_9000001546cztM0_level2.fits | modeM0/AS1A03_078T01_9000001546cztM0_level2_quad_clean.evt |
| Size (bytes) | 1,169,671,680 | 1,154,102,400 |
| Size | 1.1 GB | 1.1 GB |
| Events in quadrant A | 7,015,036 | 6,825,960 |
| Events in quadrant B | 6,824,586 | 6,920,198 |
| Events in quadrant C | 7,134,146 | 6,803,034 |
| Events in quadrant D | 5,781,866 | 5,745,655 |
| Mode M0 | |||
|---|---|---|---|
| Quadrant | BADHDUFLAG | Total packets | Discarded packets |
| A | 0 | 316621 | 0 |
| B | 0 | 315751 | 0 |
| C | 0 | 261251 | 0 |
| D | 0 | 397180 | 0 |
| Mode SS | |||
|---|---|---|---|
| Quadrant | BADHDUFLAG | Total packets | Discarded packets |
| A | 0 | 2584 | 0 |
| B | 0 | 2582 | 0 |
| C | 0 | 2588 | 0 |
| D | 0 | 2586 | 0 |
| Mode M9 | |||
|---|---|---|---|
| Quadrant | BADHDUFLAG | Total packets | Discarded packets |
| A | 0 | 176 | 0 |
| B | 0 | 176 | 0 |
| C | 0 | 176 | 0 |
| D | 0 | 176 | 0 |
| Quadrant | Total seconds | Saturated seconds | Saturation percentage |
|---|---|---|---|
| A | 126382 | 5224 | 4.133500% |
| B | 126430 | 5835 | 4.615202% |
| C | 126524 | 1009 | 0.797477% |
| D | 125869 | 13490 | 10.717492% |
Noise dominated data is calculated using 1-second bins in cleaned event files. If a bin has >2000 counts, and if more than 50% of those come from <1% of pixels, then it is considered to be noise-dominated and hence unusable.
| Quadrant | # 1 sec bins | Bins with >0 counts | Bins with >2000 counts | High rate bins dominated by noise | Noise dominated (total time) | Noise dominated (detector-on time) | Marked lightcurve |
|---|---|---|---|---|---|---|---|
| A | 145086 | 126837 | 0 | 0 | 0.00% | 0.00% |  |
| B | 145086 | 126919 | 0 | 0 | 0.00% | 0.00% |  |
| C | 145086 | 127011 | 0 | 0 | 0.00% | 0.00% |  |
| D | 145086 | 125251 | 0 | 0 | 0.00% | 0.00% |  |
Top three noisy pixels from each quadrant. If the there are fewer than three noisy pixels in the level2.evt file, extra rows are filled as -1
| Pixel properties | Quadrant properties | ||||||
|---|---|---|---|---|---|---|---|
| Quadrant | DetID | PixID | Counts | Sigma | Mean | Median | Sigma |
| A | 0 | 29 | 6605 | 10.68 | 1826 | 1703 | 459.1 |
| A | 7 | 110 | 5668 | 8.64 | 1826 | 1703 | 459.1 |
| A | 9 | 19 | 5299 | 7.83 | 1826 | 1703 | 459.1 |
| B | 2 | 9 | 5881 | 11.55 | 1797 | 1703 | 361.7 |
| B | 3 | 17 | 4698 | 8.28 | 1797 | 1703 | 361.7 |
| B | 5 | 128 | 4555 | 7.88 | 1797 | 1703 | 361.7 |
| C | 1 | 80 | 5276 | 7.19 | 1885 | 1745 | 491.2 |
| C | 1 | 81 | 5165 | 6.96 | 1885 | 1745 | 491.2 |
| C | 12 | 241 | 5067 | 6.76 | 1885 | 1745 | 491.2 |
| D | 3 | 14 | 4442 | 6.65 | 1651 | 1503 | 442.2 |
| D | 6 | 231 | 4253 | 6.22 | 1651 | 1503 | 442.2 |
| D | 3 | 31 | 4052 | 5.76 | 1651 | 1503 | 442.2 |
Histogram calculated using DETX and DETY for each event in the final _common_clean file
| Quadrant A |  |
 |
Quadrant B |
|---|---|---|---|
| Quadrant D | 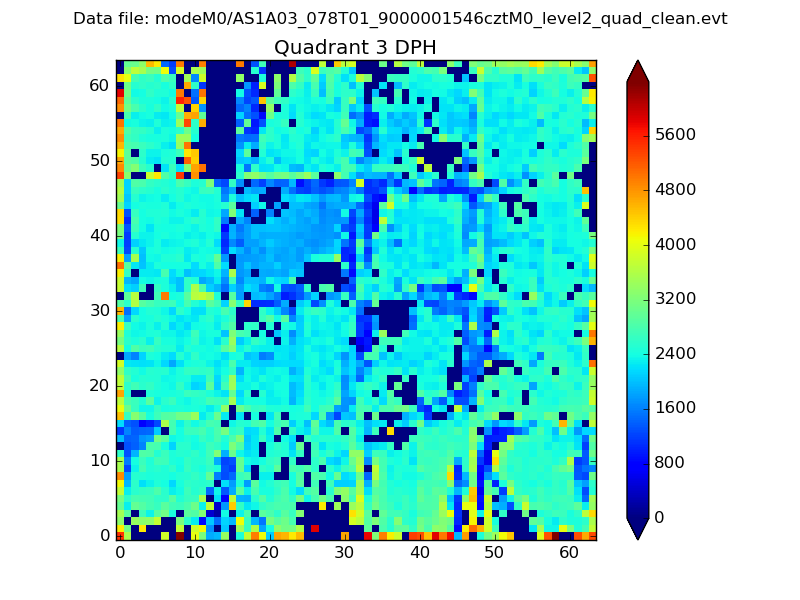 |
 |
Quadrant C |
| Plot type | Count rate plots | Images |
|---|---|---|
| Comparison with Poisson distribution Blue bars denote a histogram of data divided into 1 sec bins. Red curve is a Poisson curve with rate = median count rate of data. |
 |
 |
| Quadrant-wise count rates Data is divided into 100 sec bins |
 |
|
| Module-wise count rates for Quadrant A Data is divided into 100 sec bins |
 |
 |
| Module-wise count rates for Quadrant B Data is divided into 100 sec bins |
 |
 |
| Module-wise count rates for Quadrant C Data is divided into 100 sec bins |
 |
 |
| Module-wise count rates for Quadrant D Data is divided into 100 sec bins |
 |
 |
| Parameter | Plot |
|---|---|
| CZT HV Monitor |  |
| D_VDD |  |
| Temperature 1 |  |
| Veto HV Monitor |  |
| Veto LLD |  |
| Alpha Counter |  |
| _CPM_Rate |  |
| CZT Counter |  |
| +2.5 Volts monitor |  |
| +5 Volts monitor |  |
| _ROLL_ROT |  |
| _Roll_DEC |  |
| _Roll_RA | 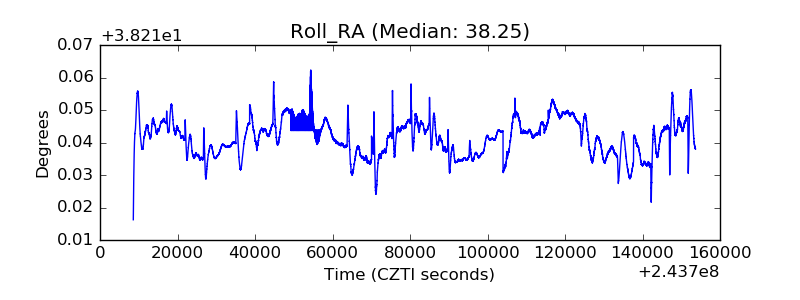 |
| Veto Counter |  |