| Param | Original file | Final file |
|---|---|---|
| Filename | modeM0/AS1A03_078T01_9000001546_10725cztM0_level2.evt | modeM0/AS1A03_078T01_9000001546_10725cztM0_level2_quad_clean.evt |
| Size (bytes) | 301,648,320 | 55,287,360 |
| Size | 287.7 MB | 52.7 MB |
| Events in quadrant A | 1,869,909 | 356,792 |
| Events in quadrant B | 2,792,464 | 355,674 |
| Events in quadrant C | 1,788,584 | 359,756 |
| Events in quadrant D | 2,433,370 | 341,619 |
| Mode M0 | |||
|---|---|---|---|
| Quadrant | BADHDUFLAG | Total packets | Discarded packets |
| A | 0 | 8016 | 2 |
| B | 0 | 10834 | 1 |
| C | 0 | 7798 | 1 |
| D | 0 | 9757 | 1 |
| Mode SS | |||
|---|---|---|---|
| Quadrant | BADHDUFLAG | Total packets | Discarded packets |
| A | 0 | 76 | 0 |
| B | 0 | 76 | 0 |
| C | 0 | 76 | 0 |
| D | 0 | 76 | 0 |
| Mode M9 | |||
|---|---|---|---|
| Quadrant | BADHDUFLAG | Total packets | Discarded packets |
| A | 0 | 14 | 0 |
| B | 0 | 14 | 0 |
| C | 0 | 14 | 0 |
| D | 0 | 14 | 0 |
| Quadrant | Total seconds | Saturated seconds | Saturation percentage |
|---|---|---|---|
| A | 3674 | 41 | 1.115950% |
| B | 3674 | 342 | 9.308655% |
| C | 3674 | 35 | 0.952640% |
| D | 3674 | 203 | 5.525313% |
Noise dominated data is calculated using 1-second bins in cleaned event files. If a bin has >2000 counts, and if more than 50% of those come from <1% of pixels, then it is considered to be noise-dominated and hence unusable.
| Quadrant | # 1 sec bins | Bins with >0 counts | Bins with >2000 counts | High rate bins dominated by noise | Noise dominated (total time) | Noise dominated (detector-on time) | Marked lightcurve |
|---|---|---|---|---|---|---|---|
| A | 5029 | 3675 | 1 | 1 | 0.02% | 0.03% | 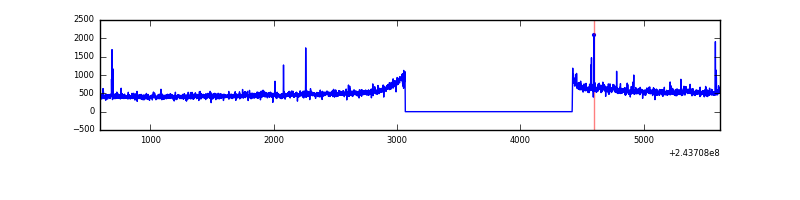 |
| B | 5029 | 3675 | 168 | 168 | 3.34% | 4.57% |  |
| C | 5029 | 3675 | 0 | 0 | 0.00% | 0.00% | 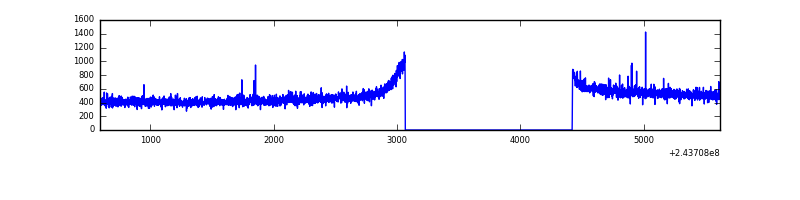 |
| D | 5029 | 3675 | 123 | 123 | 2.45% | 3.35% | 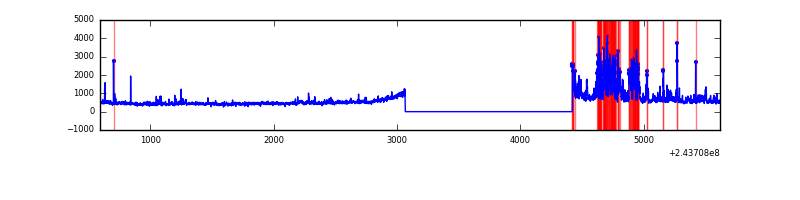 |
Top three noisy pixels from each quadrant. If the there are fewer than three noisy pixels in the level2.evt file, extra rows are filled as -1
| Pixel properties | Quadrant properties | ||||||
|---|---|---|---|---|---|---|---|
| Quadrant | DetID | PixID | Counts | Sigma | Mean | Median | Sigma |
| A | 15 | 174 | 30033 | 307.94 | 465 | 456 | 96.0 |
| A | 4 | 2 | 13554 | 136.37 | 465 | 456 | 96.0 |
| A | 13 | 251 | 10785 | 107.54 | 465 | 456 | 96.0 |
| B | 4 | 239 | 863226 | 9758.83 | 456 | 445 | 88.4 |
| B | 4 | 81 | 87847 | 988.6 | 456 | 445 | 88.4 |
| B | 0 | 219 | 19446 | 214.92 | 456 | 445 | 88.4 |
| C | 12 | 4 | 3654 | 29.8 | 456 | 460 | 107.2 |
| C | 14 | 234 | 3565 | 28.97 | 456 | 460 | 107.2 |
| C | 13 | 61 | 3392 | 27.36 | 456 | 460 | 107.2 |
| D | 12 | 233 | 294701 | 2739.79 | 443 | 430 | 107.4 |
| D | 10 | 199 | 175946 | 1634.13 | 443 | 430 | 107.4 |
| D | 8 | 195 | 128086 | 1188.53 | 443 | 430 | 107.4 |
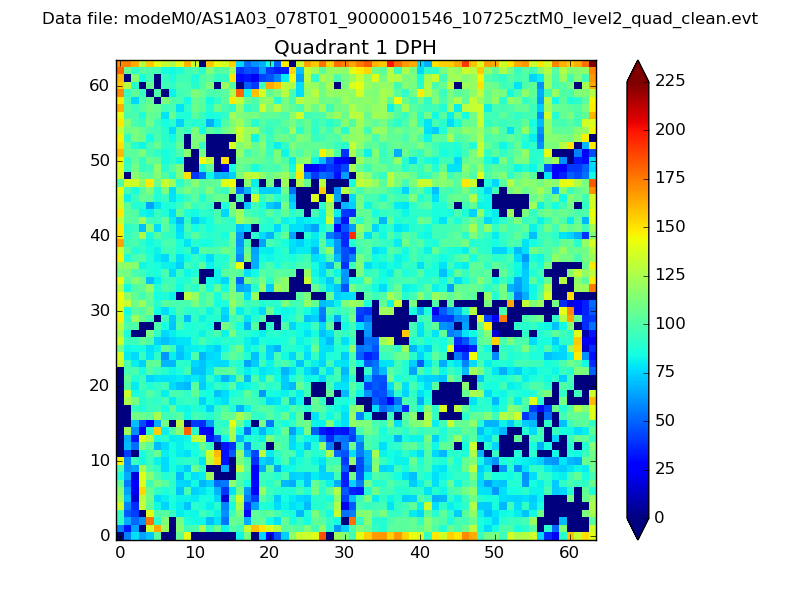
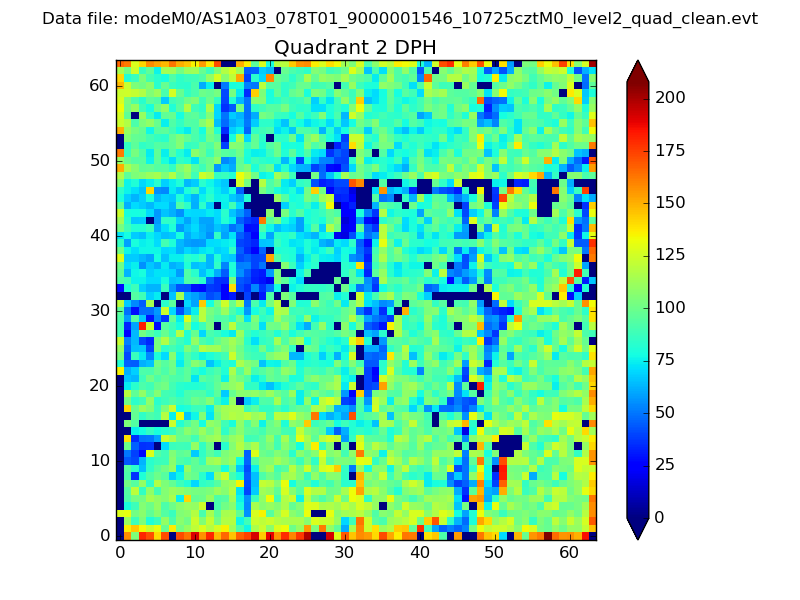
Histogram calculated using DETX and DETY for each event in the final _common_clean file
| Quadrant A | 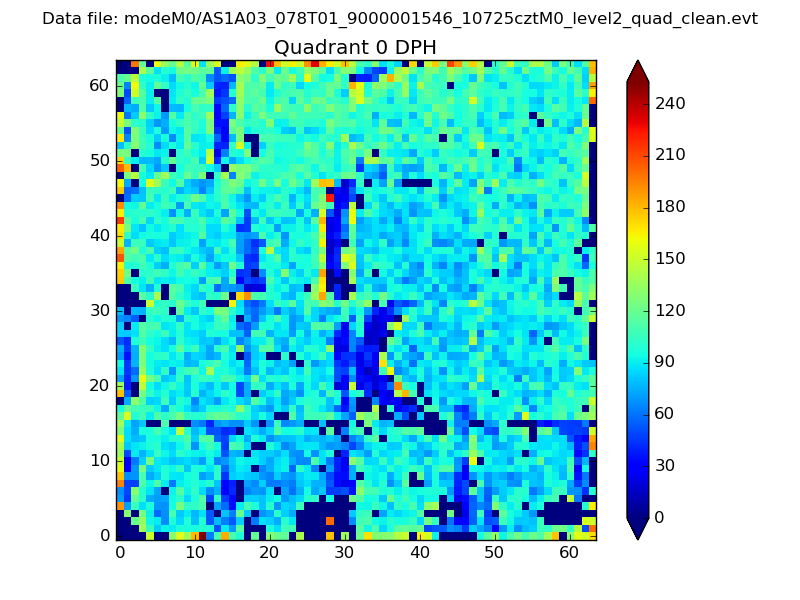 |
 |
Quadrant B |
|---|---|---|---|
| Quadrant D | 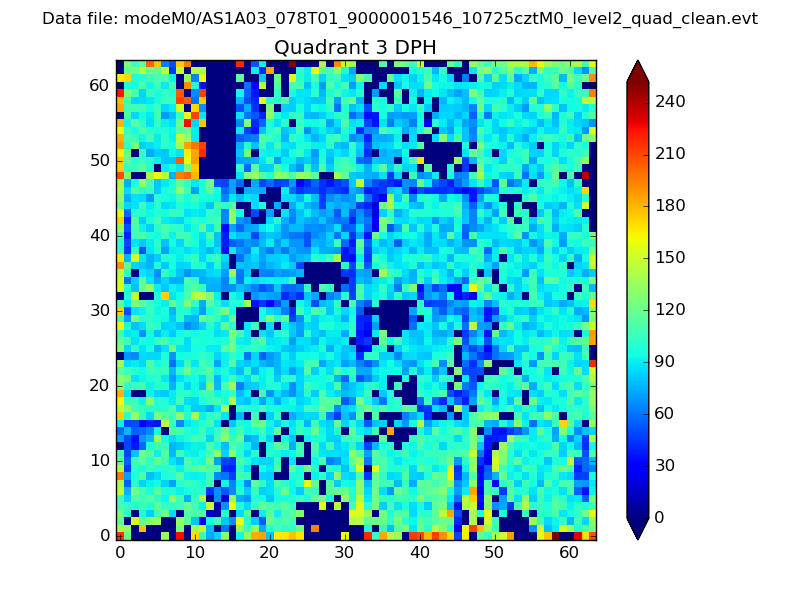 |
 |
Quadrant C |
| Plot type | Count rate plots | Images |
|---|---|---|
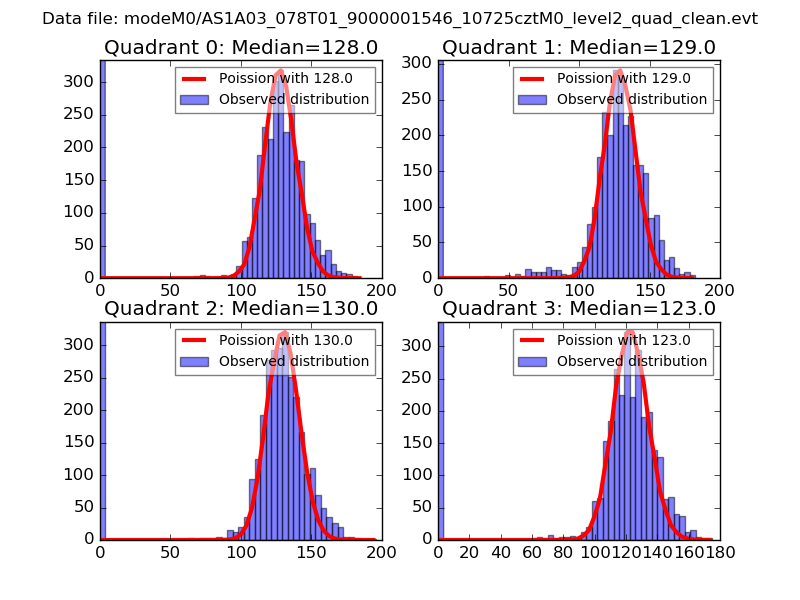
| Comparison with Poisson distribution Blue bars denote a histogram of data divided into 1 sec bins. Red curve is a Poisson curve with rate = median count rate of data. |
 |
 |
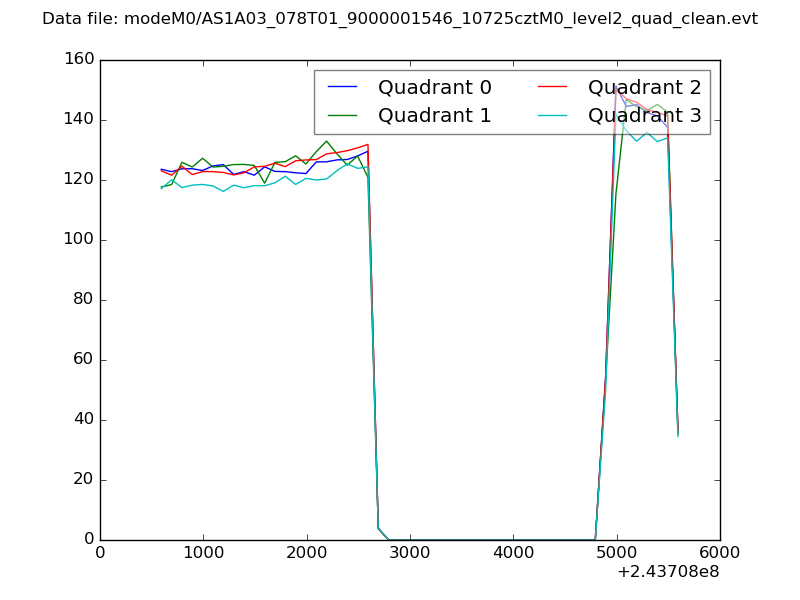
| Quadrant-wise count rates Data is divided into 100 sec bins |
 |
|
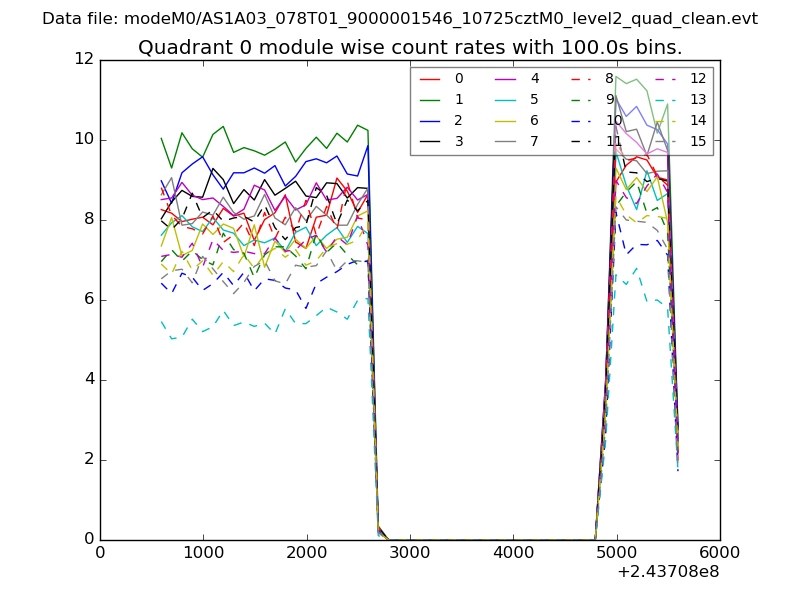
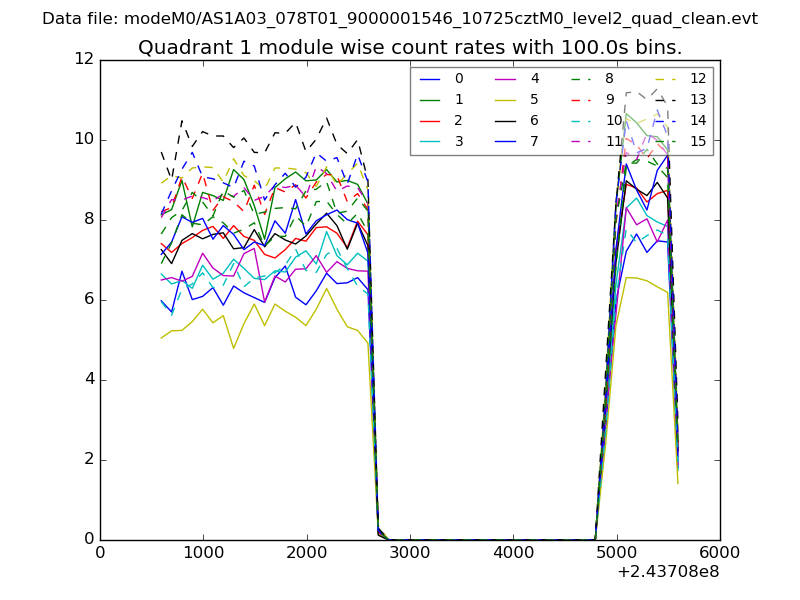
| Module-wise count rates for Quadrant A Data is divided into 100 sec bins |
 |
 |
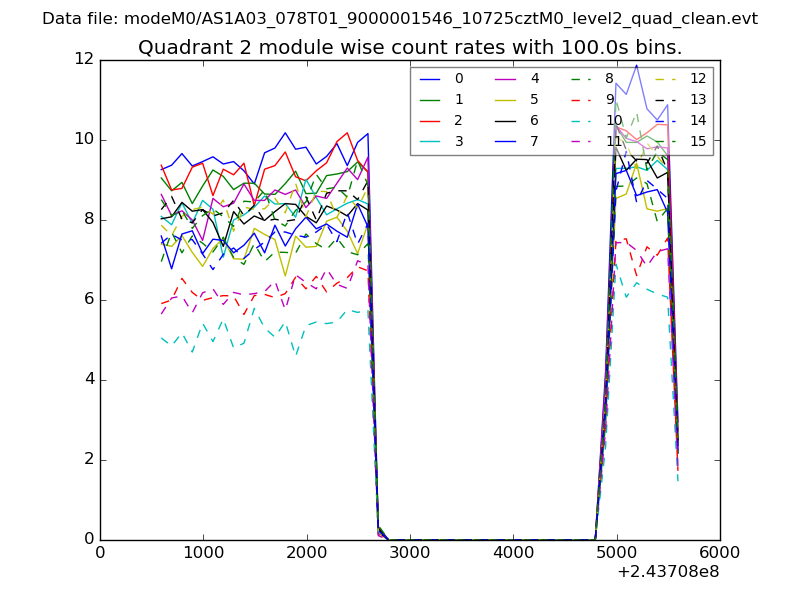
| Module-wise count rates for Quadrant B Data is divided into 100 sec bins |
 |
 |
| Module-wise count rates for Quadrant C Data is divided into 100 sec bins |
 |
 |
| Module-wise count rates for Quadrant D Data is divided into 100 sec bins |
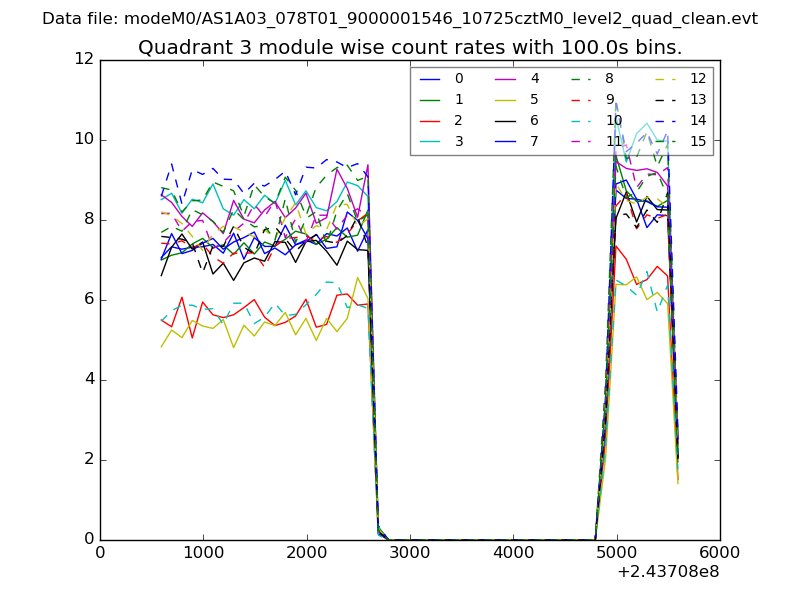 |
 |
| Parameter | Plot |
|---|---|
| CZT HV Monitor | 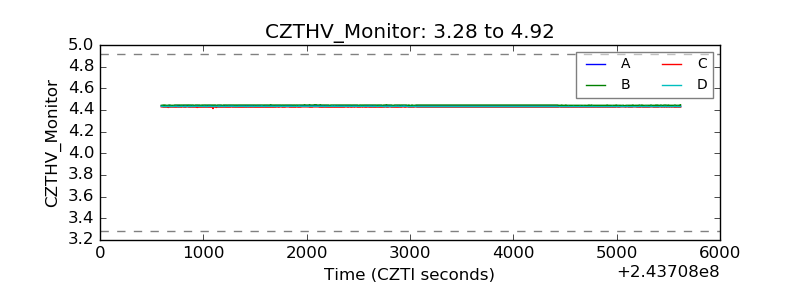 |
| D_VDD | 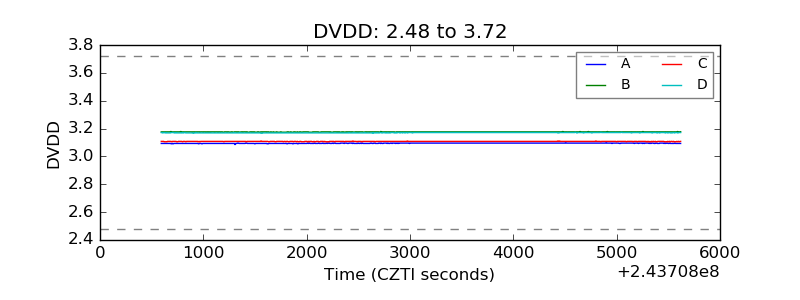 |
| Temperature 1 | 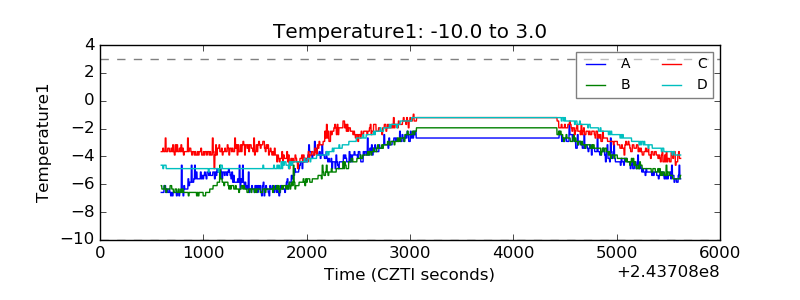 |
| Veto HV Monitor | 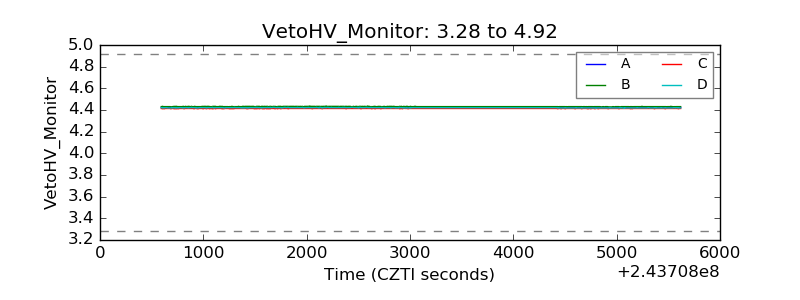 |
| Veto LLD | 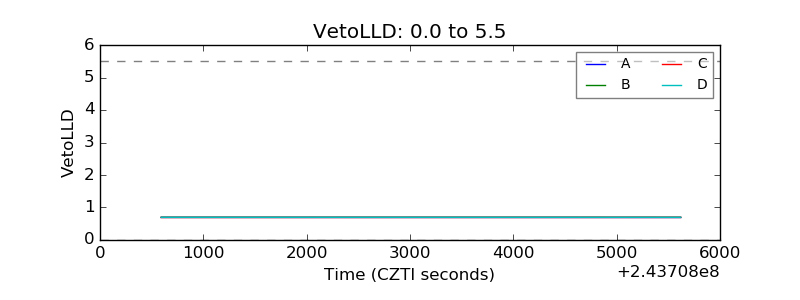 |
| Alpha Counter | 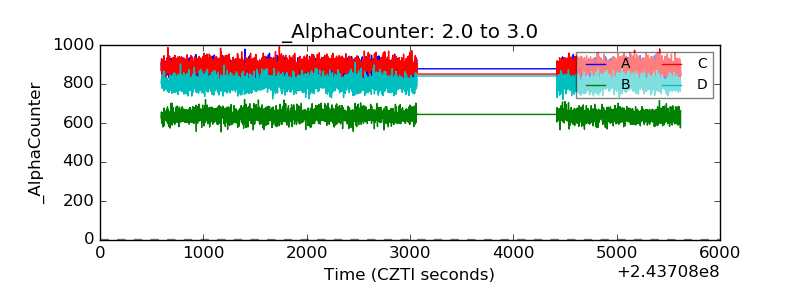 |
| _CPM_Rate | 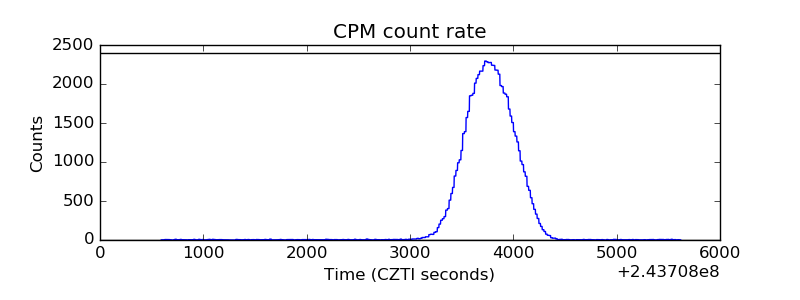 |
| CZT Counter | 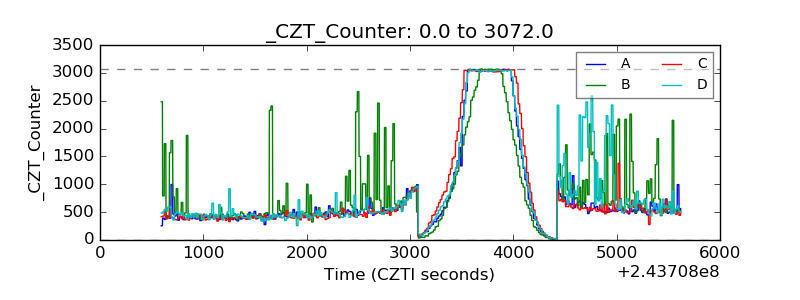 |
| +2.5 Volts monitor |  |
| +5 Volts monitor | 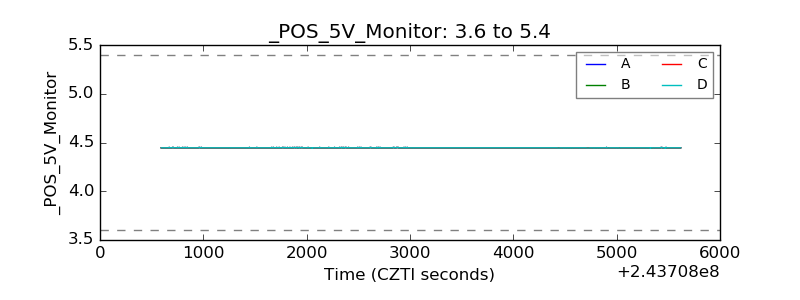 |
| _ROLL_ROT | 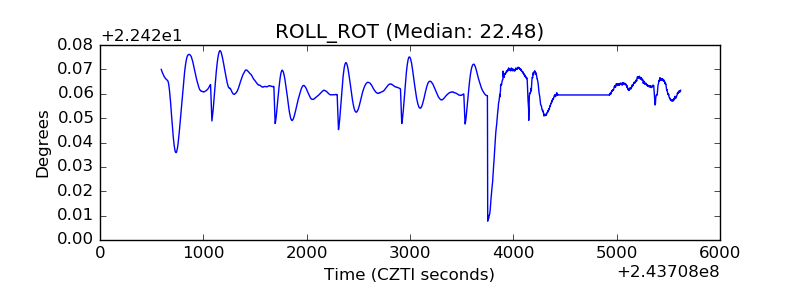 |
| _Roll_DEC | 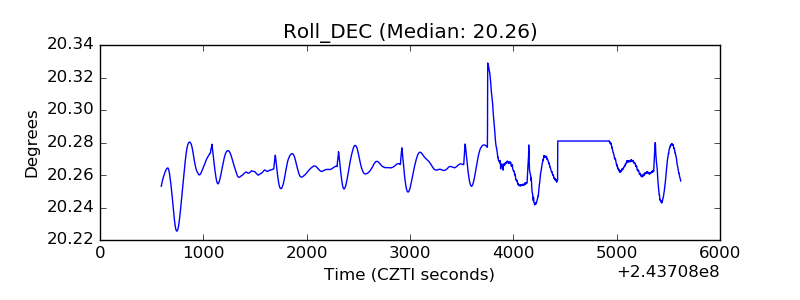 |
| _Roll_RA | 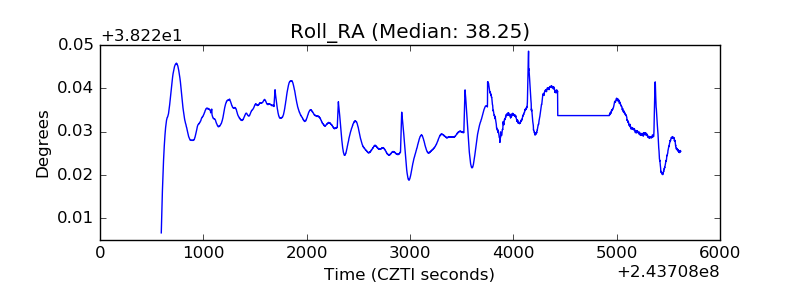 |
| Veto Counter | 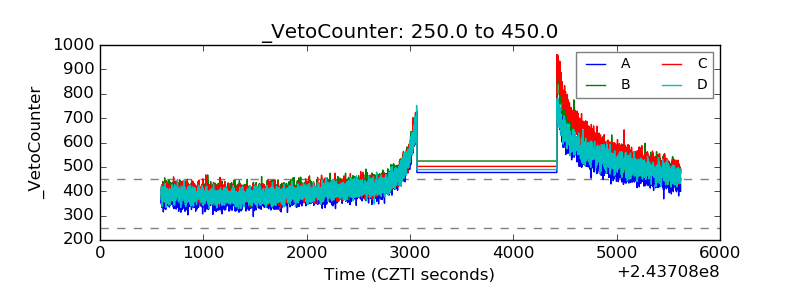 |