| Param | Original file | Final file |
|---|---|---|
| Filename | modeM0/AS1A03_078T01_9000001546_10726cztM0_level2.evt | modeM0/AS1A03_078T01_9000001546_10726cztM0_level2_quad_clean.evt |
| Size (bytes) | 512,222,400 | 95,572,800 |
| Size | 488.5 MB | 91.1 MB |
| Events in quadrant A | 3,285,716 | 615,834 |
| Events in quadrant B | 4,679,945 | 621,853 |
| Events in quadrant C | 3,048,124 | 629,889 |
| Events in quadrant D | 4,076,151 | 591,635 |
| Mode M0 | |||
|---|---|---|---|
| Quadrant | BADHDUFLAG | Total packets | Discarded packets |
| A | 0 | 13907 | 3 |
| B | 0 | 18082 | 2 |
| C | 0 | 13162 | 2 |
| D | 0 | 16399 | 2 |
| Mode SS | |||
|---|---|---|---|
| Quadrant | BADHDUFLAG | Total packets | Discarded packets |
| A | 0 | 128 | 0 |
| B | 0 | 128 | 0 |
| C | 0 | 128 | 0 |
| D | 0 | 128 | 0 |
| Mode M9 | |||
|---|---|---|---|
| Quadrant | BADHDUFLAG | Total packets | Discarded packets |
| A | 0 | 27 | 0 |
| B | 0 | 27 | 0 |
| C | 0 | 27 | 0 |
| D | 0 | 27 | 0 |
| Quadrant | Total seconds | Saturated seconds | Saturation percentage |
|---|---|---|---|
| A | 6236 | 117 | 1.876203% |
| B | 6236 | 427 | 6.847338% |
| C | 6236 | 48 | 0.769724% |
| D | 6236 | 252 | 4.041052% |
Noise dominated data is calculated using 1-second bins in cleaned event files. If a bin has >2000 counts, and if more than 50% of those come from <1% of pixels, then it is considered to be noise-dominated and hence unusable.
| Quadrant | # 1 sec bins | Bins with >0 counts | Bins with >2000 counts | High rate bins dominated by noise | Noise dominated (total time) | Noise dominated (detector-on time) | Marked lightcurve |
|---|---|---|---|---|---|---|---|
| A | 8906 | 6238 | 63 | 63 | 0.71% | 1.01% | 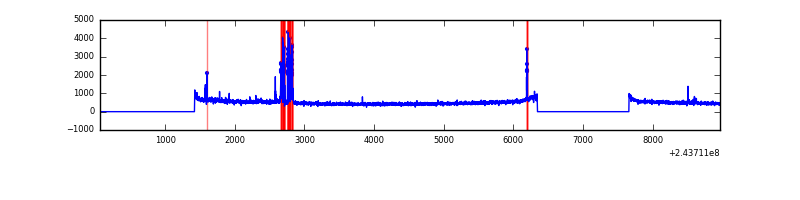 |
| B | 8906 | 6238 | 231 | 231 | 2.59% | 3.70% | 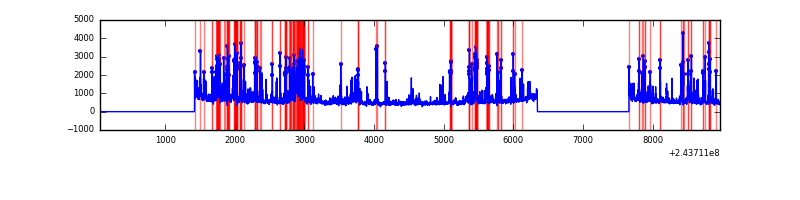 |
| C | 8906 | 6238 | 6 | 6 | 0.07% | 0.10% | 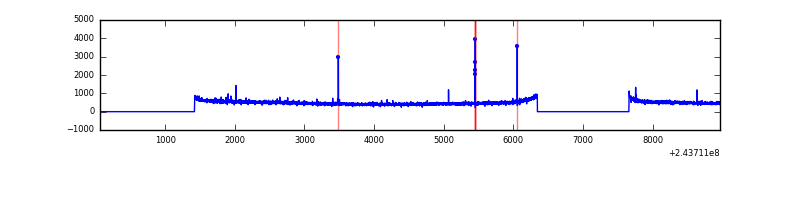 |
| D | 8906 | 6238 | 159 | 159 | 1.79% | 2.55% | 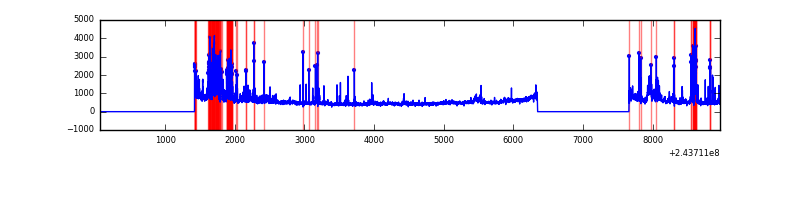 |
Top three noisy pixels from each quadrant. If the there are fewer than three noisy pixels in the level2.evt file, extra rows are filled as -1
| Pixel properties | Quadrant properties | ||||||
|---|---|---|---|---|---|---|---|
| Quadrant | DetID | PixID | Counts | Sigma | Mean | Median | Sigma |
| A | 15 | 174 | 244474 | 1547.48 | 775 | 762 | 157.5 |
| A | 1 | 162 | 16194 | 97.99 | 775 | 762 | 157.5 |
| A | 4 | 2 | 13184 | 78.87 | 775 | 762 | 157.5 |
| B | 4 | 239 | 1226647 | 8254.9 | 777 | 759 | 148.5 |
| B | 4 | 81 | 325523 | 2186.9 | 777 | 759 | 148.5 |
| B | 0 | 219 | 37929 | 250.3 | 777 | 759 | 148.5 |
| C | 14 | 234 | 26929 | 146.23 | 773 | 780 | 178.8 |
| C | 13 | 61 | 5783 | 27.98 | 773 | 780 | 178.8 |
| C | 12 | 4 | 4695 | 21.89 | 773 | 780 | 178.8 |
| D | 12 | 233 | 390971 | 2152.26 | 752 | 732 | 181.3 |
| D | 10 | 199 | 286710 | 1577.23 | 752 | 732 | 181.3 |
| D | 8 | 195 | 185343 | 1018.17 | 752 | 732 | 181.3 |
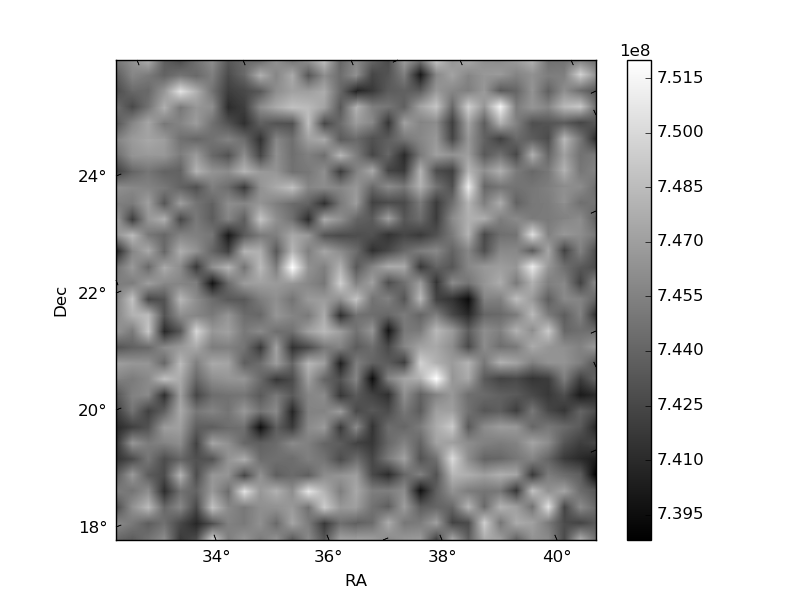
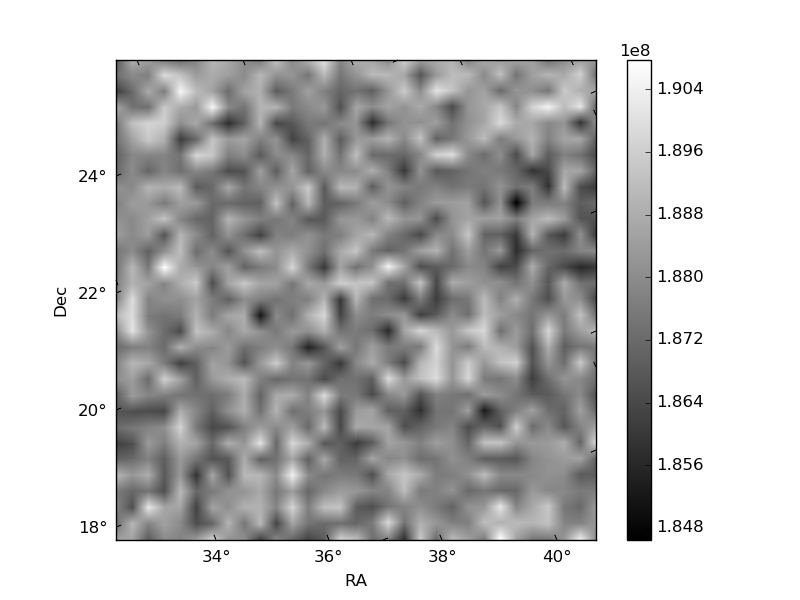
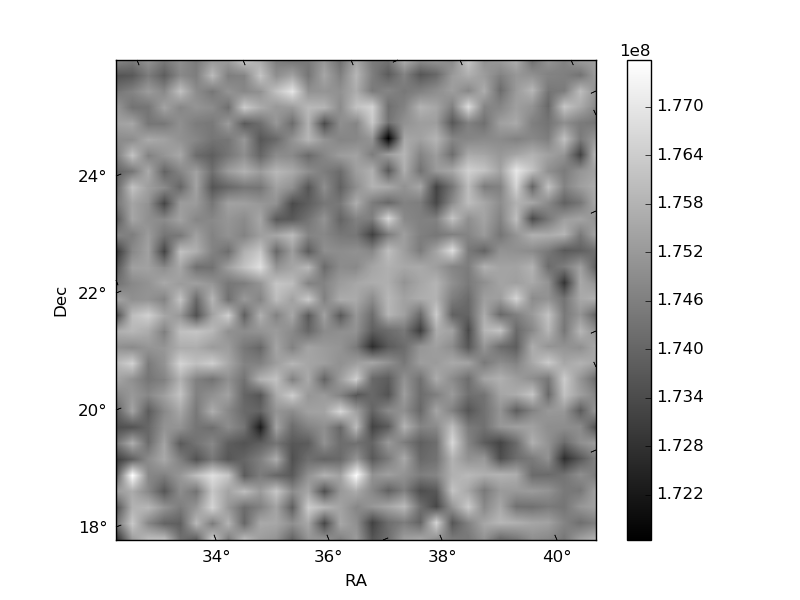
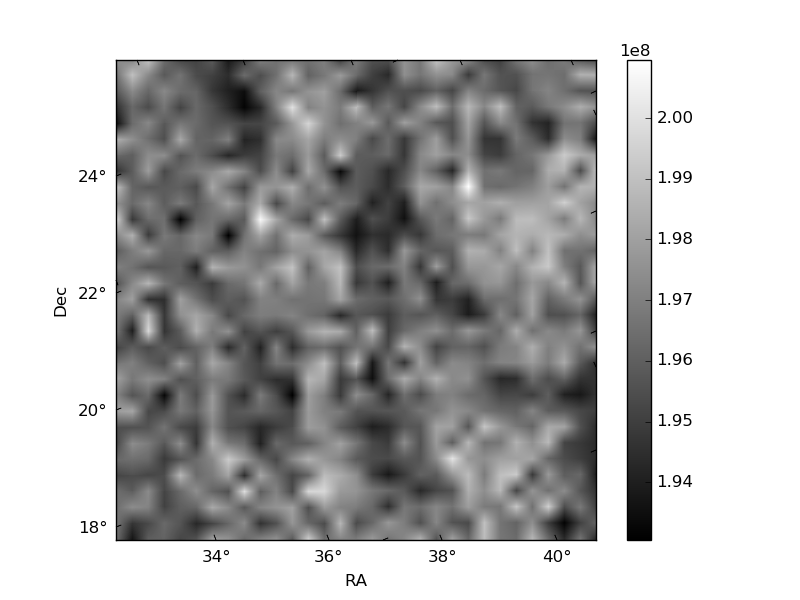
Histogram calculated using DETX and DETY for each event in the final _common_clean file
| Quadrant A | 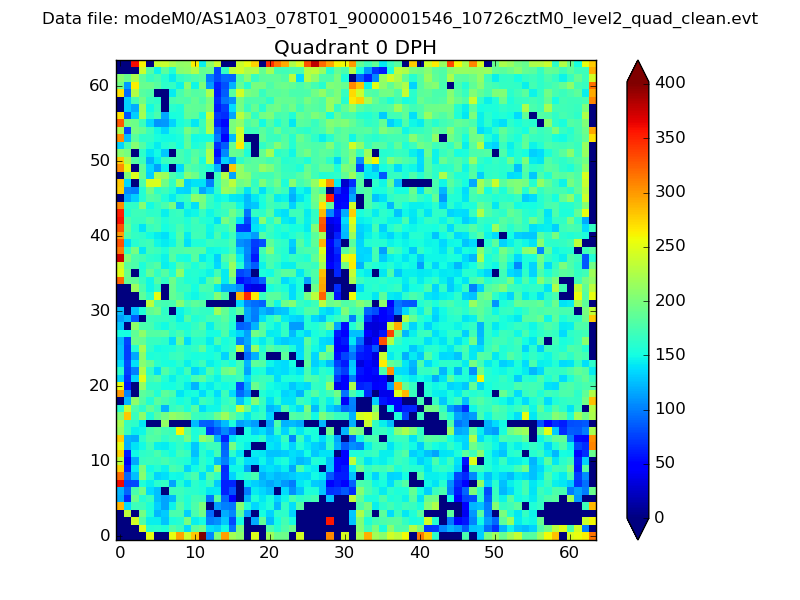 |
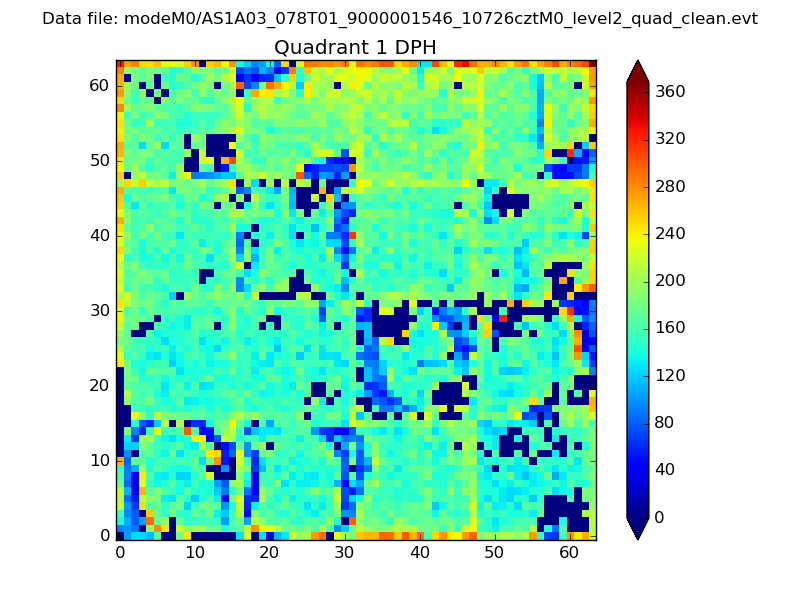 |
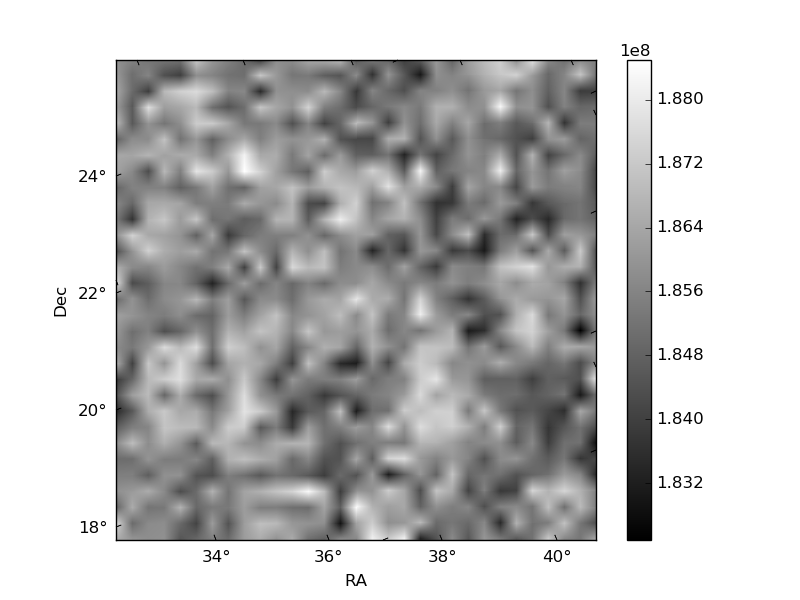
Quadrant B |
|---|---|---|---|
| Quadrant D | 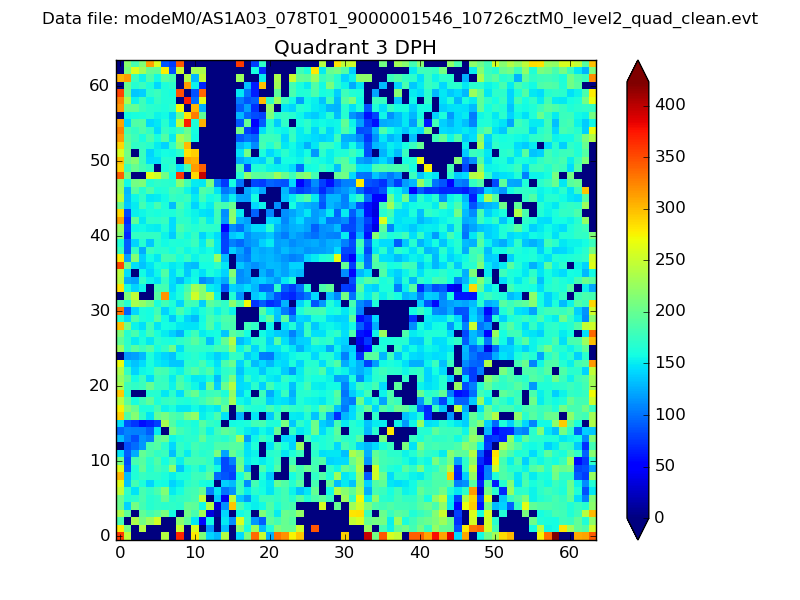 |
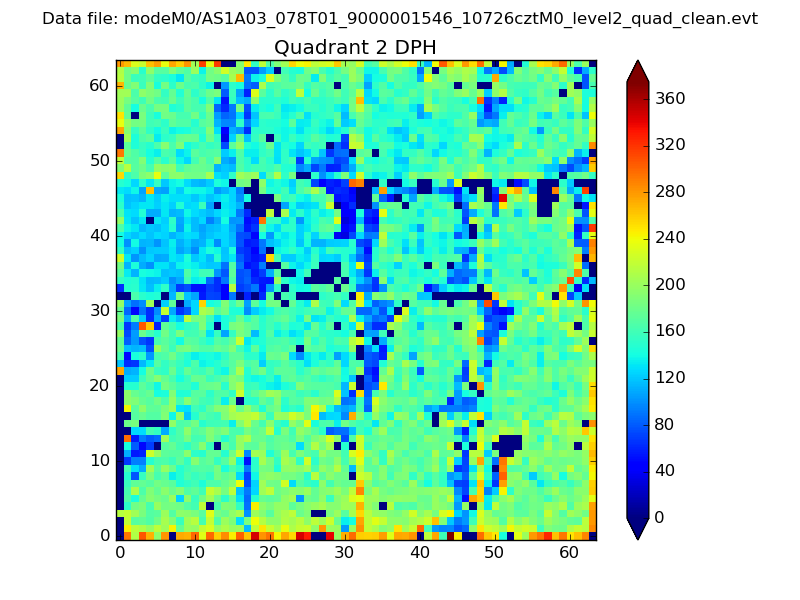 |
Quadrant C |
| Plot type | Count rate plots | Images |
|---|---|---|
| Comparison with Poisson distribution Blue bars denote a histogram of data divided into 1 sec bins. Red curve is a Poisson curve with rate = median count rate of data. |
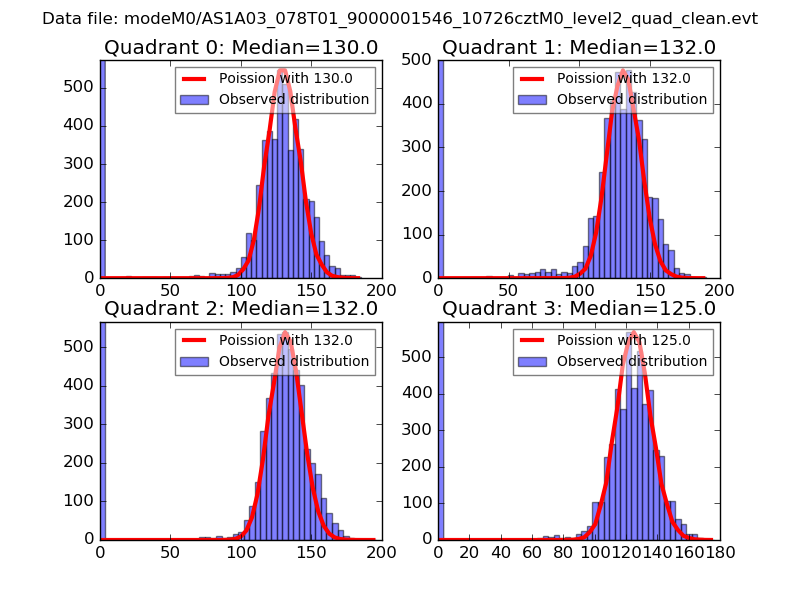 |
 |
| Quadrant-wise count rates Data is divided into 100 sec bins |
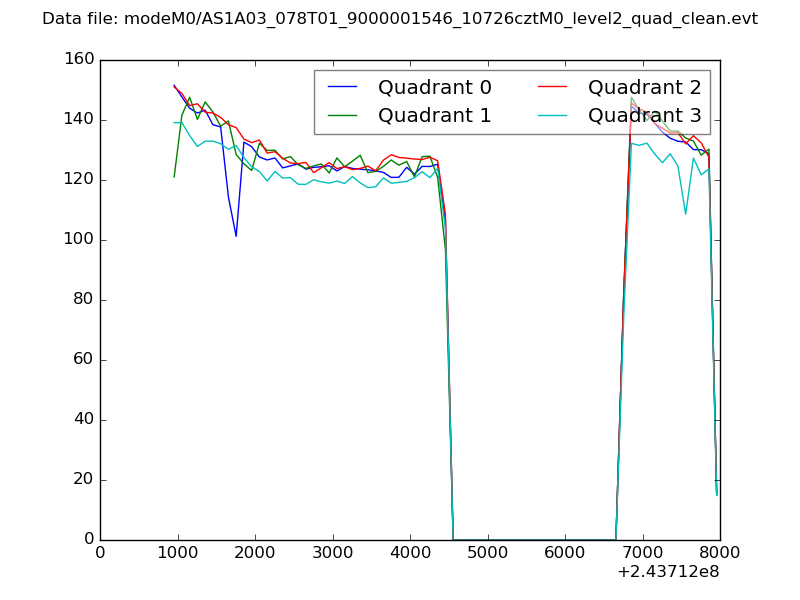 |
|
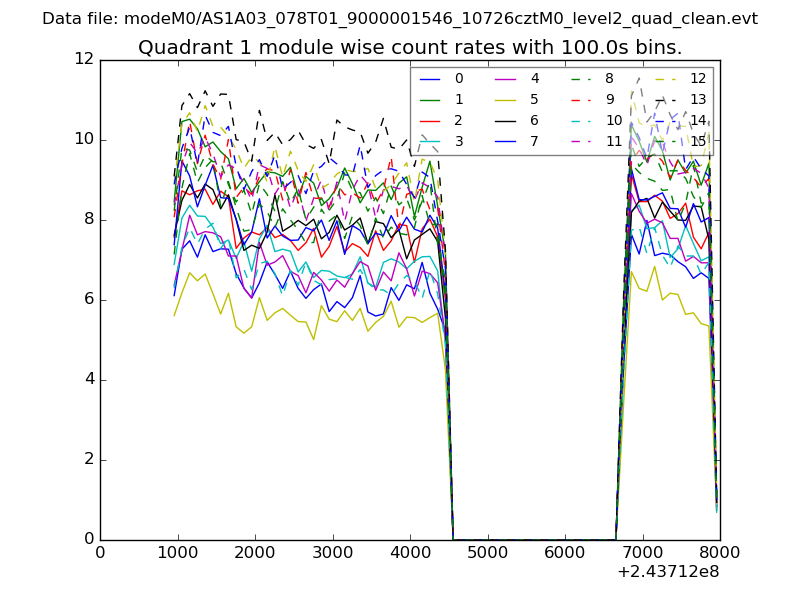
| Module-wise count rates for Quadrant A Data is divided into 100 sec bins |
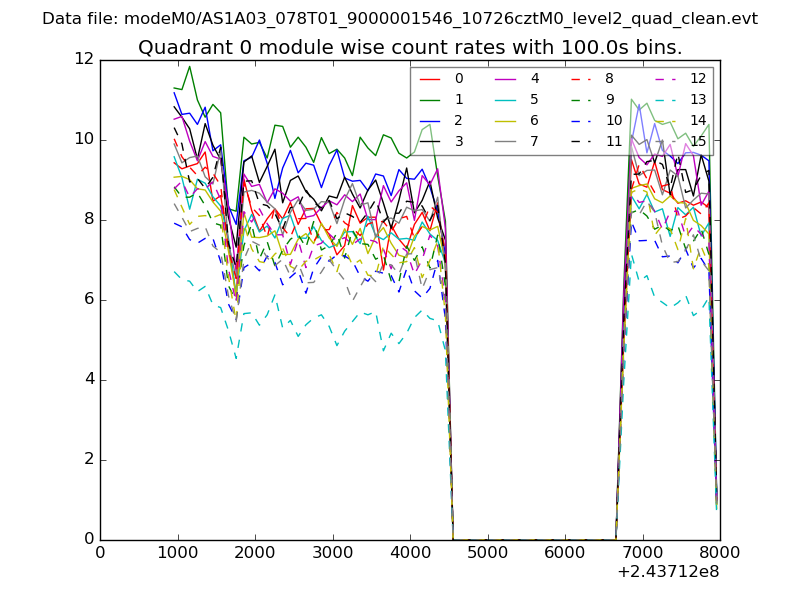 |
 |
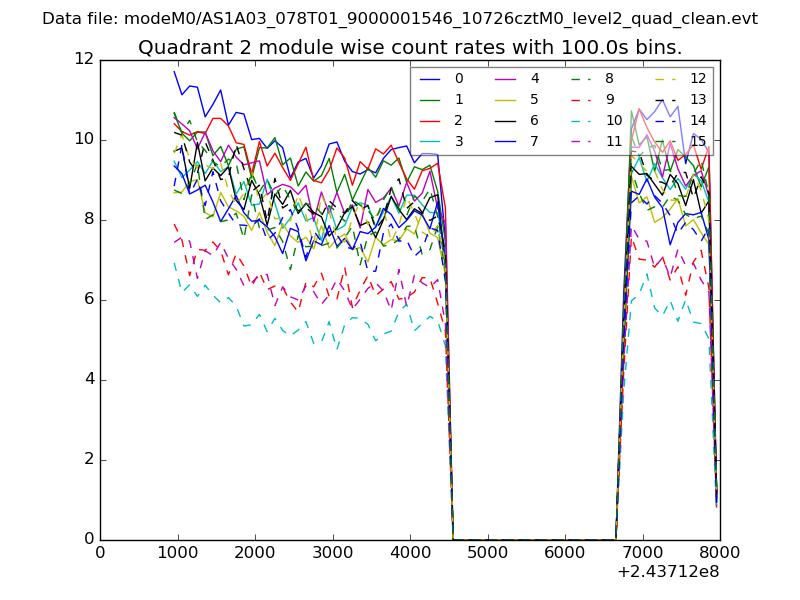
| Module-wise count rates for Quadrant B Data is divided into 100 sec bins |
 |
 |
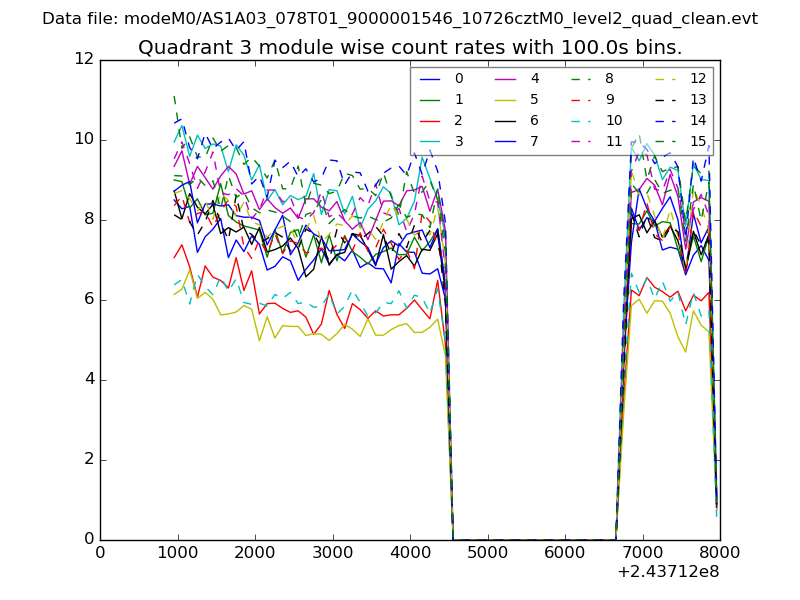
| Module-wise count rates for Quadrant C Data is divided into 100 sec bins |
 |
 |
| Module-wise count rates for Quadrant D Data is divided into 100 sec bins |
 |
 |
| Parameter | Plot |
|---|---|
| CZT HV Monitor | 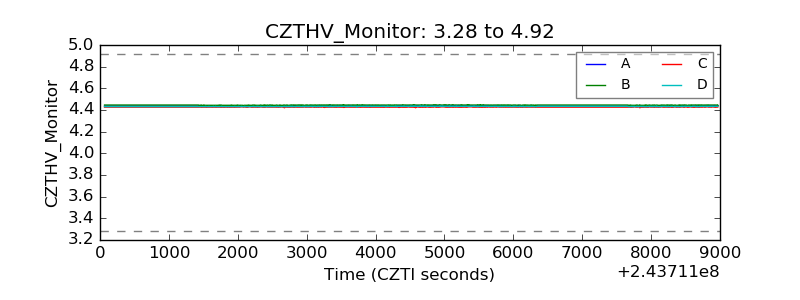 |
| D_VDD | 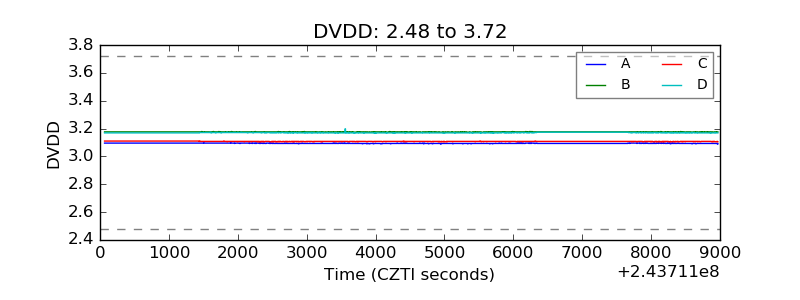 |
| Temperature 1 | 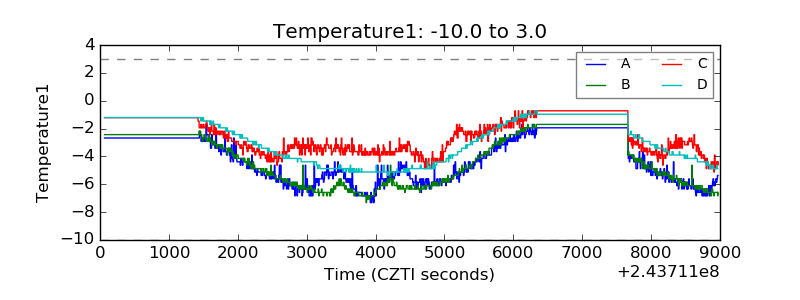 |
| Veto HV Monitor | 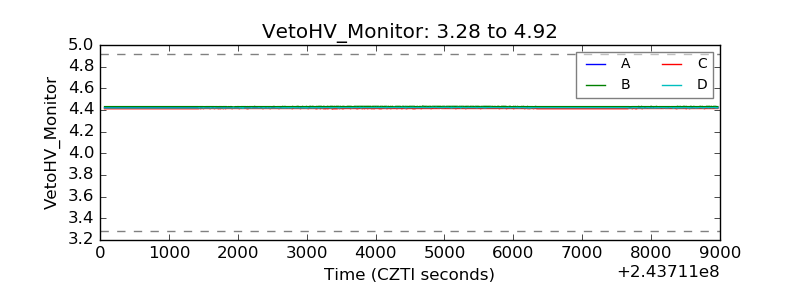 |
| Veto LLD | 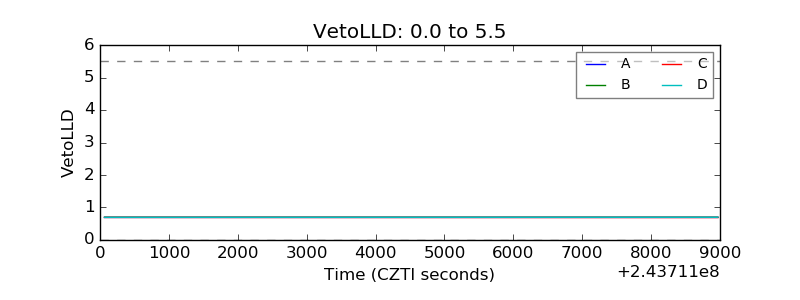 |
| Alpha Counter | 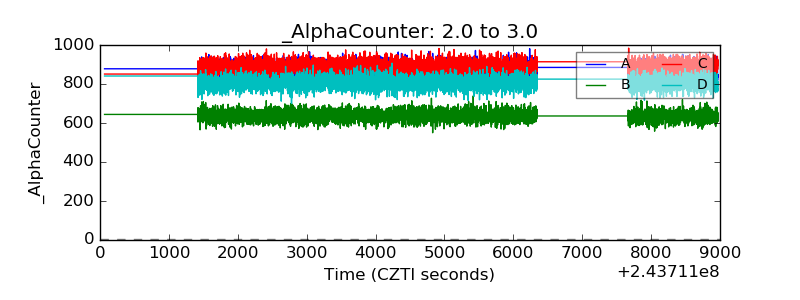 |
| _CPM_Rate | 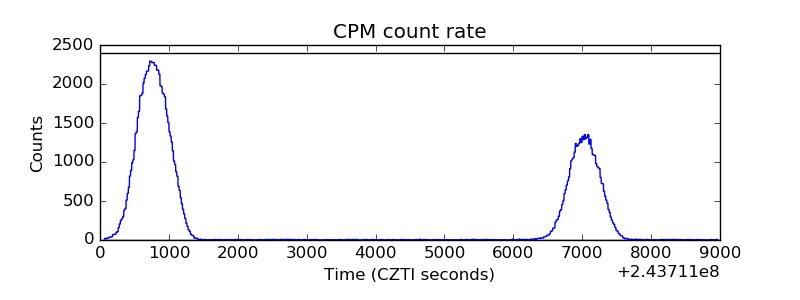 |
| CZT Counter | 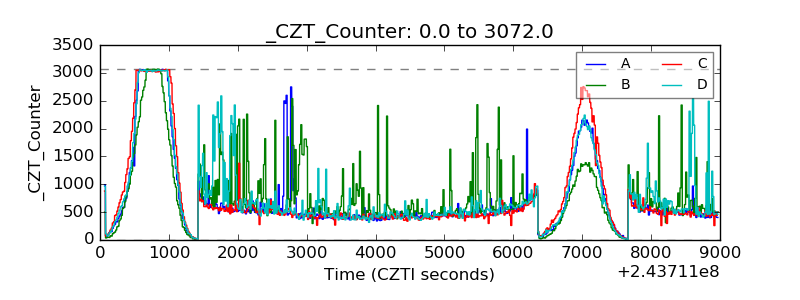 |
| +2.5 Volts monitor |  |
| +5 Volts monitor |  |
| _ROLL_ROT | 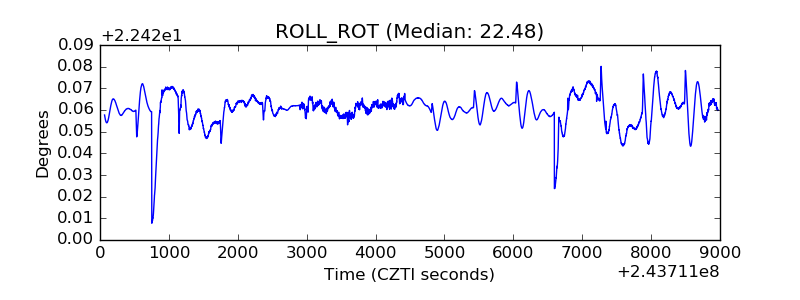 |
| _Roll_DEC | 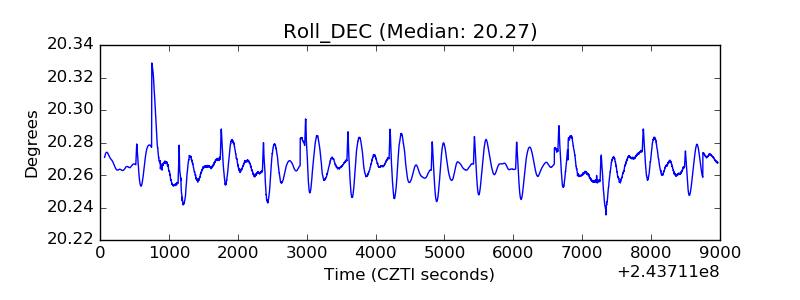 |
| _Roll_RA | 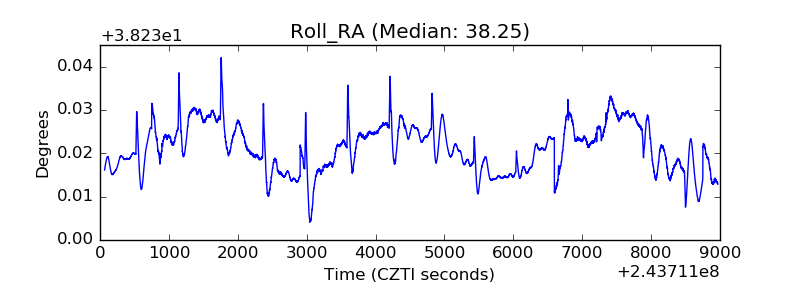 |
| Veto Counter | 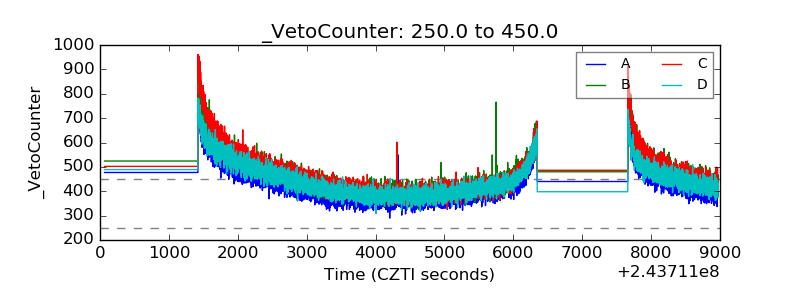 |