| Param | Original file | Final file |
|---|---|---|
| Filename | modeM0/AS1A03_078T01_9000001546_10727cztM0_level2.evt | modeM0/AS1A03_078T01_9000001546_10727cztM0_level2_quad_clean.evt |
| Size (bytes) | 524,064,960 | 98,064,000 |
| Size | 499.8 MB | 93.5 MB |
| Events in quadrant A | 3,357,648 | 623,420 |
| Events in quadrant B | 4,458,094 | 634,299 |
| Events in quadrant C | 3,299,749 | 635,059 |
| Events in quadrant D | 4,284,837 | 593,629 |
| Mode M0 | |||
|---|---|---|---|
| Quadrant | BADHDUFLAG | Total packets | Discarded packets |
| A | 0 | 14701 | 3 |
| B | 0 | 17983 | 2 |
| C | 0 | 14557 | 2 |
| D | 0 | 17419 | 2 |
| Mode SS | |||
|---|---|---|---|
| Quadrant | BADHDUFLAG | Total packets | Discarded packets |
| A | 0 | 144 | 0 |
| B | 0 | 144 | 0 |
| C | 0 | 144 | 0 |
| D | 0 | 144 | 0 |
| Mode M9 | |||
|---|---|---|---|
| Quadrant | BADHDUFLAG | Total packets | Discarded packets |
| A | 0 | 24 | 0 |
| B | 0 | 24 | 0 |
| C | 0 | 24 | 0 |
| D | 0 | 24 | 0 |
| Quadrant | Total seconds | Saturated seconds | Saturation percentage |
|---|---|---|---|
| A | 6942 | 85 | 1.224431% |
| B | 6942 | 328 | 4.724863% |
| C | 6942 | 74 | 1.065975% |
| D | 6942 | 162 | 2.333621% |
Noise dominated data is calculated using 1-second bins in cleaned event files. If a bin has >2000 counts, and if more than 50% of those come from <1% of pixels, then it is considered to be noise-dominated and hence unusable.
| Quadrant | # 1 sec bins | Bins with >0 counts | Bins with >2000 counts | High rate bins dominated by noise | Noise dominated (total time) | Noise dominated (detector-on time) | Marked lightcurve |
|---|---|---|---|---|---|---|---|
| A | 9342 | 6945 | 5 | 5 | 0.05% | 0.07% | 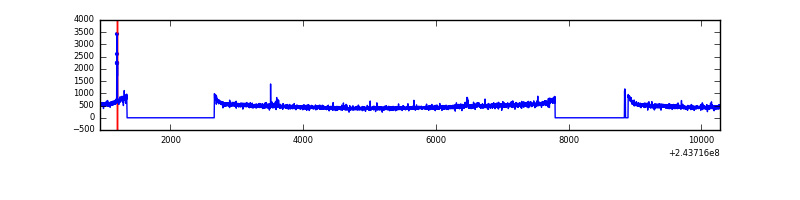 |
| B | 9342 | 6944 | 115 | 115 | 1.23% | 1.66% | 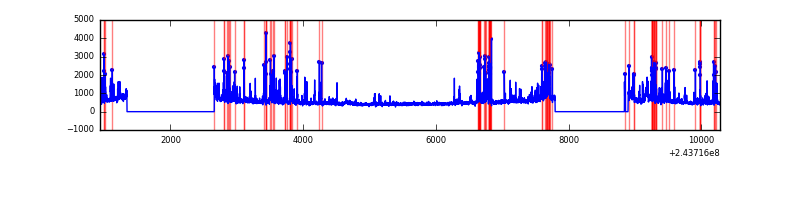 |
| C | 9342 | 6945 | 1 | 1 | 0.01% | 0.01% | 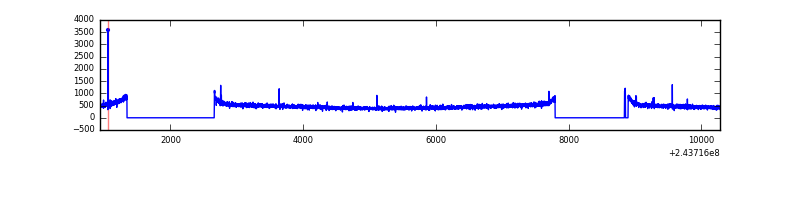 |
| D | 9342 | 6945 | 89 | 89 | 0.95% | 1.28% | 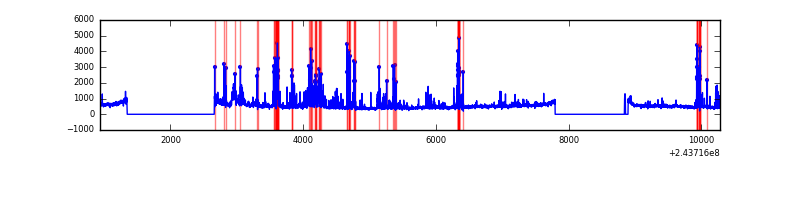 |
Top three noisy pixels from each quadrant. If the there are fewer than three noisy pixels in the level2.evt file, extra rows are filled as -1
| Pixel properties | Quadrant properties | ||||||
|---|---|---|---|---|---|---|---|
| Quadrant | DetID | PixID | Counts | Sigma | Mean | Median | Sigma |
| A | 15 | 174 | 26366 | 147.47 | 852 | 833 | 173.1 |
| A | 4 | 2 | 17319 | 95.22 | 852 | 833 | 173.1 |
| A | 1 | 162 | 10136 | 53.73 | 852 | 833 | 173.1 |
| B | 4 | 239 | 886963 | 5406.7 | 855 | 835 | 163.9 |
| B | 4 | 81 | 63350 | 381.43 | 855 | 835 | 163.9 |
| B | 0 | 219 | 57006 | 342.73 | 855 | 835 | 163.9 |
| C | 14 | 234 | 13029 | 62.36 | 841 | 844 | 195.4 |
| C | 13 | 61 | 6242 | 27.63 | 841 | 844 | 195.4 |
| C | 3 | 254 | 2881 | 10.43 | 841 | 844 | 195.4 |
| D | 13 | 249 | 323810 | 1615.47 | 826 | 803 | 199.9 |
| D | 14 | 34 | 323808 | 1615.46 | 826 | 803 | 199.9 |
| D | 8 | 195 | 198208 | 987.29 | 826 | 803 | 199.9 |
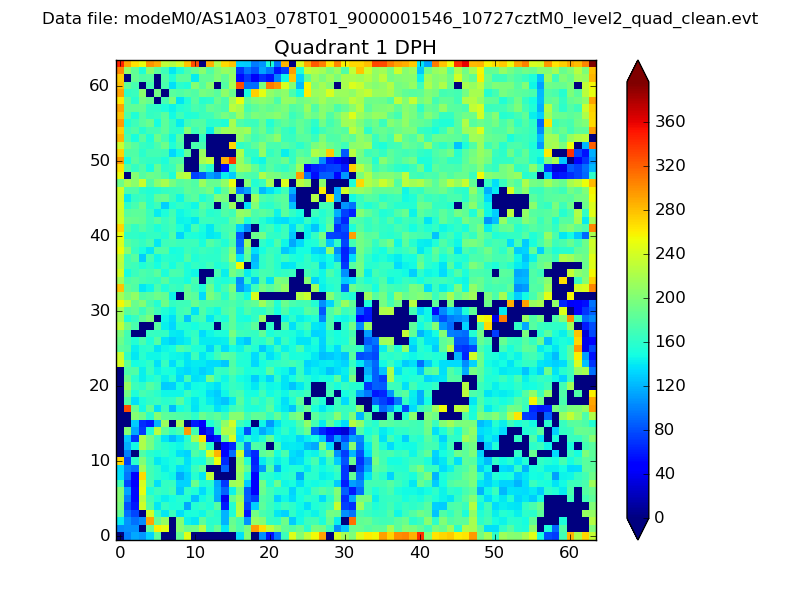
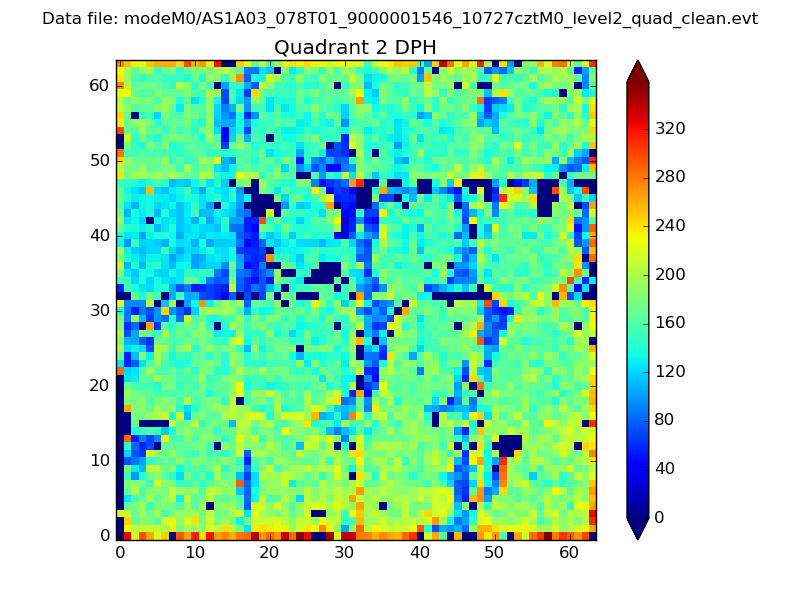
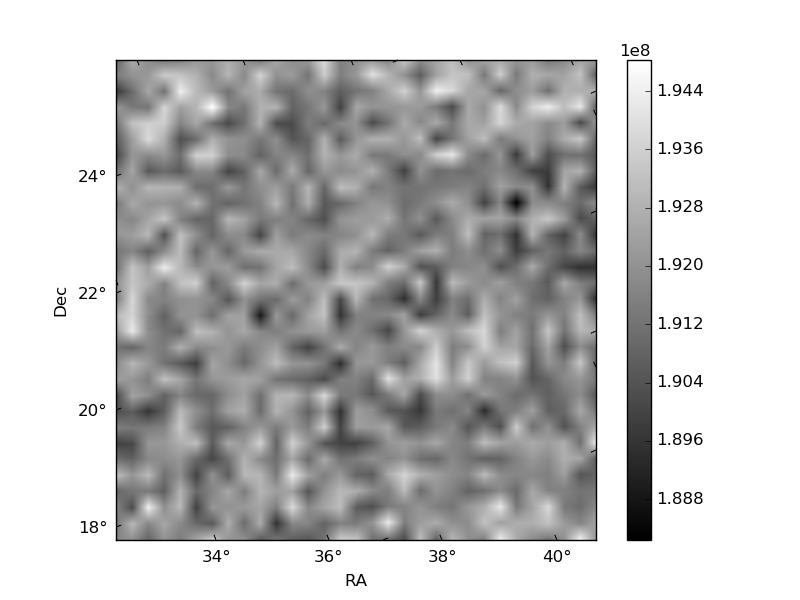
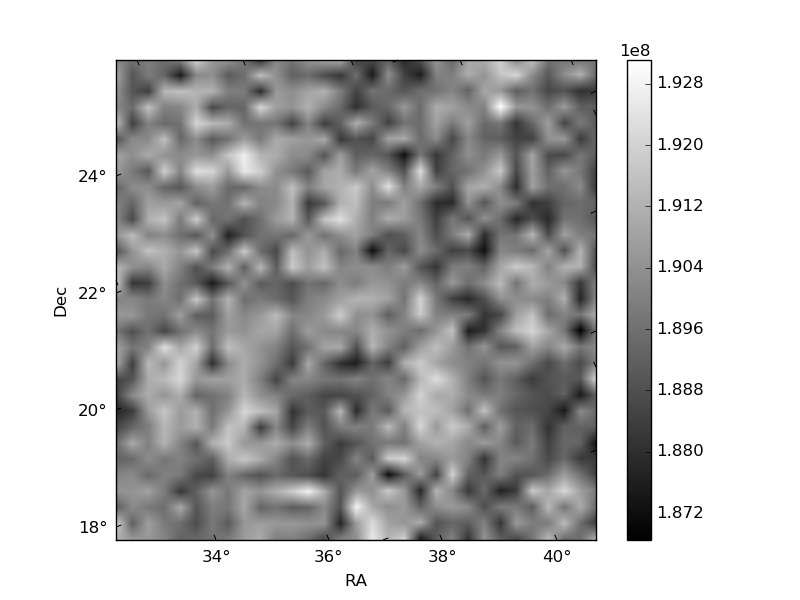
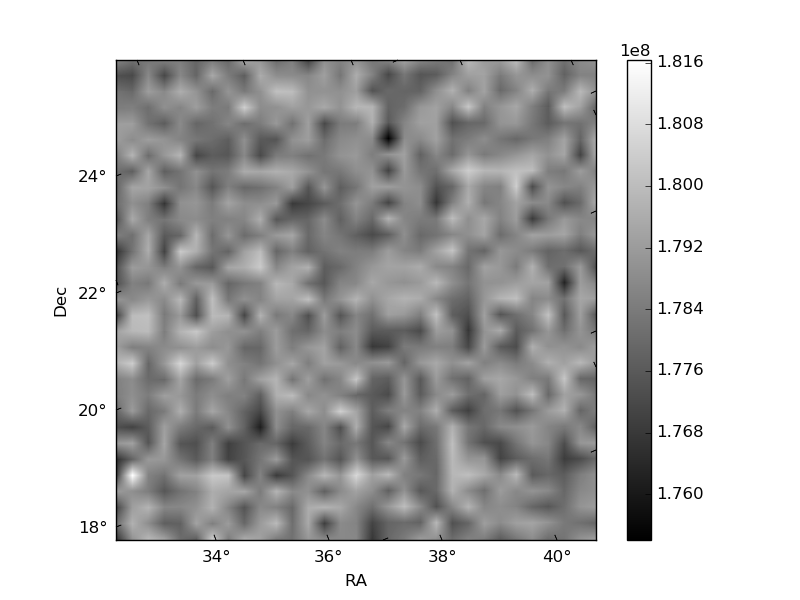
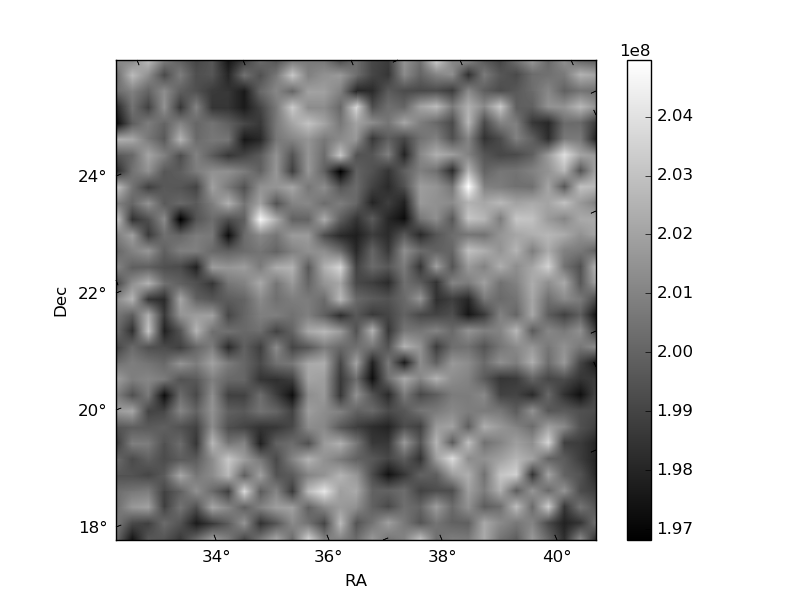
Histogram calculated using DETX and DETY for each event in the final _common_clean file
| Quadrant A |  |
 |
Quadrant B |
|---|---|---|---|
| Quadrant D |  |
 |
Quadrant C |
| Plot type | Count rate plots | Images |
|---|---|---|
| Comparison with Poisson distribution Blue bars denote a histogram of data divided into 1 sec bins. Red curve is a Poisson curve with rate = median count rate of data. |
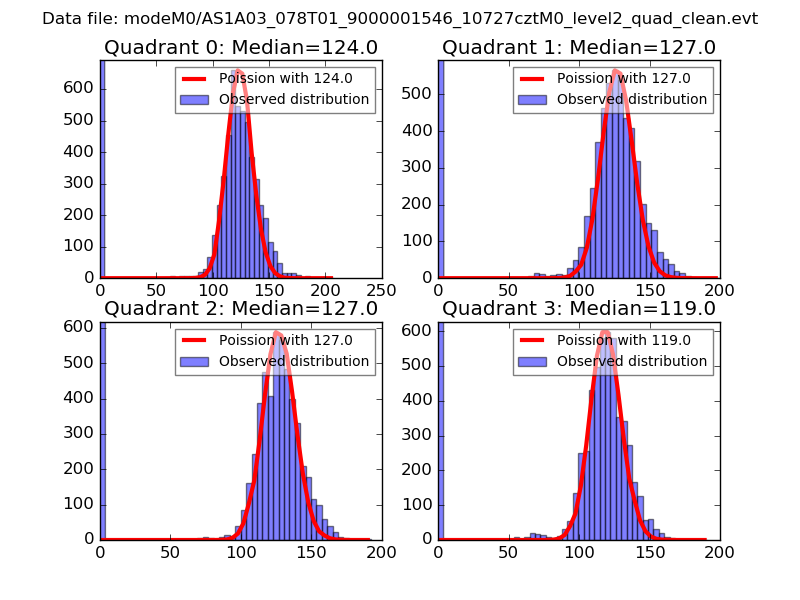 |
 |
| Quadrant-wise count rates Data is divided into 100 sec bins |
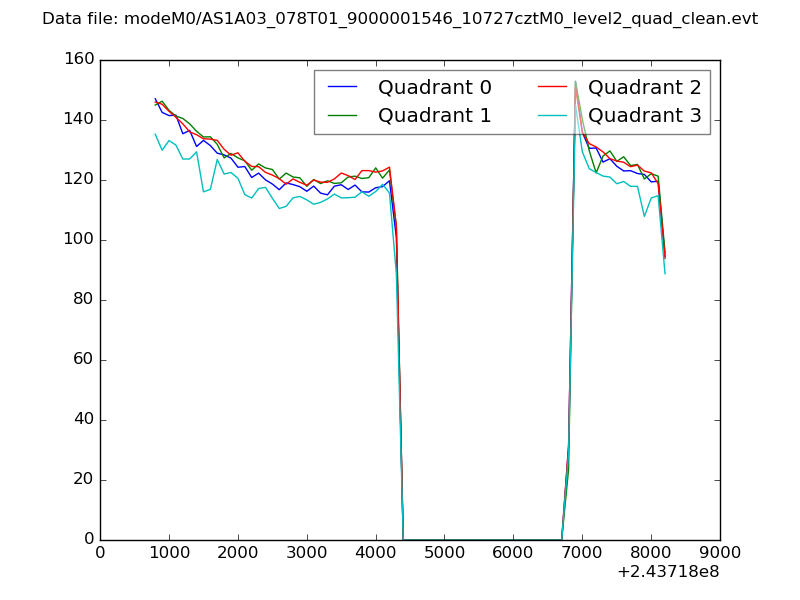 |
|
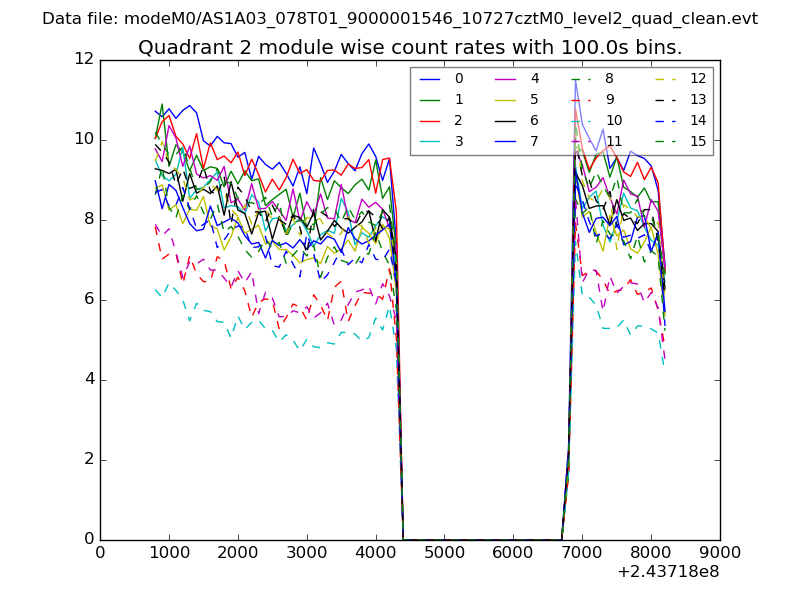
| Module-wise count rates for Quadrant A Data is divided into 100 sec bins |
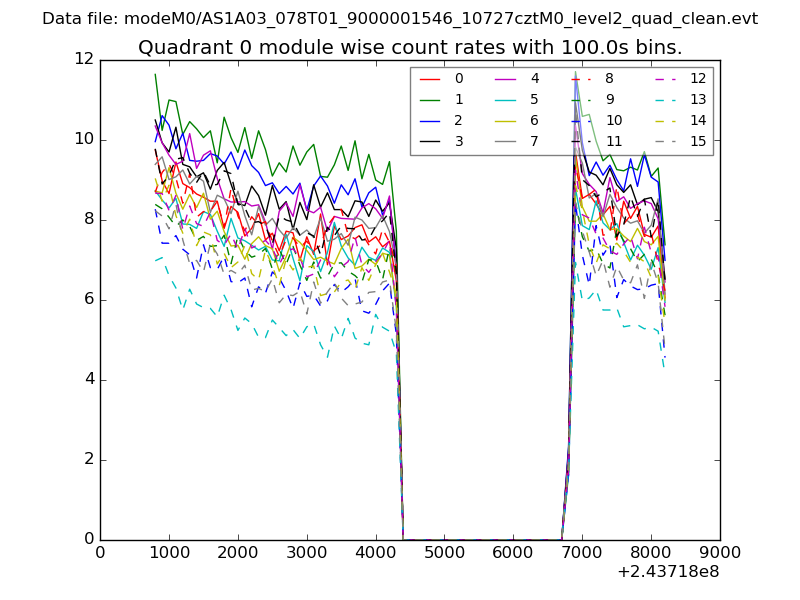 |
 |
| Module-wise count rates for Quadrant B Data is divided into 100 sec bins |
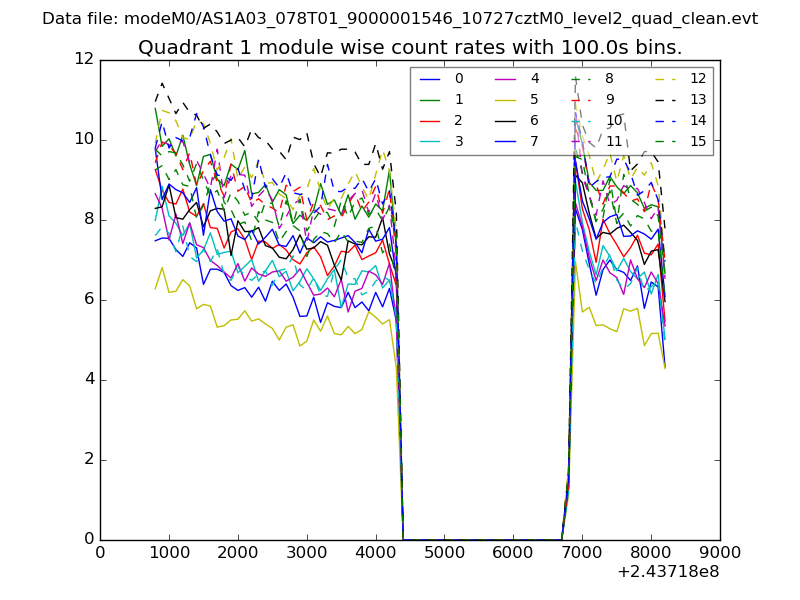 |
 |
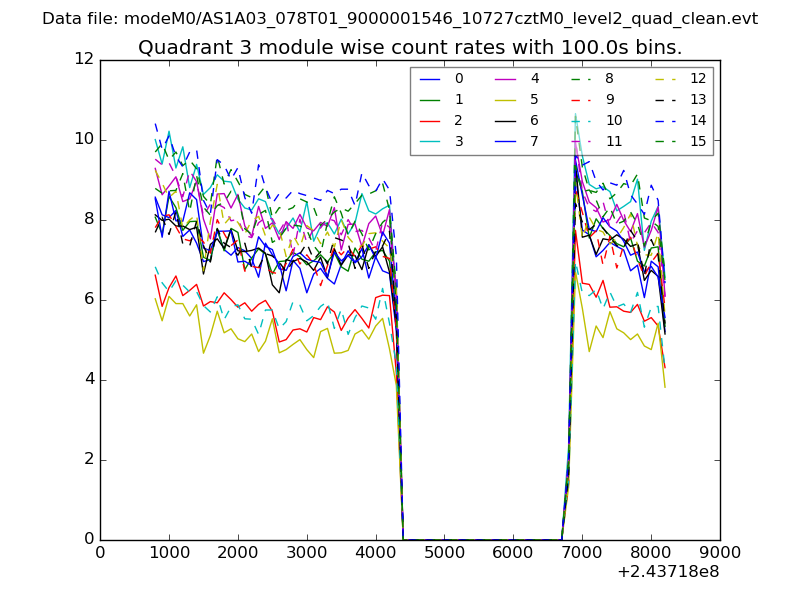
| Module-wise count rates for Quadrant C Data is divided into 100 sec bins |
 |
 |
| Module-wise count rates for Quadrant D Data is divided into 100 sec bins |
 |
 |
| Parameter | Plot |
|---|---|
| CZT HV Monitor | 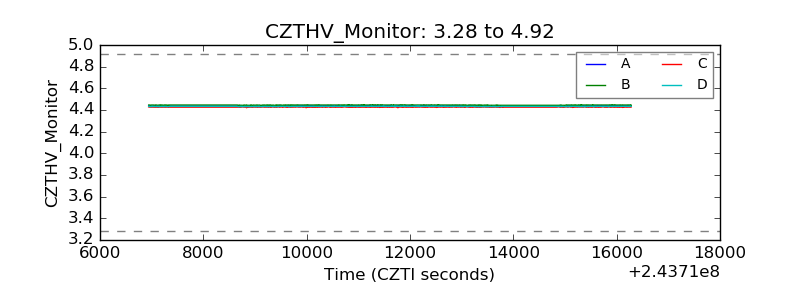 |
| D_VDD | 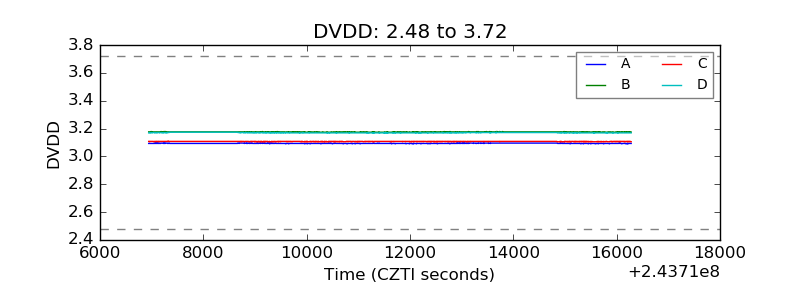 |
| Temperature 1 | 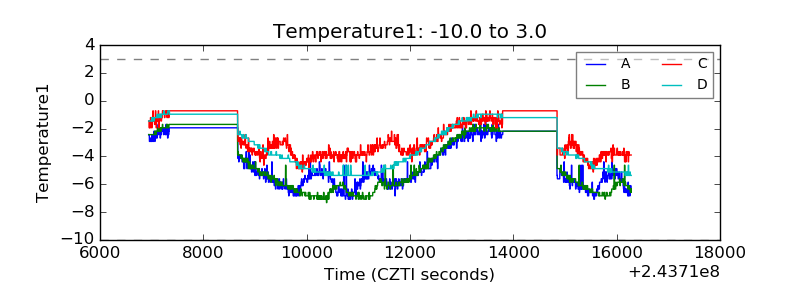 |
| Veto HV Monitor |  |
| Veto LLD | 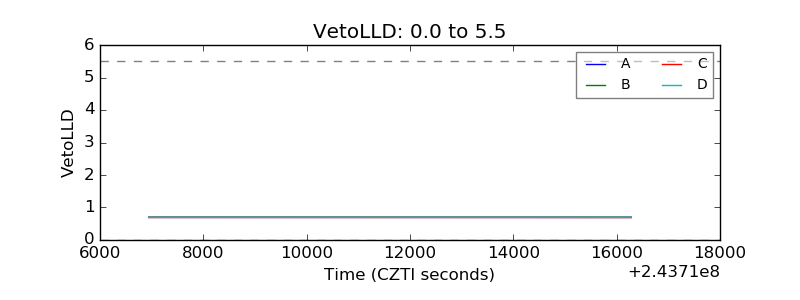 |
| Alpha Counter | 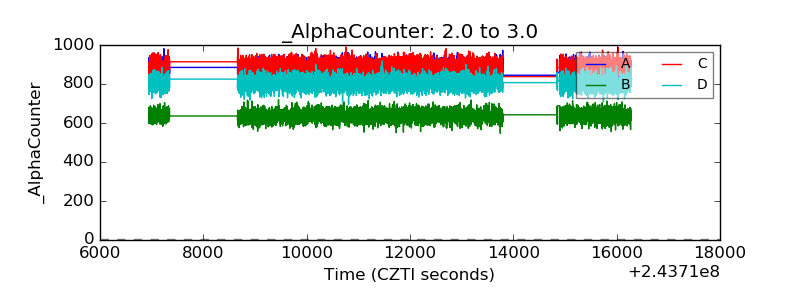 |
| _CPM_Rate |  |
| CZT Counter | 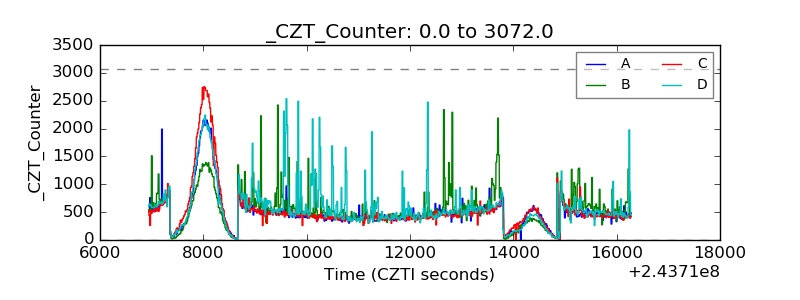 |
| +2.5 Volts monitor | 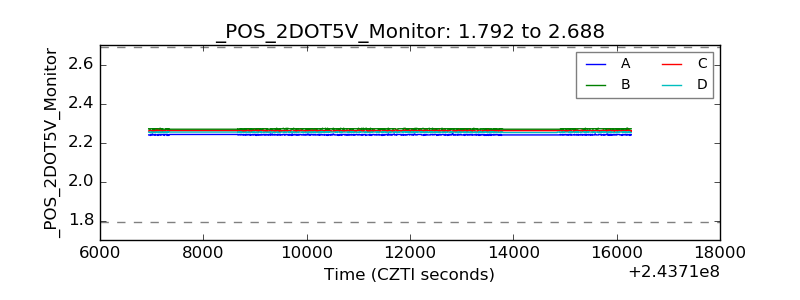 |
| +5 Volts monitor | 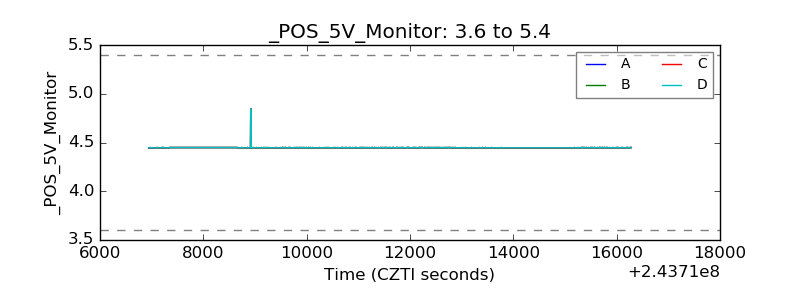 |
| _ROLL_ROT | 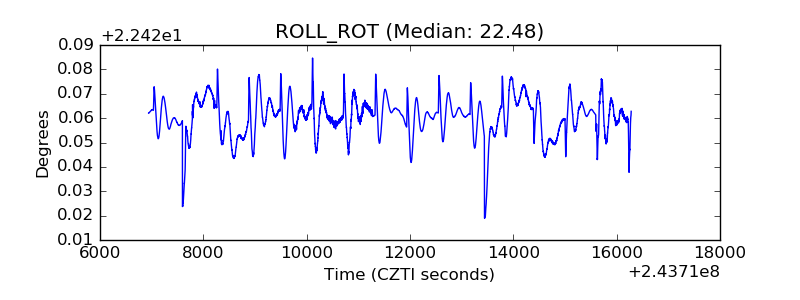 |
| _Roll_DEC |  |
| _Roll_RA | 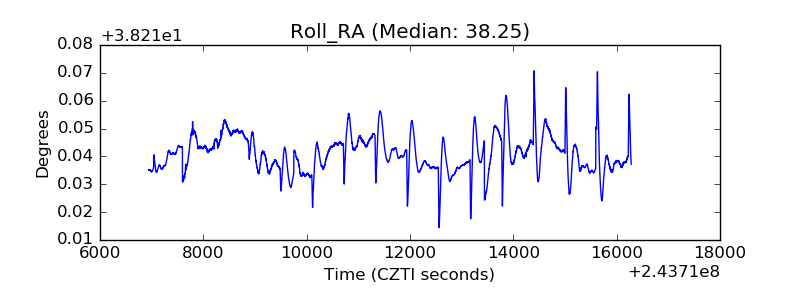 |
| Veto Counter | 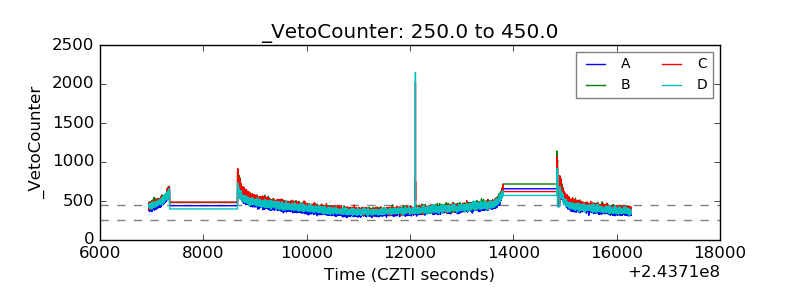 |