| Param | Original file | Final file |
|---|---|---|
| Filename | modeM0/AS1A03_078T01_9000001546_10728cztM0_level2.evt | modeM0/AS1A03_078T01_9000001546_10728cztM0_level2_quad_clean.evt |
| Size (bytes) | 565,603,200 | 92,304,000 |
| Size | 539.4 MB | 88.0 MB |
| Events in quadrant A | 3,791,530 | 566,222 |
| Events in quadrant B | 4,950,651 | 571,822 |
| Events in quadrant C | 3,669,675 | 575,257 |
| Events in quadrant D | 4,191,775 | 543,056 |
| Mode M0 | |||
|---|---|---|---|
| Quadrant | BADHDUFLAG | Total packets | Discarded packets |
| A | 0 | 16480 | 3 |
| B | 0 | 20065 | 2 |
| C | 0 | 16297 | 2 |
| D | 0 | 17619 | 2 |
| Mode SS | |||
|---|---|---|---|
| Quadrant | BADHDUFLAG | Total packets | Discarded packets |
| A | 0 | 160 | 0 |
| B | 0 | 160 | 0 |
| C | 0 | 160 | 0 |
| D | 0 | 160 | 0 |
| Mode M9 | |||
|---|---|---|---|
| Quadrant | BADHDUFLAG | Total packets | Discarded packets |
| A | 0 | 18 | 0 |
| B | 0 | 18 | 0 |
| C | 0 | 18 | 0 |
| D | 0 | 18 | 0 |
| Quadrant | Total seconds | Saturated seconds | Saturation percentage |
|---|---|---|---|
| A | 7751 | 104 | 1.341762% |
| B | 7751 | 480 | 6.192749% |
| C | 7751 | 84 | 1.083731% |
| D | 7751 | 92 | 1.186944% |
Noise dominated data is calculated using 1-second bins in cleaned event files. If a bin has >2000 counts, and if more than 50% of those come from <1% of pixels, then it is considered to be noise-dominated and hence unusable.
| Quadrant | # 1 sec bins | Bins with >0 counts | Bins with >2000 counts | High rate bins dominated by noise | Noise dominated (total time) | Noise dominated (detector-on time) | Marked lightcurve |
|---|---|---|---|---|---|---|---|
| A | 9521 | 7754 | 4 | 4 | 0.04% | 0.05% | 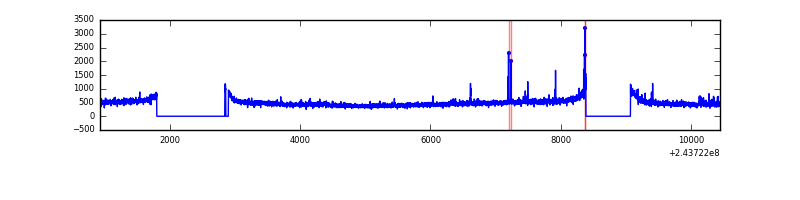 |
| B | 9521 | 7753 | 147 | 147 | 1.54% | 1.90% | 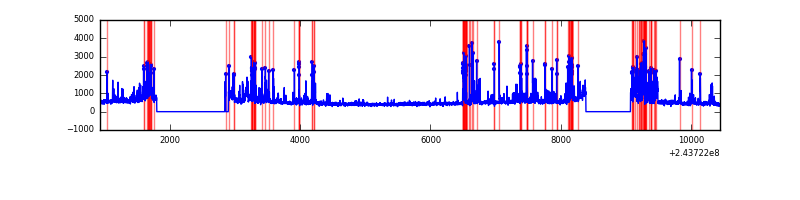 |
| C | 9521 | 7754 | 7 | 7 | 0.07% | 0.09% | 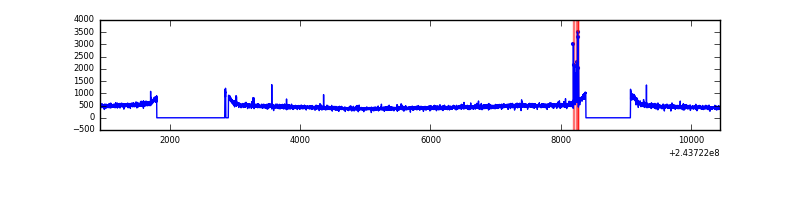 |
| D | 9521 | 7754 | 41 | 41 | 0.43% | 0.53% | 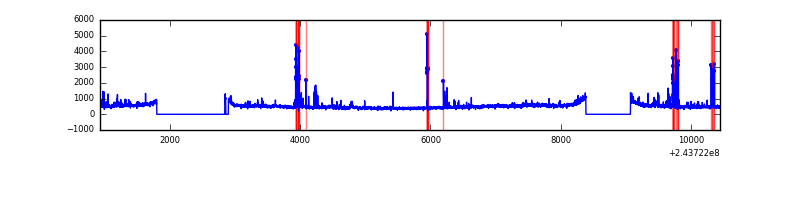 |
Top three noisy pixels from each quadrant. If the there are fewer than three noisy pixels in the level2.evt file, extra rows are filled as -1
| Pixel properties | Quadrant properties | ||||||
|---|---|---|---|---|---|---|---|
| Quadrant | DetID | PixID | Counts | Sigma | Mean | Median | Sigma |
| A | 13 | 251 | 47944 | 243.04 | 945 | 925 | 193.5 |
| A | 14 | 254 | 23728 | 117.87 | 945 | 925 | 193.5 |
| A | 15 | 239 | 18536 | 91.03 | 945 | 925 | 193.5 |
| B | 4 | 239 | 1098339 | 6076.47 | 940 | 917 | 180.6 |
| B | 0 | 219 | 45199 | 245.19 | 940 | 917 | 180.6 |
| B | 0 | 214 | 34817 | 187.7 | 940 | 917 | 180.6 |
| C | 14 | 234 | 50134 | 225.77 | 928 | 929 | 217.9 |
| C | 13 | 61 | 6861 | 27.22 | 928 | 929 | 217.9 |
| C | 3 | 254 | 2964 | 9.34 | 928 | 929 | 217.9 |
| D | 8 | 195 | 366774 | 1663.61 | 912 | 887 | 219.9 |
| D | 13 | 249 | 184760 | 836.03 | 912 | 887 | 219.9 |
| D | 12 | 233 | 81504 | 366.55 | 912 | 887 | 219.9 |
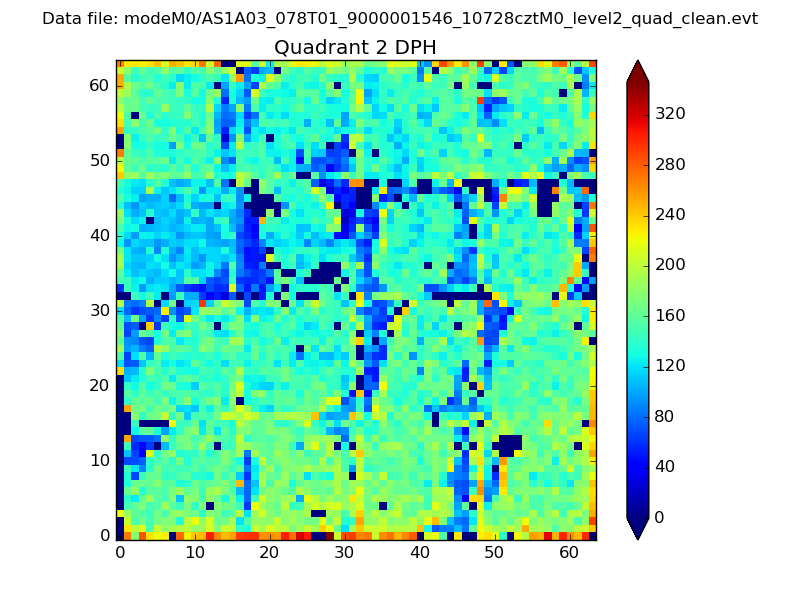
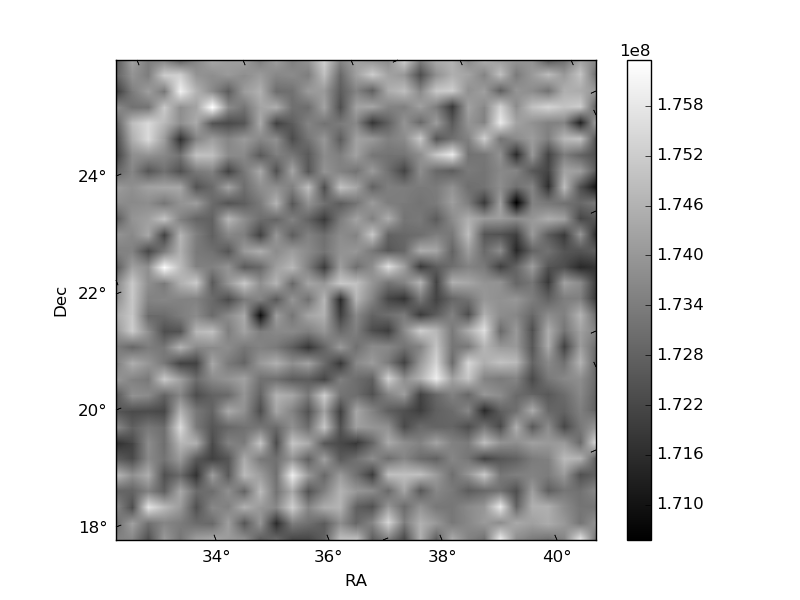
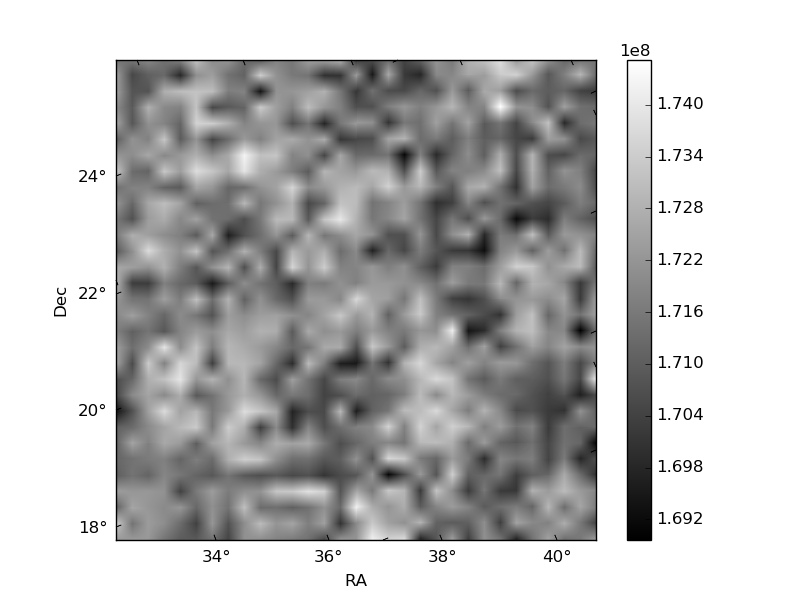
Histogram calculated using DETX and DETY for each event in the final _common_clean file
| Quadrant A | 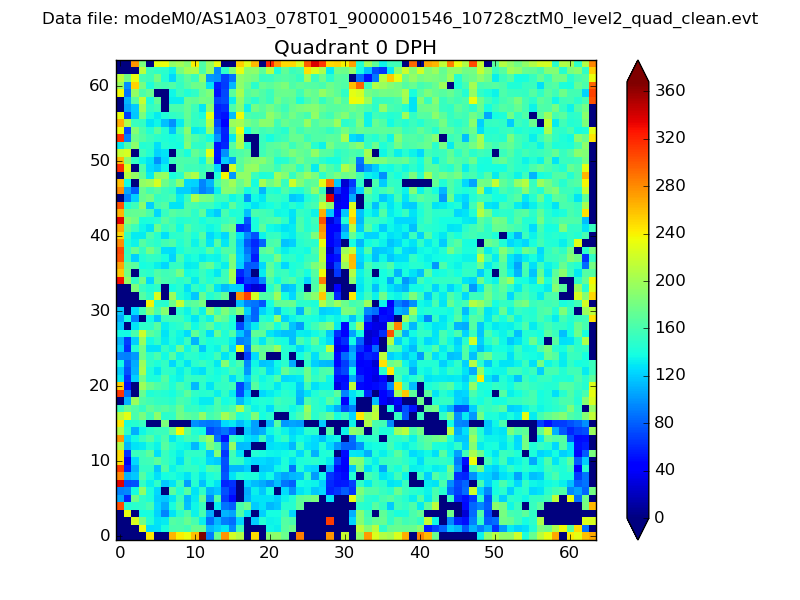 |
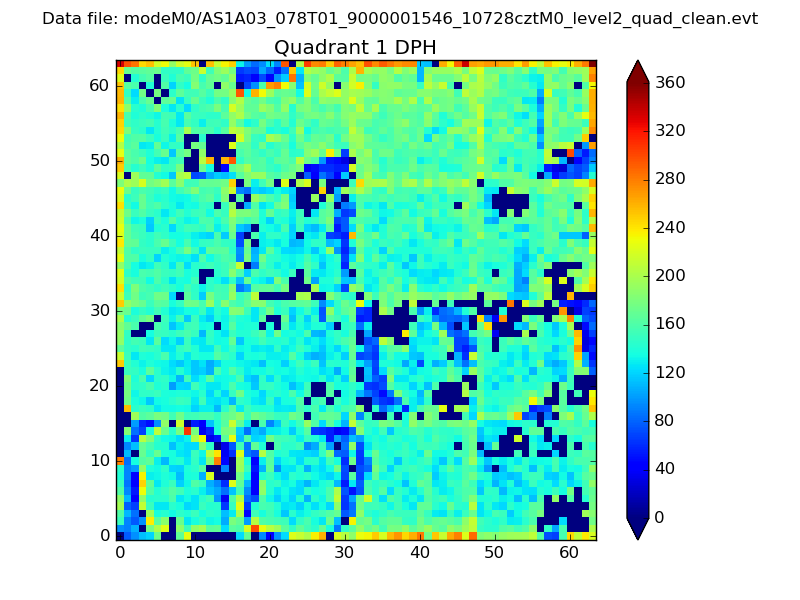 |
Quadrant B |
|---|---|---|---|
| Quadrant D | 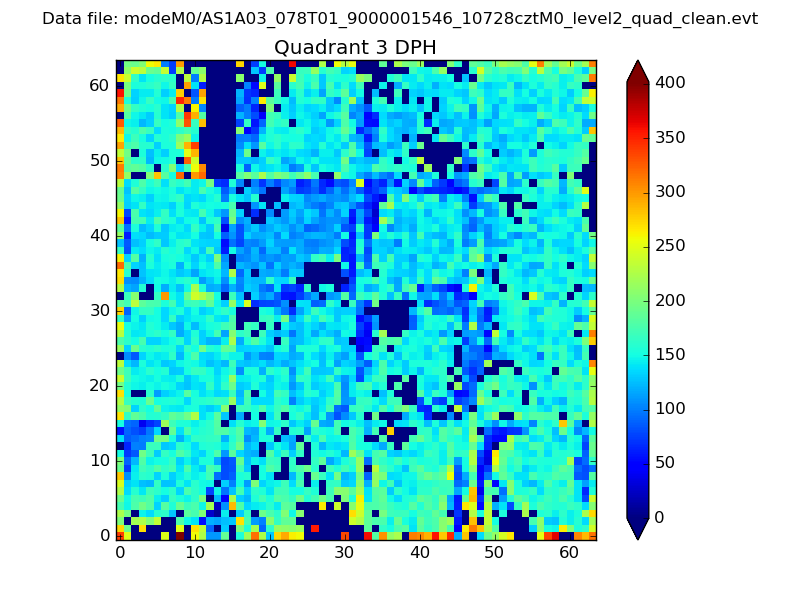 |
 |
Quadrant C |
| Plot type | Count rate plots | Images |
|---|---|---|
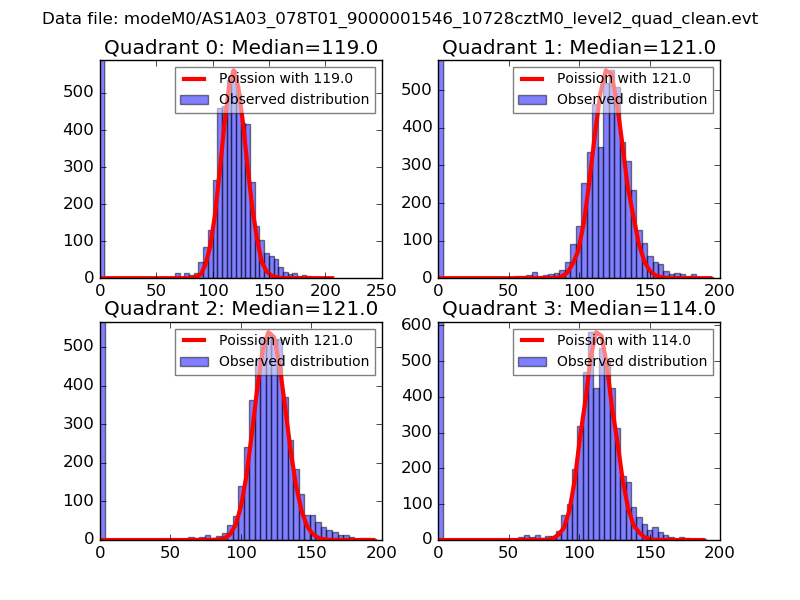
| Comparison with Poisson distribution Blue bars denote a histogram of data divided into 1 sec bins. Red curve is a Poisson curve with rate = median count rate of data. |
 |
 |
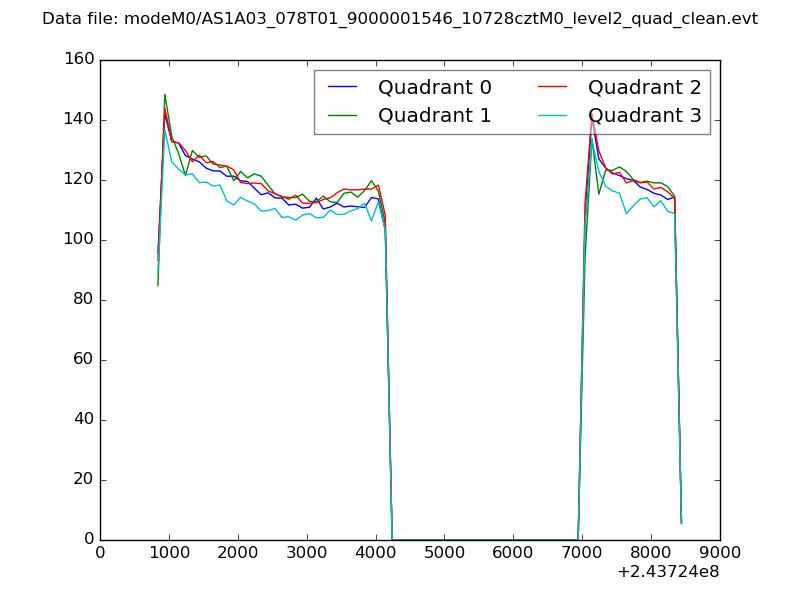
| Quadrant-wise count rates Data is divided into 100 sec bins |
 |
|
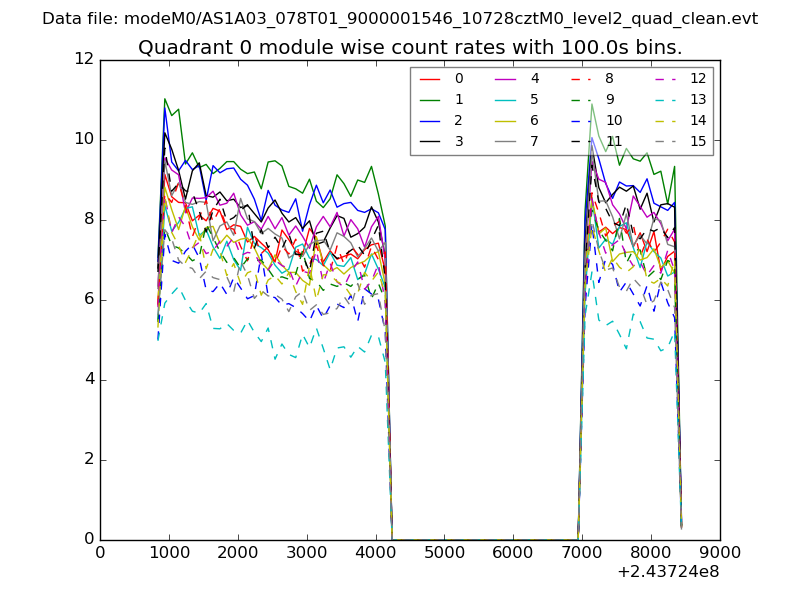
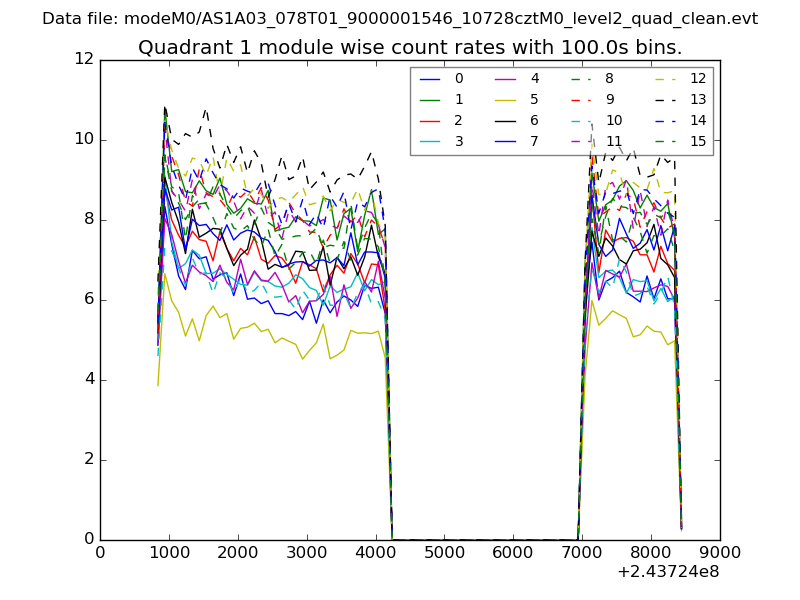
| Module-wise count rates for Quadrant A Data is divided into 100 sec bins |
 |
 |
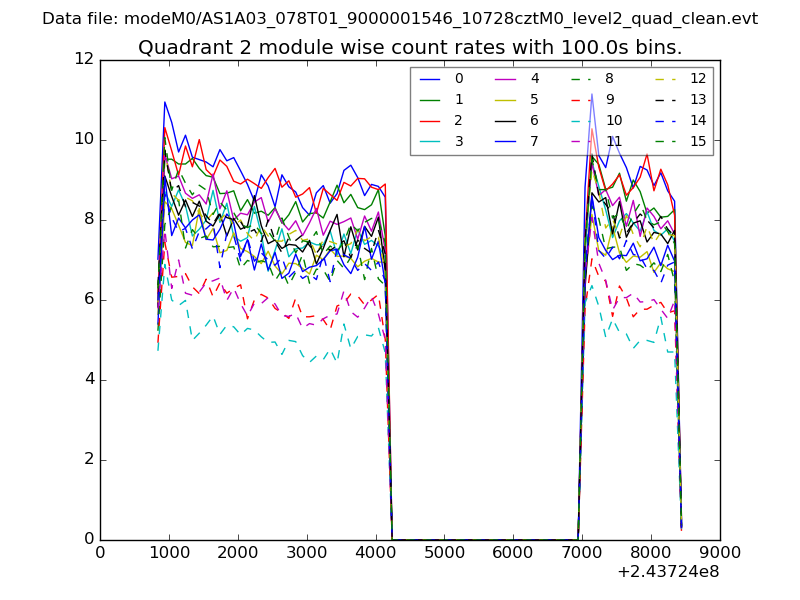
| Module-wise count rates for Quadrant B Data is divided into 100 sec bins |
 |
 |
| Module-wise count rates for Quadrant C Data is divided into 100 sec bins |
 |
 |
| Module-wise count rates for Quadrant D Data is divided into 100 sec bins |
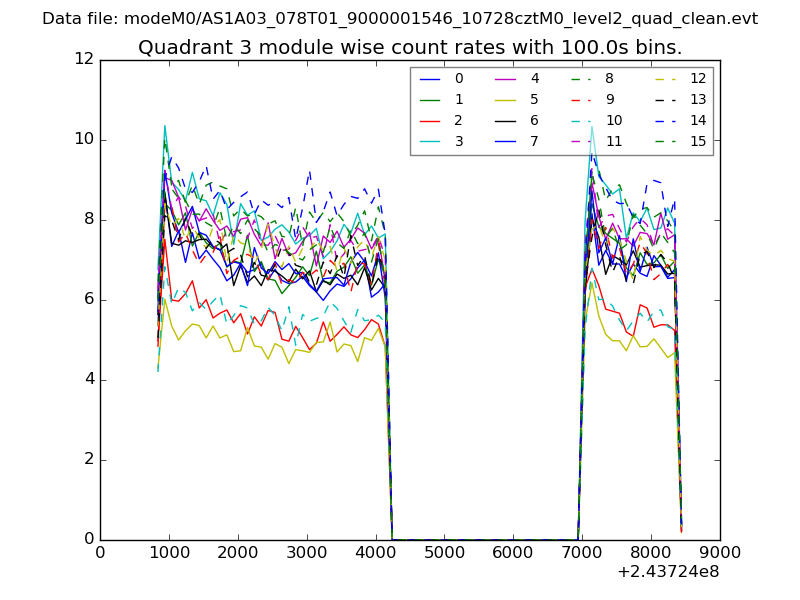 |
 |
| Parameter | Plot |
|---|---|
| CZT HV Monitor | 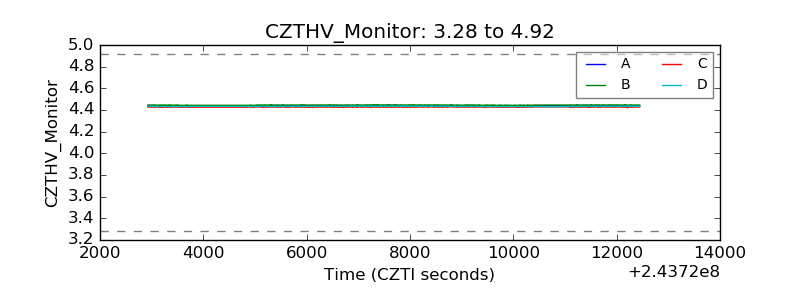 |
| D_VDD | 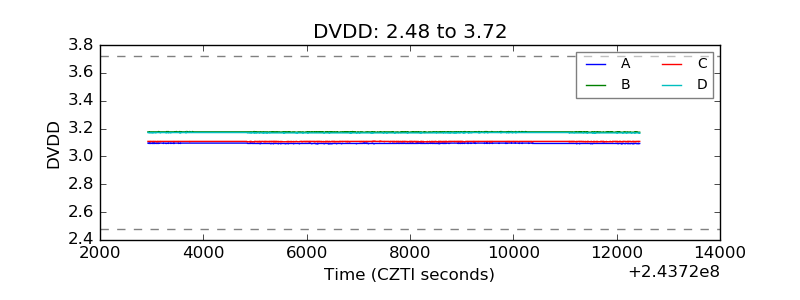 |
| Temperature 1 | 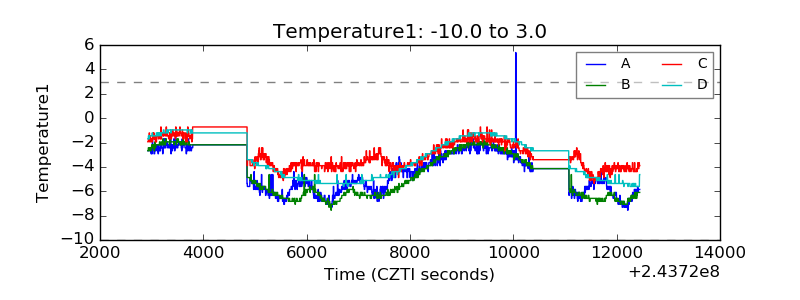 |
| Veto HV Monitor | 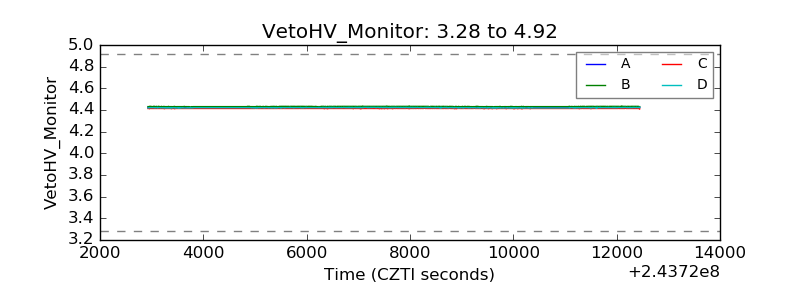 |
| Veto LLD | 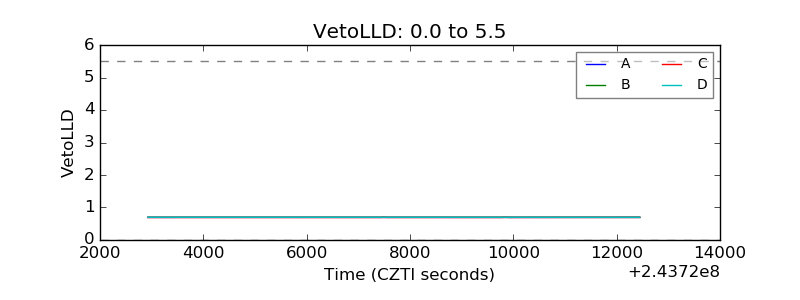 |
| Alpha Counter | 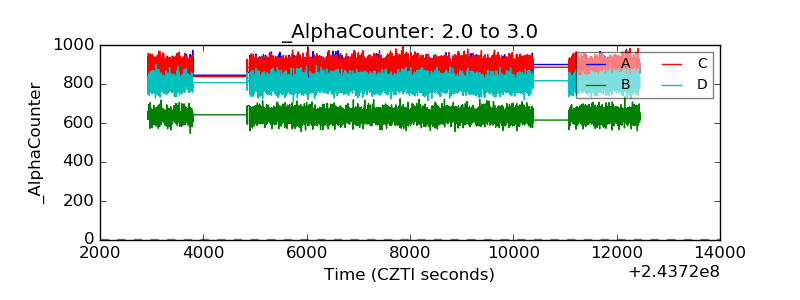 |
| _CPM_Rate | 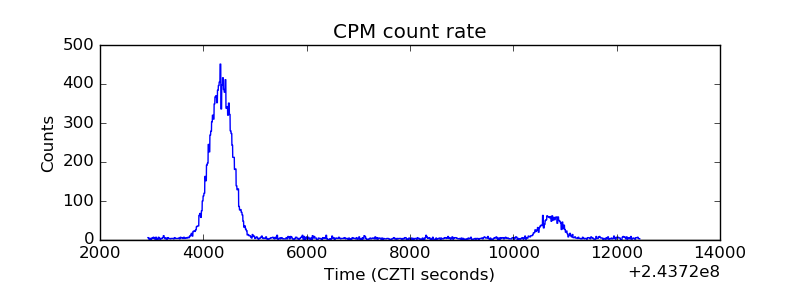 |
| CZT Counter | 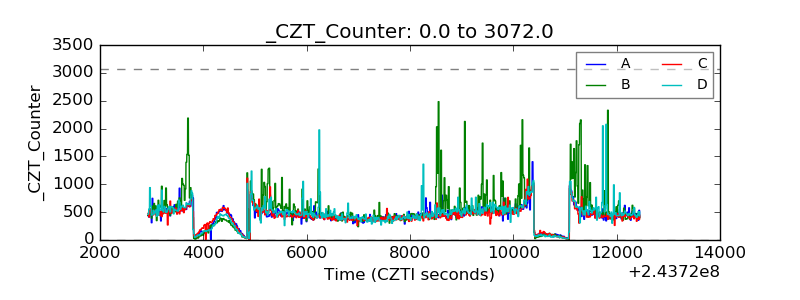 |
| +2.5 Volts monitor |  |
| +5 Volts monitor | 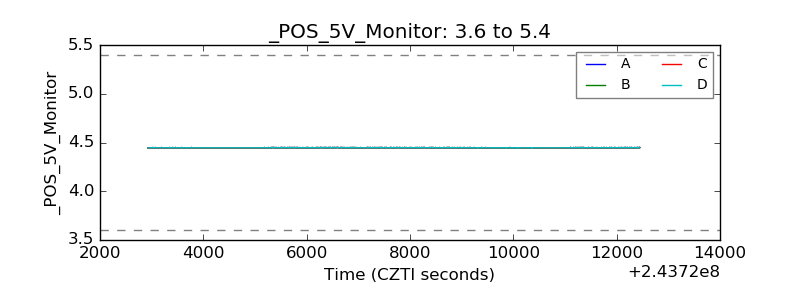 |
| _ROLL_ROT | 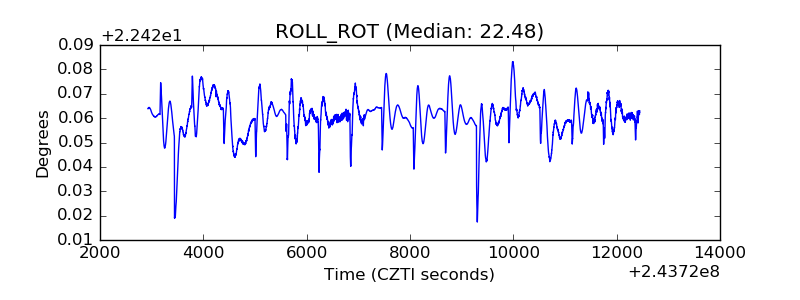 |
| _Roll_DEC | 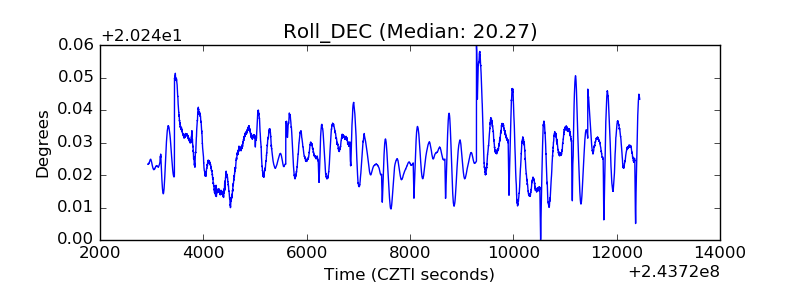 |
| _Roll_RA | 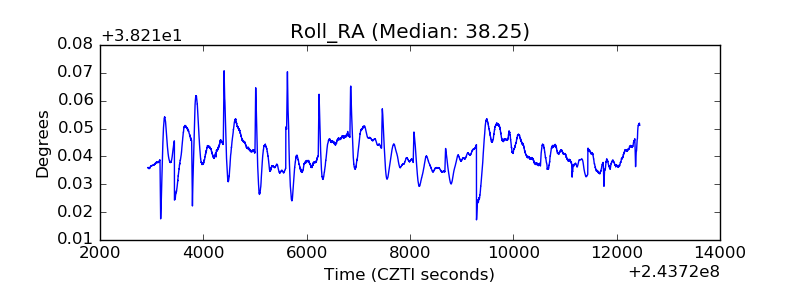 |
| Veto Counter | 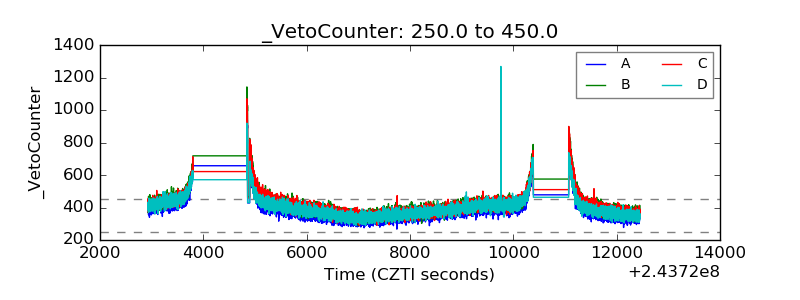 |