| Param | Original file | Final file |
|---|---|---|
| Filename | modeM0/AS1A03_078T01_9000001546_10729cztM0_level2.evt | modeM0/AS1A03_078T01_9000001546_10729cztM0_level2_quad_clean.evt |
| Size (bytes) | 550,681,920 | 99,020,160 |
| Size | 525.2 MB | 94.4 MB |
| Events in quadrant A | 3,636,305 | 621,497 |
| Events in quadrant B | 4,689,001 | 624,200 |
| Events in quadrant C | 3,480,152 | 631,052 |
| Events in quadrant D | 4,357,497 | 594,380 |
| Mode M0 | |||
|---|---|---|---|
| Quadrant | BADHDUFLAG | Total packets | Discarded packets |
| A | 0 | 16010 | 3 |
| B | 0 | 19119 | 2 |
| C | 0 | 15830 | 2 |
| D | 0 | 17999 | 2 |
| Mode SS | |||
|---|---|---|---|
| Quadrant | BADHDUFLAG | Total packets | Discarded packets |
| A | 0 | 156 | 0 |
| B | 0 | 156 | 0 |
| C | 0 | 156 | 0 |
| D | 0 | 156 | 0 |
| Mode M9 | |||
|---|---|---|---|
| Quadrant | BADHDUFLAG | Total packets | Discarded packets |
| A | 0 | 10 | 0 |
| B | 0 | 10 | 0 |
| C | 0 | 10 | 0 |
| D | 0 | 10 | 0 |
| Quadrant | Total seconds | Saturated seconds | Saturation percentage |
|---|---|---|---|
| A | 7587 | 93 | 1.225781% |
| B | 7587 | 438 | 5.773033% |
| C | 7587 | 47 | 0.619481% |
| D | 7587 | 109 | 1.436668% |
Noise dominated data is calculated using 1-second bins in cleaned event files. If a bin has >2000 counts, and if more than 50% of those come from <1% of pixels, then it is considered to be noise-dominated and hence unusable.
| Quadrant | # 1 sec bins | Bins with >0 counts | Bins with >2000 counts | High rate bins dominated by noise | Noise dominated (total time) | Noise dominated (detector-on time) | Marked lightcurve |
|---|---|---|---|---|---|---|---|
| A | 8542 | 7590 | 2 | 2 | 0.02% | 0.03% | 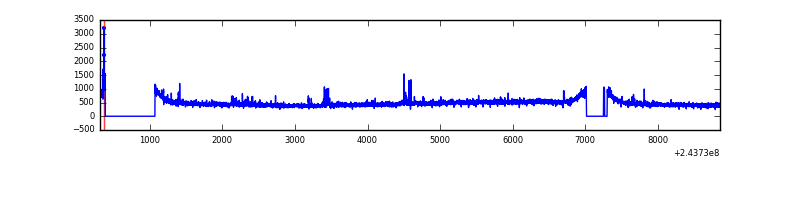 |
| B | 8542 | 7589 | 157 | 157 | 1.84% | 2.07% | 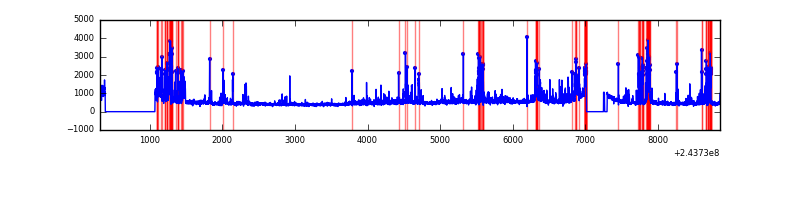 |
| C | 8542 | 7590 | 0 | 0 | 0.00% | 0.00% | 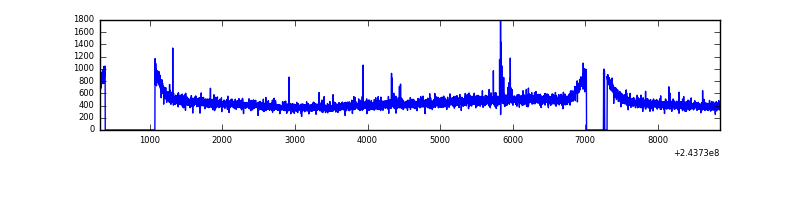 |
| D | 8542 | 7590 | 57 | 57 | 0.67% | 0.75% | 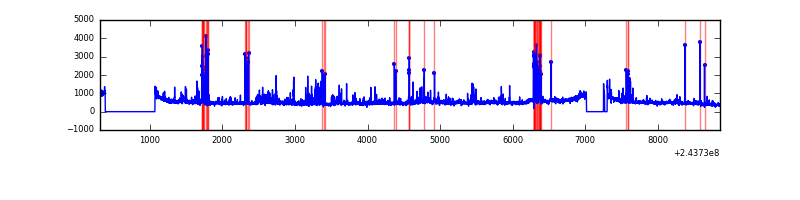 |
Top three noisy pixels from each quadrant. If the there are fewer than three noisy pixels in the level2.evt file, extra rows are filled as -1
| Pixel properties | Quadrant properties | ||||||
|---|---|---|---|---|---|---|---|
| Quadrant | DetID | PixID | Counts | Sigma | Mean | Median | Sigma |
| A | 14 | 254 | 48142 | 253.8 | 903 | 882 | 186.2 |
| A | 15 | 239 | 36834 | 193.07 | 903 | 882 | 186.2 |
| A | 13 | 251 | 31556 | 164.73 | 903 | 882 | 186.2 |
| B | 4 | 239 | 865502 | 4956.46 | 902 | 880 | 174.4 |
| B | 4 | 81 | 195614 | 1116.32 | 902 | 880 | 174.4 |
| B | 0 | 214 | 41168 | 230.95 | 902 | 880 | 174.4 |
| C | 14 | 234 | 22380 | 102.37 | 887 | 892 | 209.9 |
| C | 13 | 61 | 6538 | 26.9 | 887 | 892 | 209.9 |
| C | 3 | 202 | 2151 | 6.0 | 887 | 892 | 209.9 |
| D | 8 | 195 | 404835 | 1882.52 | 874 | 850 | 214.6 |
| D | 1 | 52 | 245405 | 1139.59 | 874 | 850 | 214.6 |
| D | 13 | 249 | 157932 | 731.98 | 874 | 850 | 214.6 |
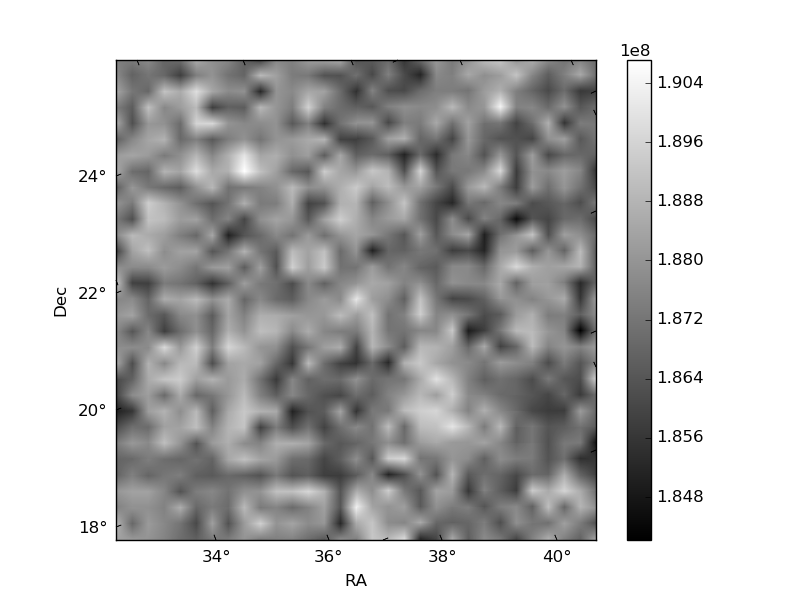
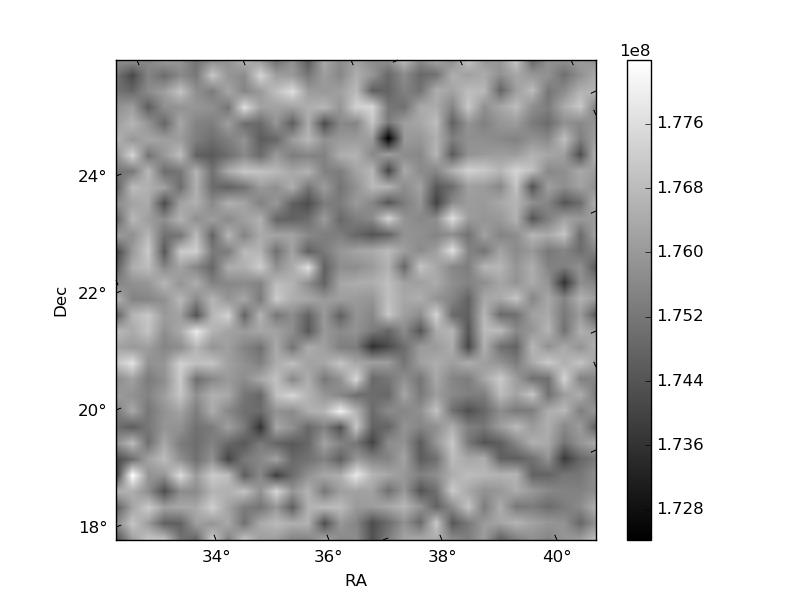
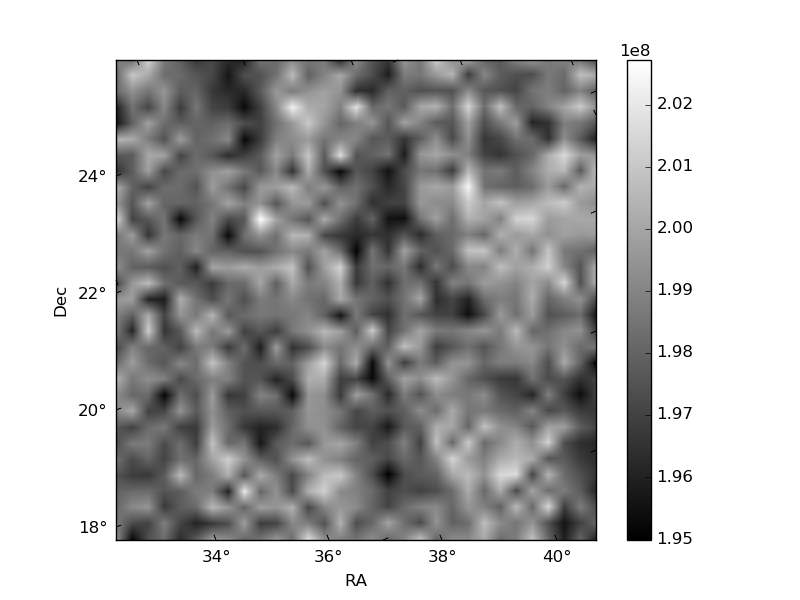
Histogram calculated using DETX and DETY for each event in the final _common_clean file
| Quadrant A | 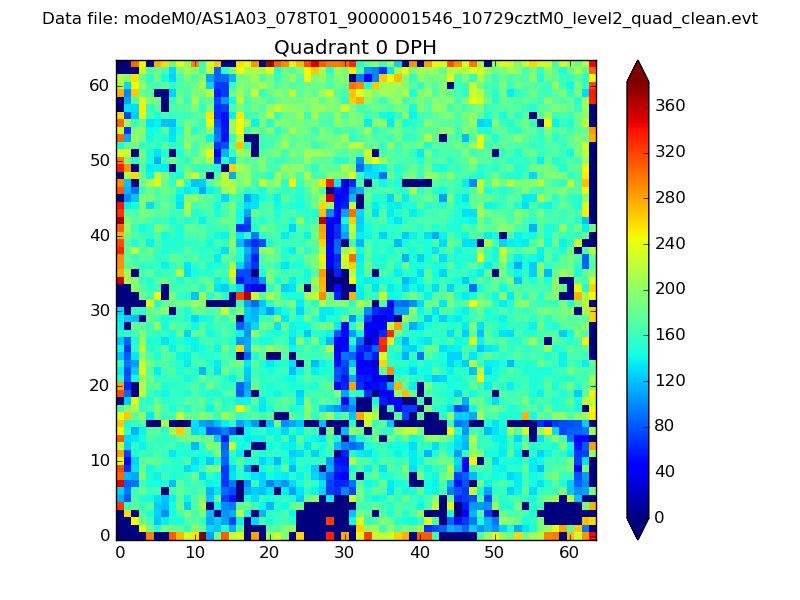 |
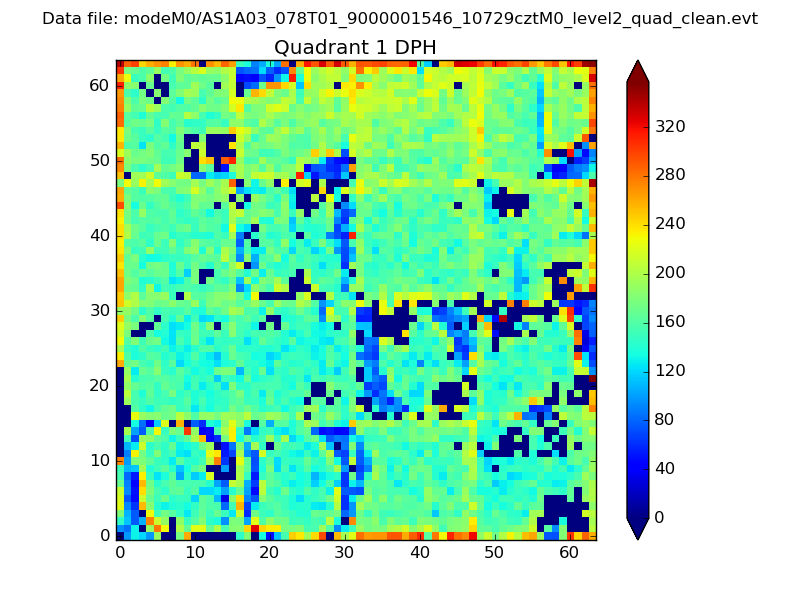 |
Quadrant B |
|---|---|---|---|
| Quadrant D | 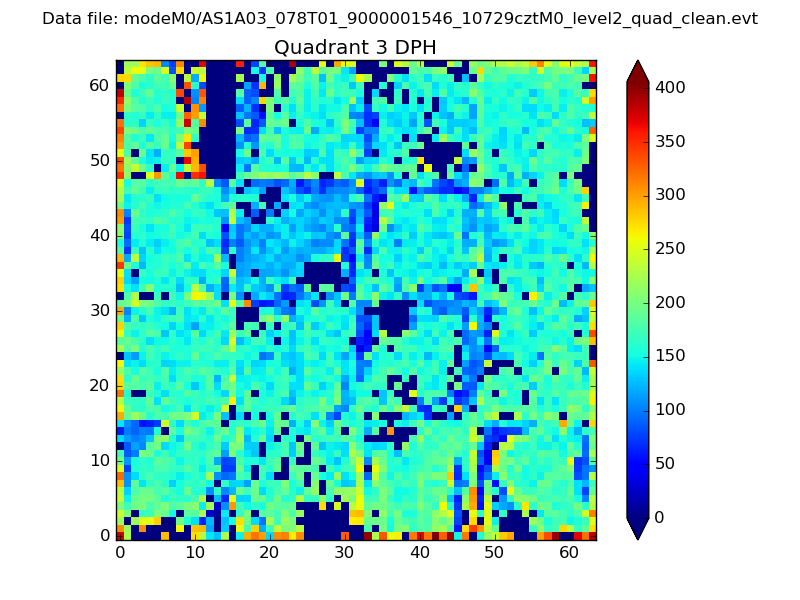 |
 |
Quadrant C |
| Plot type | Count rate plots | Images |
|---|---|---|
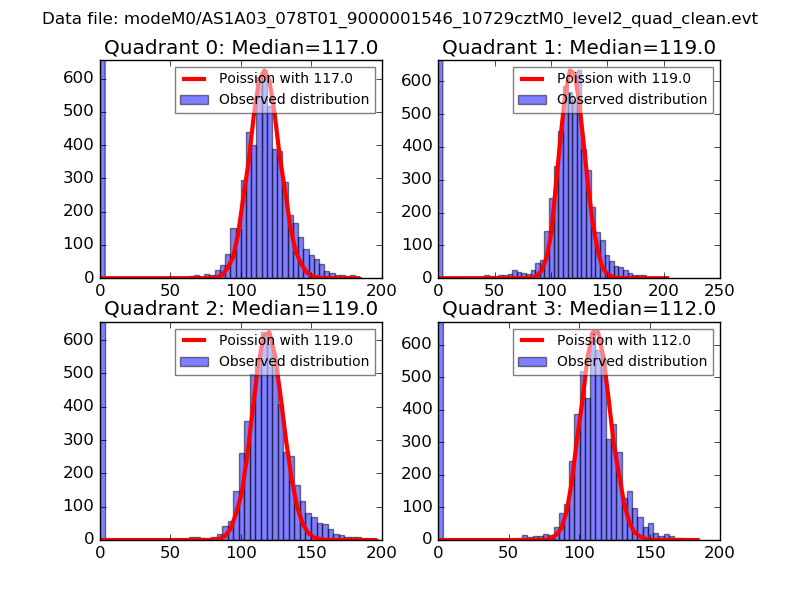
| Comparison with Poisson distribution Blue bars denote a histogram of data divided into 1 sec bins. Red curve is a Poisson curve with rate = median count rate of data. |
 |
 |
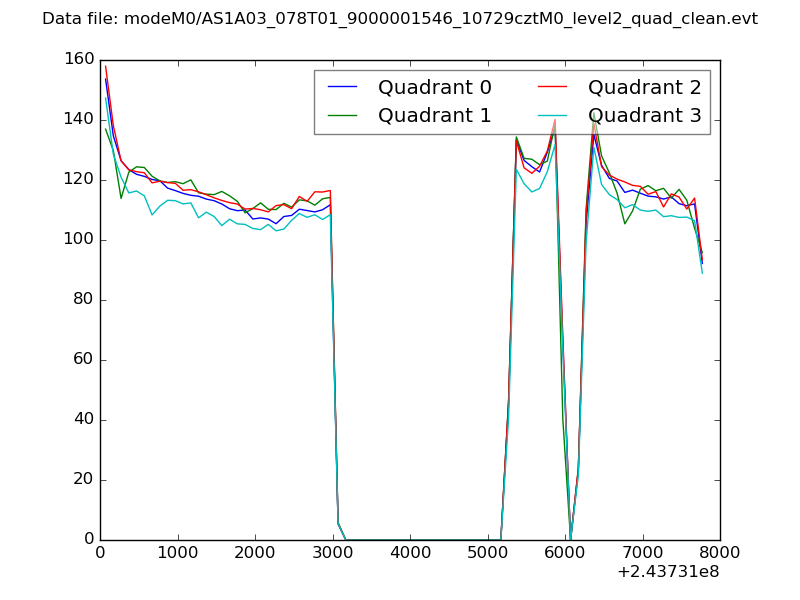
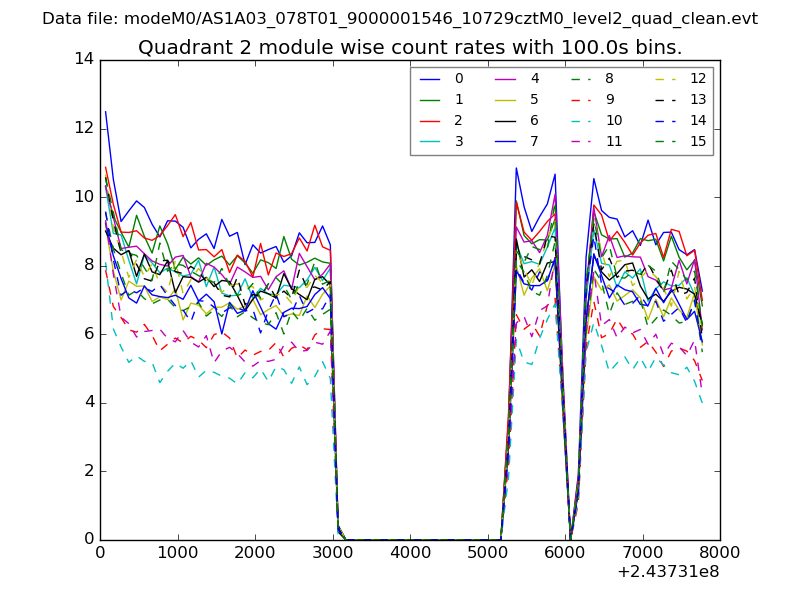
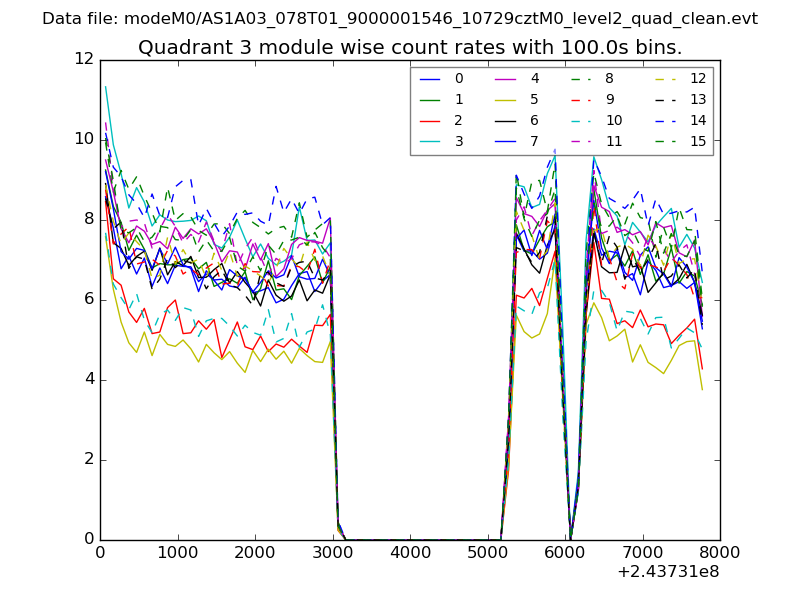
| Quadrant-wise count rates Data is divided into 100 sec bins |
 |
|
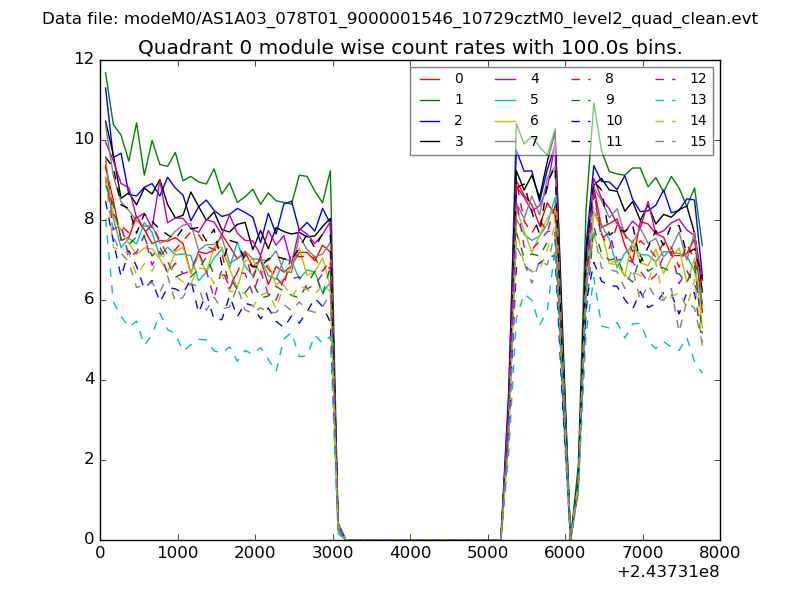
| Module-wise count rates for Quadrant A Data is divided into 100 sec bins |
 |
 |
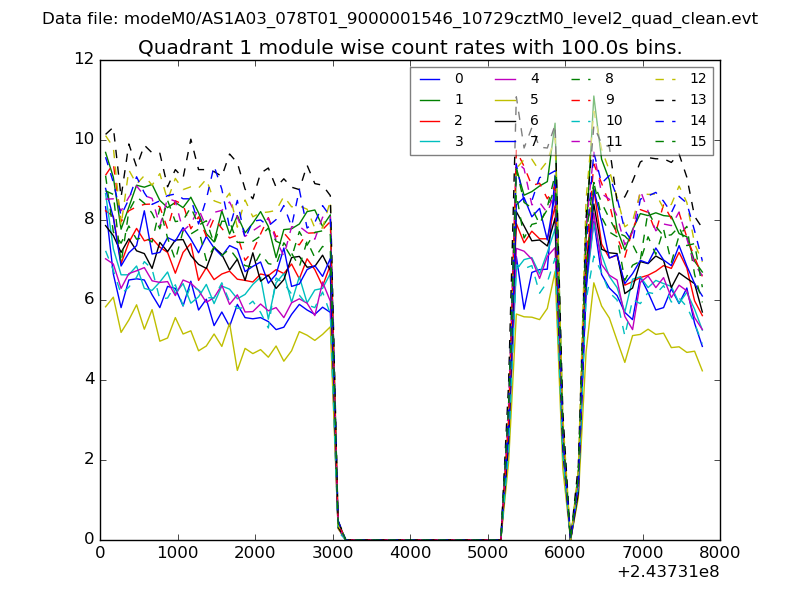
| Module-wise count rates for Quadrant B Data is divided into 100 sec bins |
 |
 |
| Module-wise count rates for Quadrant C Data is divided into 100 sec bins |
 |
 |
| Module-wise count rates for Quadrant D Data is divided into 100 sec bins |
 |
 |
| Parameter | Plot |
|---|---|
| CZT HV Monitor | 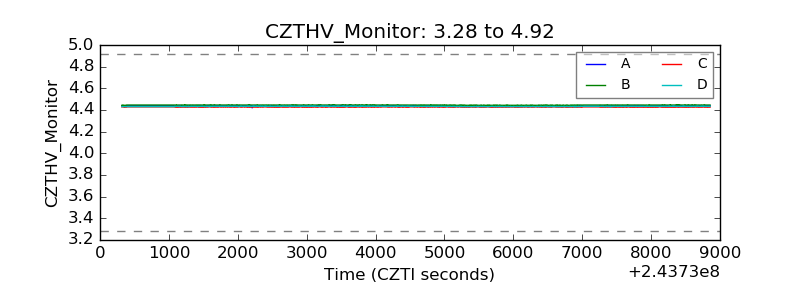 |
| D_VDD | 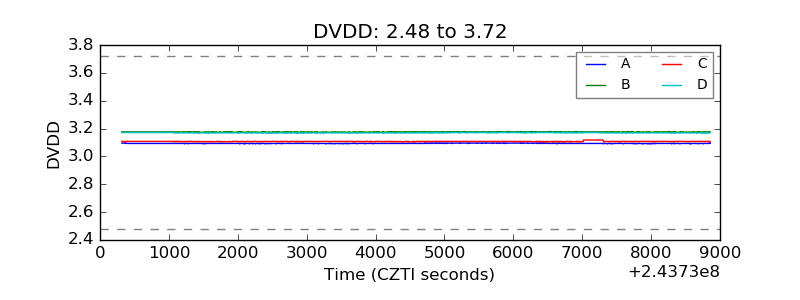 |
| Temperature 1 | 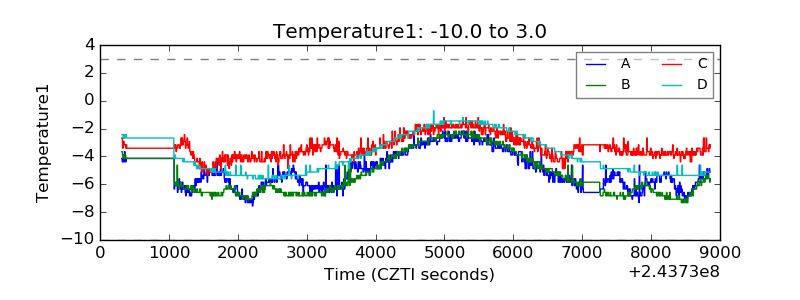 |
| Veto HV Monitor | 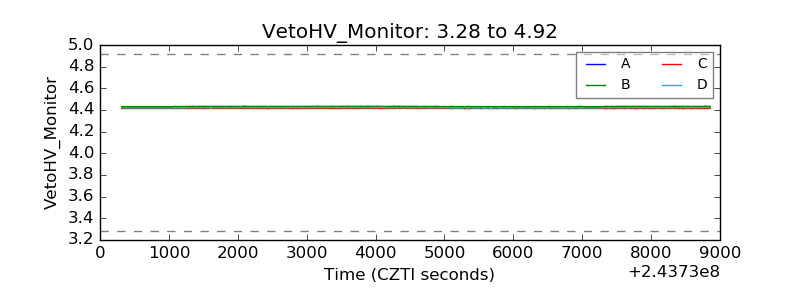 |
| Veto LLD | 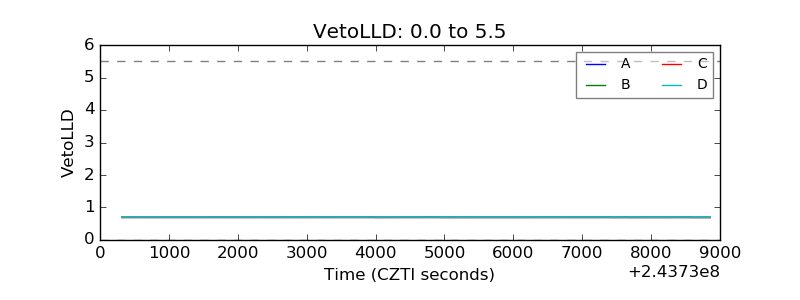 |
| Alpha Counter | 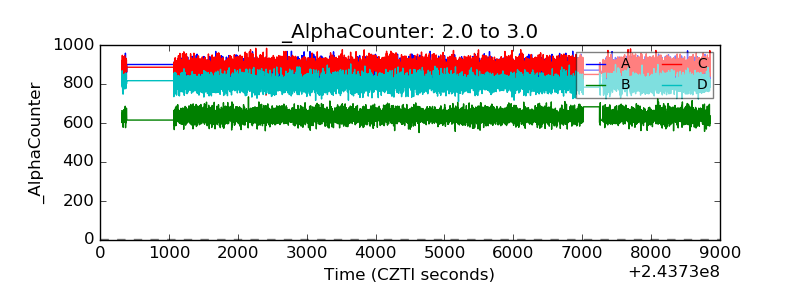 |
| _CPM_Rate | 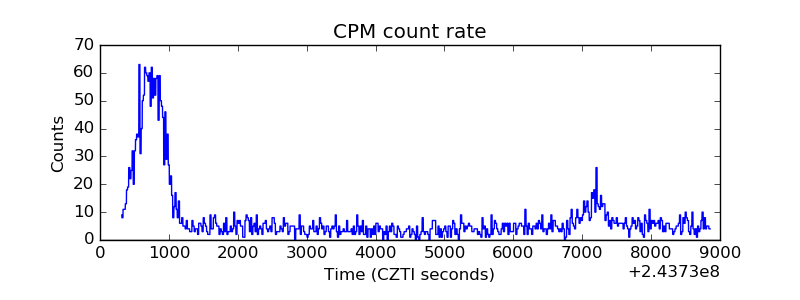 |
| CZT Counter |  |
| +2.5 Volts monitor |  |
| +5 Volts monitor |  |
| _ROLL_ROT |  |
| _Roll_DEC | 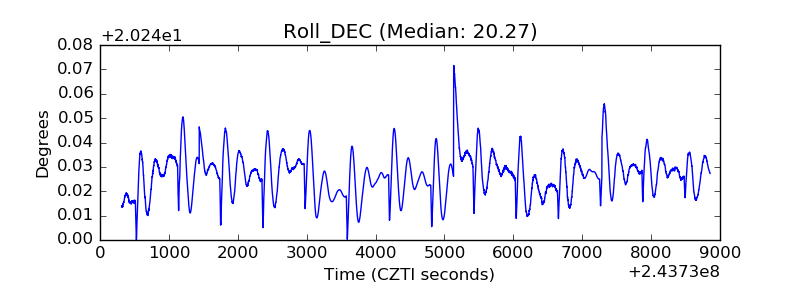 |
| _Roll_RA |  |
| Veto Counter | 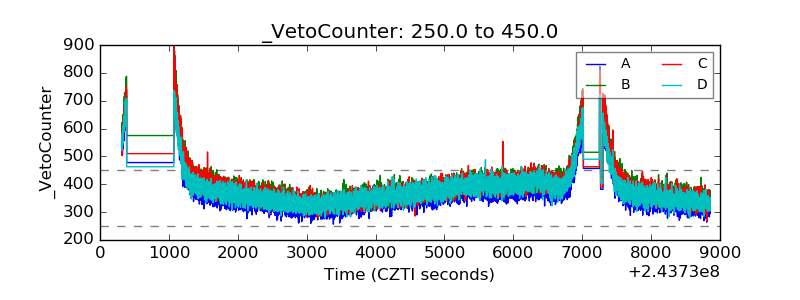 |