| Param | Original file | Final file |
|---|---|---|
| Filename | modeM0/AS1A03_078T01_9000001546_10730cztM0_level2.evt | modeM0/AS1A03_078T01_9000001546_10730cztM0_level2_quad_clean.evt |
| Size (bytes) | 689,207,040 | 117,008,640 |
| Size | 657.3 MB | 111.6 MB |
| Events in quadrant A | 5,797,839 | 733,438 |
| Events in quadrant B | 5,332,699 | 747,709 |
| Events in quadrant C | 4,045,886 | 752,763 |
| Events in quadrant D | 5,107,174 | 705,659 |
| Mode M0 | |||
|---|---|---|---|
| Quadrant | BADHDUFLAG | Total packets | Discarded packets |
| A | 0 | 23242 | 45 |
| B | 0 | 21717 | 22 |
| C | 0 | 18233 | 19 |
| D | 0 | 21266 | 16 |
| Mode SS | |||
|---|---|---|---|
| Quadrant | BADHDUFLAG | Total packets | Discarded packets |
| A | 0 | 178 | 2 |
| B | 0 | 178 | 0 |
| C | 0 | 178 | 0 |
| D | 0 | 178 | 0 |
| Mode M9 | |||
|---|---|---|---|
| Quadrant | BADHDUFLAG | Total packets | Discarded packets |
| A | 0 | 3 | 0 |
| B | 0 | 3 | 0 |
| C | 0 | 3 | 0 |
| D | 0 | 3 | 0 |
| Quadrant | Total seconds | Saturated seconds | Saturation percentage |
|---|---|---|---|
| A | 8697 | 321 | 3.690928% |
| B | 8701 | 473 | 5.436157% |
| C | 8700 | 87 | 1.000000% |
| D | 8703 | 254 | 2.918534% |
Noise dominated data is calculated using 1-second bins in cleaned event files. If a bin has >2000 counts, and if more than 50% of those come from <1% of pixels, then it is considered to be noise-dominated and hence unusable.
| Quadrant | # 1 sec bins | Bins with >0 counts | Bins with >2000 counts | High rate bins dominated by noise | Noise dominated (total time) | Noise dominated (detector-on time) | Marked lightcurve |
|---|---|---|---|---|---|---|---|
| A | 9043 | 8712 | 177 | 177 | 1.96% | 2.03% | 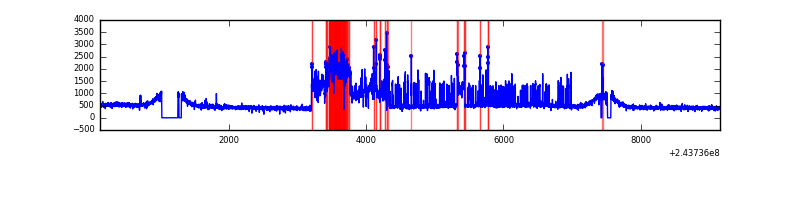 |
| B | 9043 | 8711 | 155 | 155 | 1.71% | 1.78% | 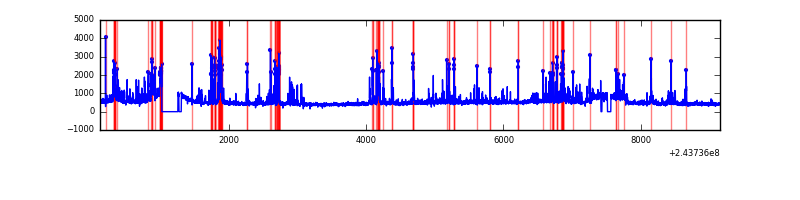 |
| C | 9043 | 8712 | 4 | 4 | 0.04% | 0.05% | 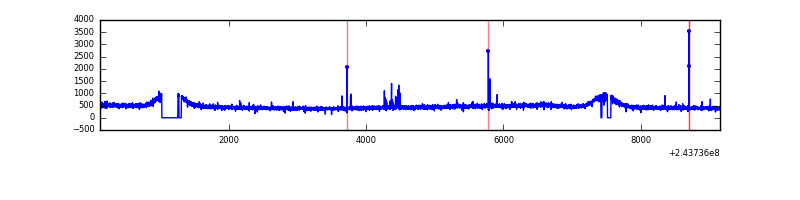 |
| D | 9043 | 8712 | 135 | 135 | 1.49% | 1.55% | 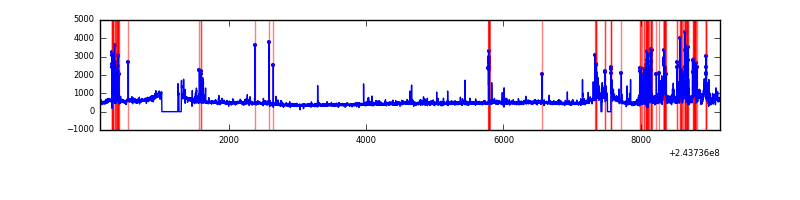 |
Top three noisy pixels from each quadrant. If the there are fewer than three noisy pixels in the level2.evt file, extra rows are filled as -1
| Pixel properties | Quadrant properties | ||||||
|---|---|---|---|---|---|---|---|
| Quadrant | DetID | PixID | Counts | Sigma | Mean | Median | Sigma |
| A | 15 | 239 | 1689506 | 7857.64 | 1046 | 1019 | 214.9 |
| A | 14 | 254 | 32758 | 147.7 | 1046 | 1019 | 214.9 |
| A | 15 | 174 | 18027 | 79.15 | 1046 | 1019 | 214.9 |
| B | 4 | 239 | 1019752 | 4948.44 | 1049 | 1021 | 205.9 |
| B | 4 | 81 | 141055 | 680.21 | 1049 | 1021 | 205.9 |
| B | 0 | 214 | 36839 | 173.98 | 1049 | 1021 | 205.9 |
| C | 14 | 234 | 32700 | 130.88 | 1027 | 1029 | 242.0 |
| C | 13 | 61 | 7625 | 27.26 | 1027 | 1029 | 242.0 |
| C | 8 | 128 | 4471 | 14.22 | 1027 | 1029 | 242.0 |
| D | 1 | 52 | 604082 | 2446.44 | 1011 | 981 | 246.5 |
| D | 8 | 195 | 203699 | 822.31 | 1011 | 981 | 246.5 |
| D | 10 | 172 | 200864 | 810.81 | 1011 | 981 | 246.5 |
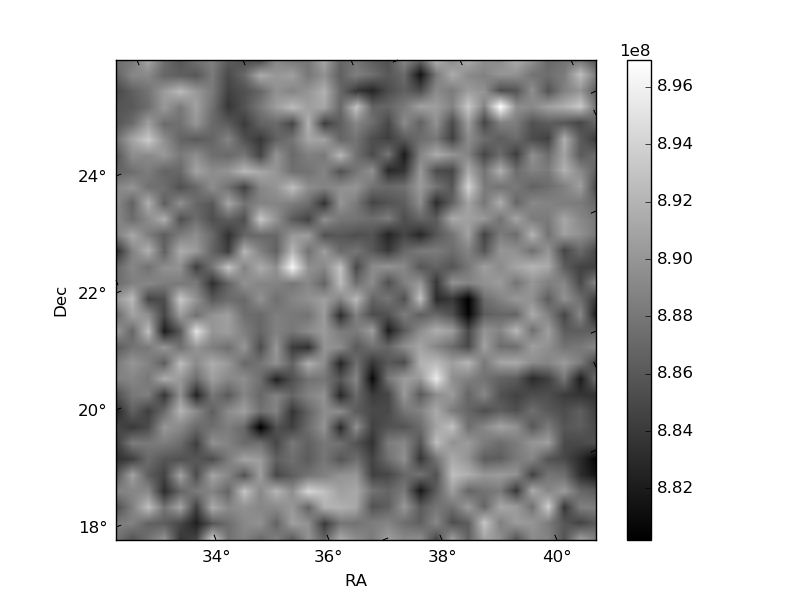
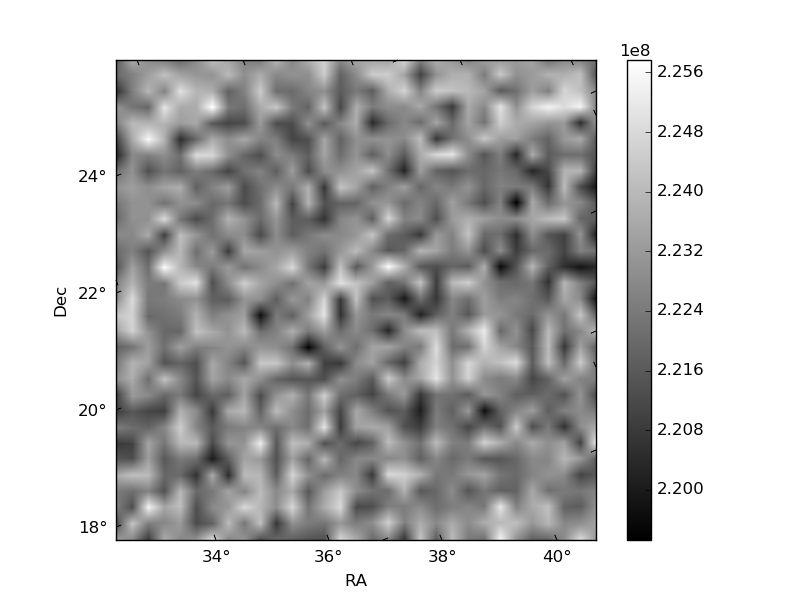
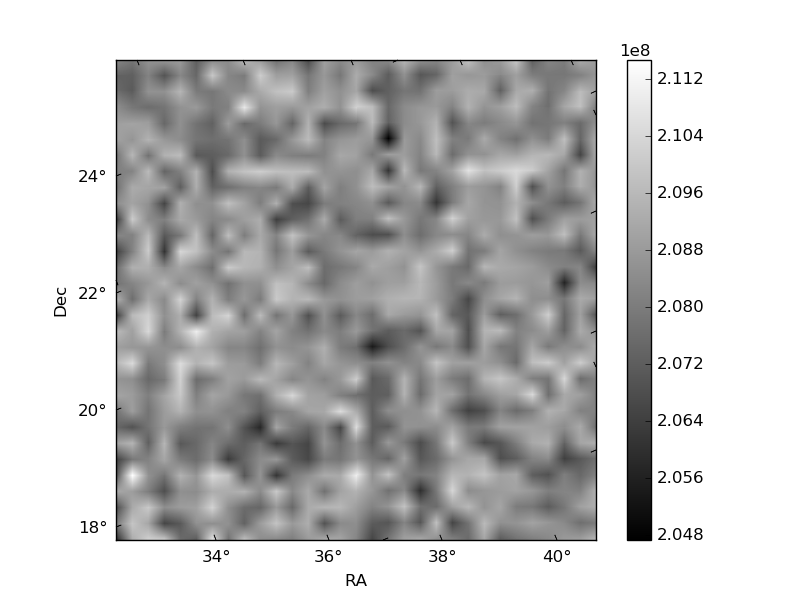
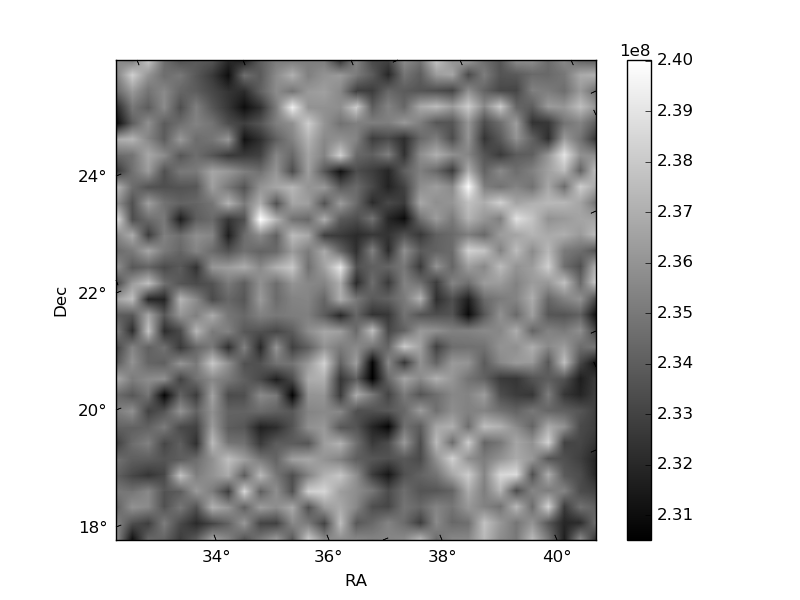
Histogram calculated using DETX and DETY for each event in the final _common_clean file
| Quadrant A | 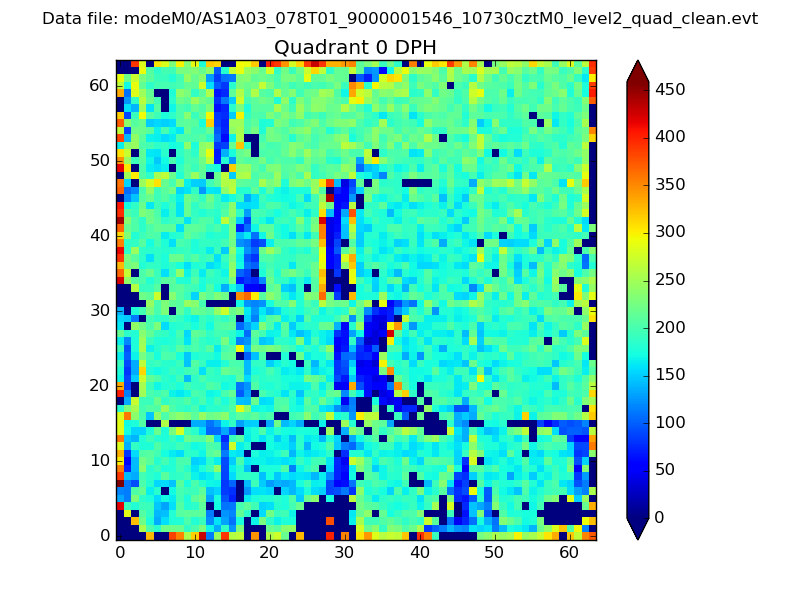 |
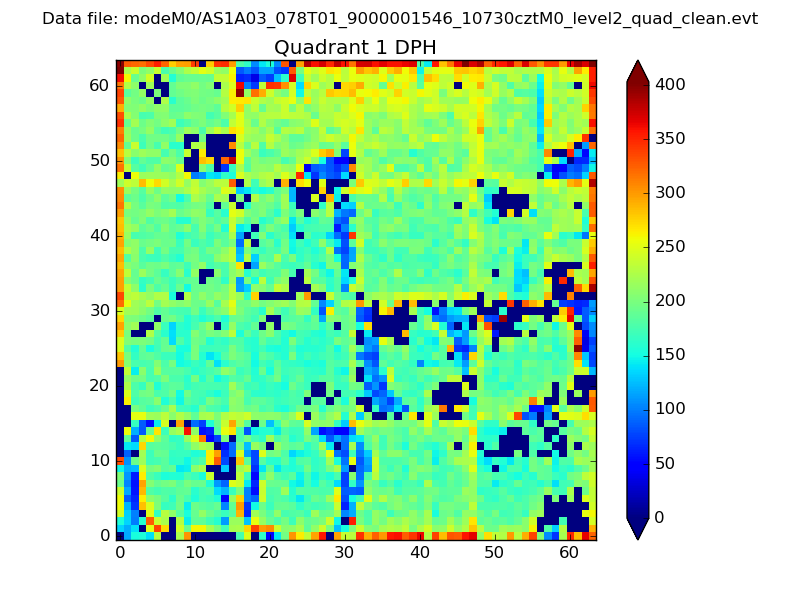 |
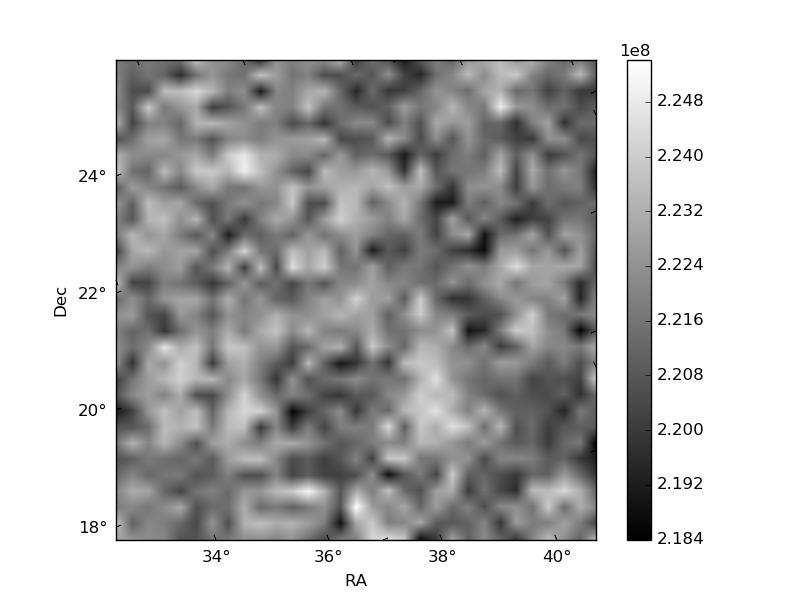
Quadrant B |
|---|---|---|---|
| Quadrant D | 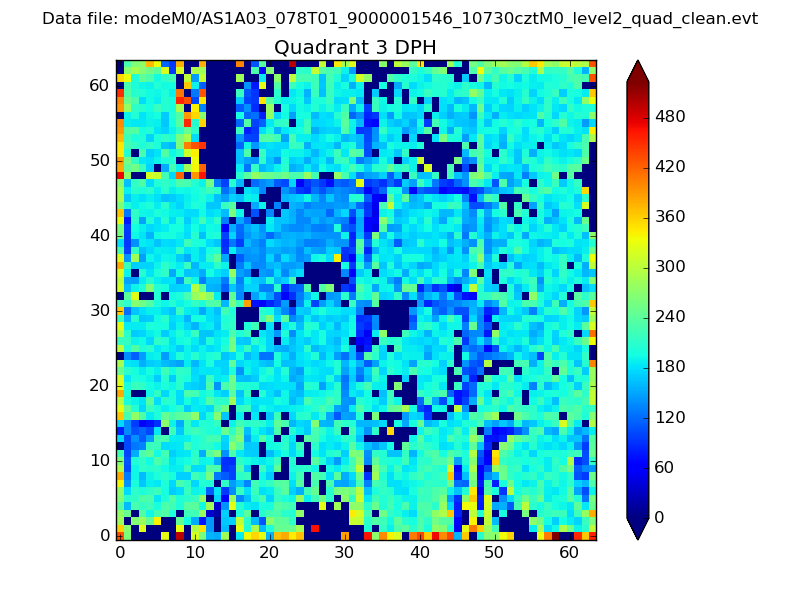 |
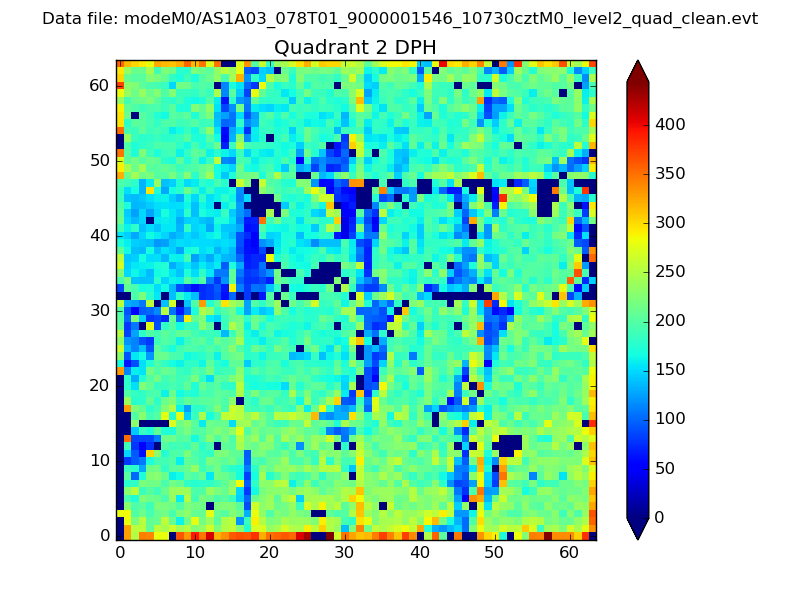 |
Quadrant C |
| Plot type | Count rate plots | Images |
|---|---|---|
| Comparison with Poisson distribution Blue bars denote a histogram of data divided into 1 sec bins. Red curve is a Poisson curve with rate = median count rate of data. |
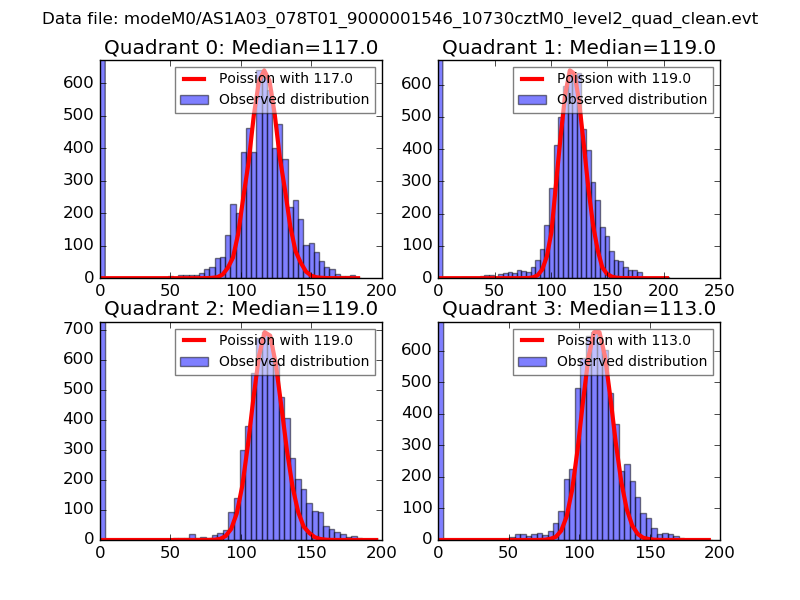 |
 |
| Quadrant-wise count rates Data is divided into 100 sec bins |
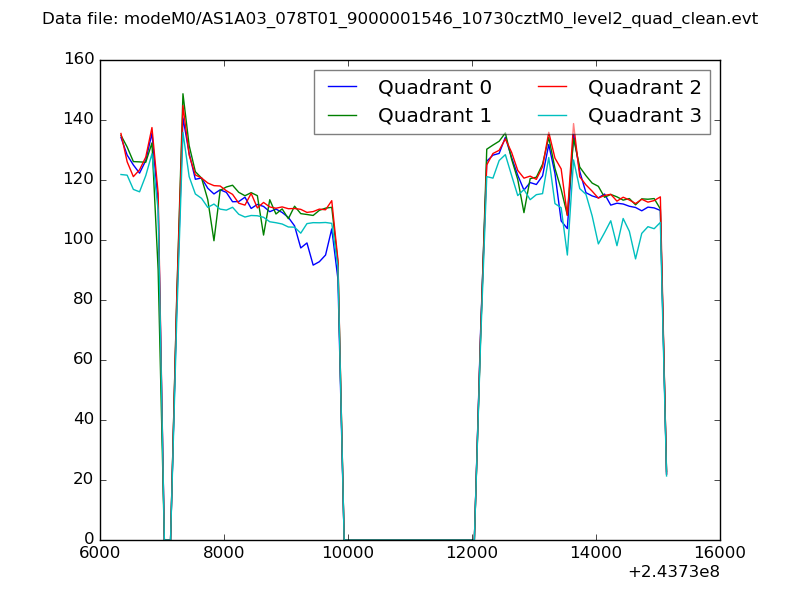 |
|
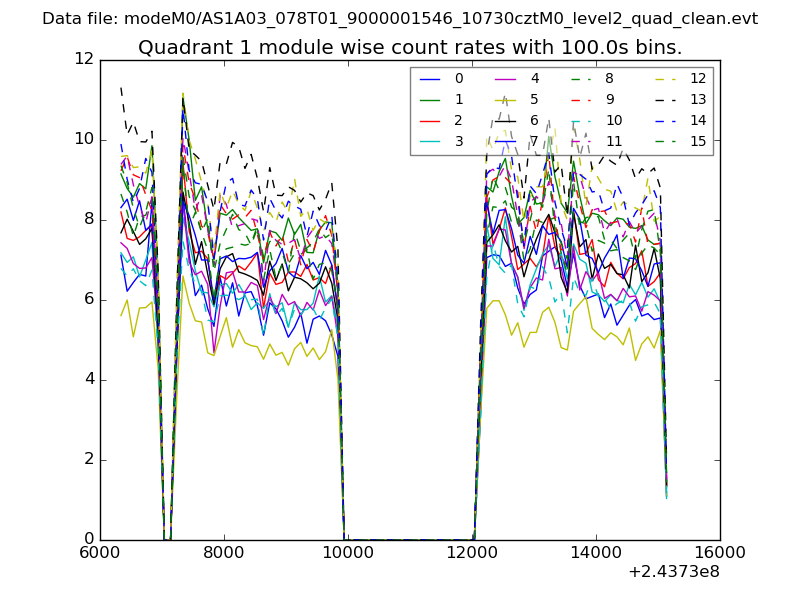
| Module-wise count rates for Quadrant A Data is divided into 100 sec bins |
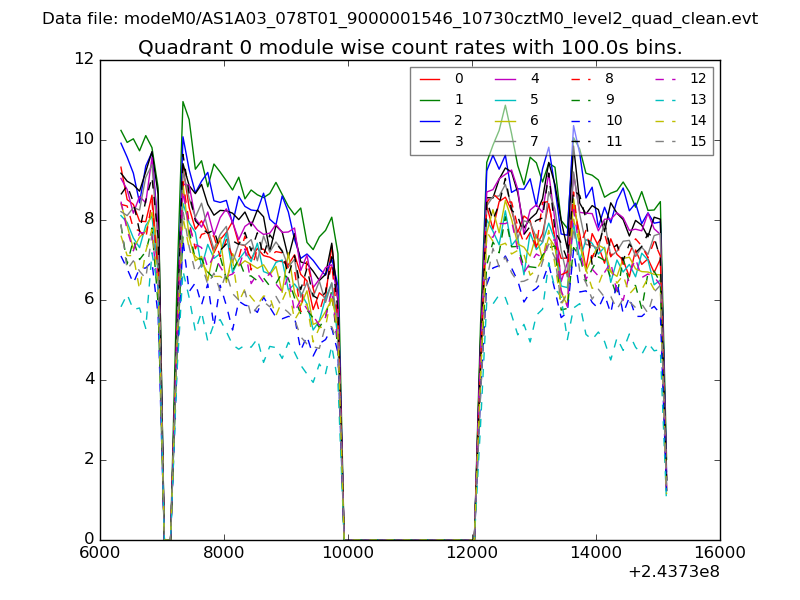 |
 |
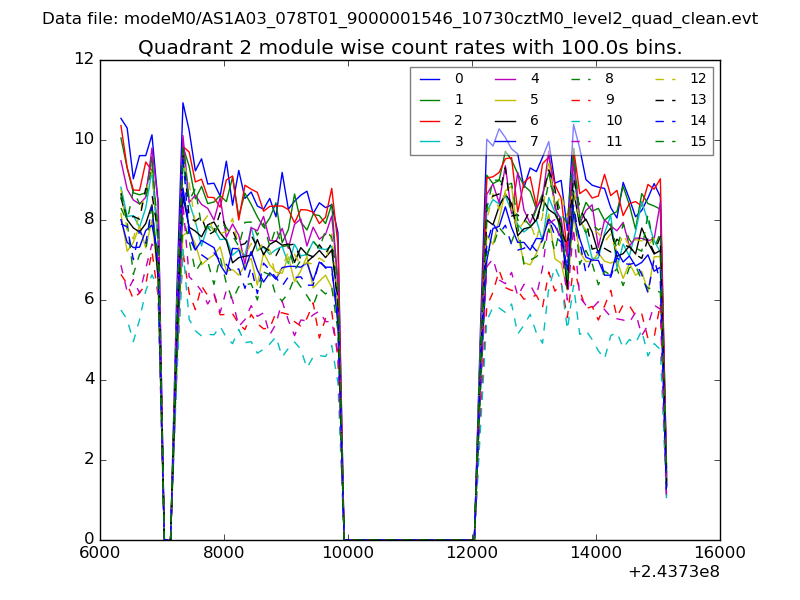
| Module-wise count rates for Quadrant B Data is divided into 100 sec bins |
 |
 |
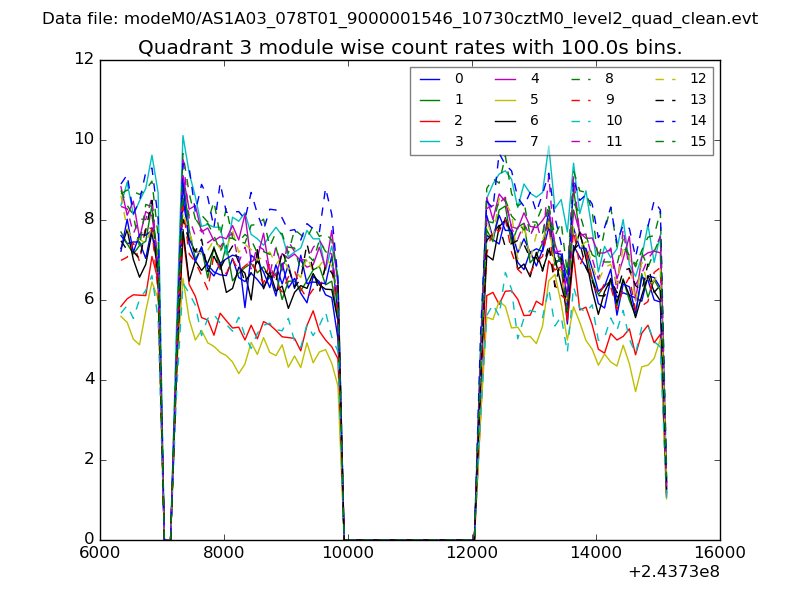
| Module-wise count rates for Quadrant C Data is divided into 100 sec bins |
 |
 |
| Module-wise count rates for Quadrant D Data is divided into 100 sec bins |
 |
 |
| Parameter | Plot |
|---|---|
| CZT HV Monitor | 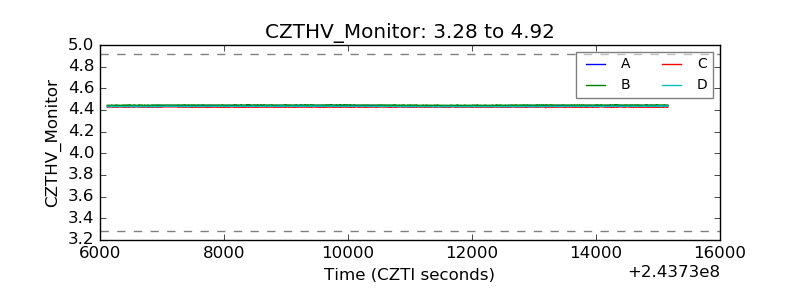 |
| D_VDD | 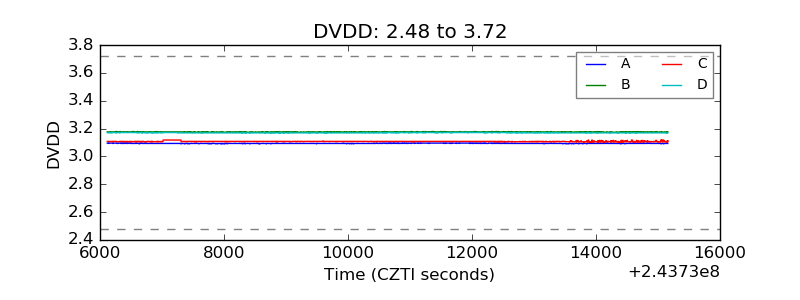 |
| Temperature 1 | 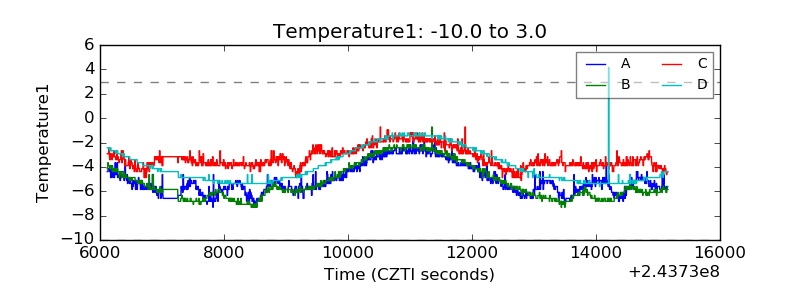 |
| Veto HV Monitor | 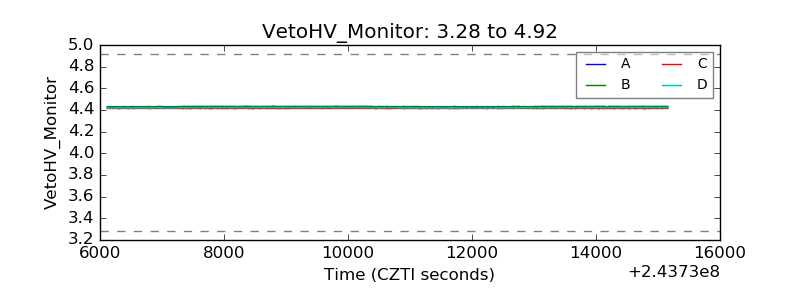 |
| Veto LLD | 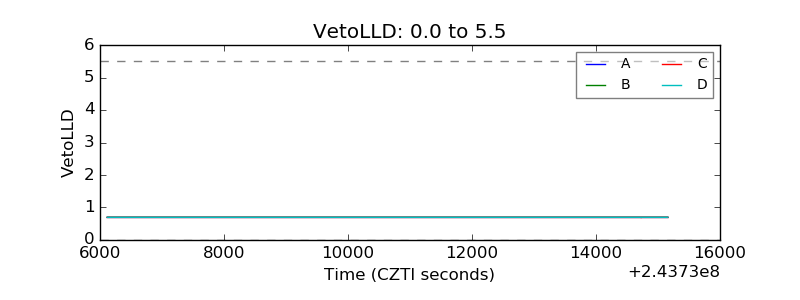 |
| Alpha Counter | 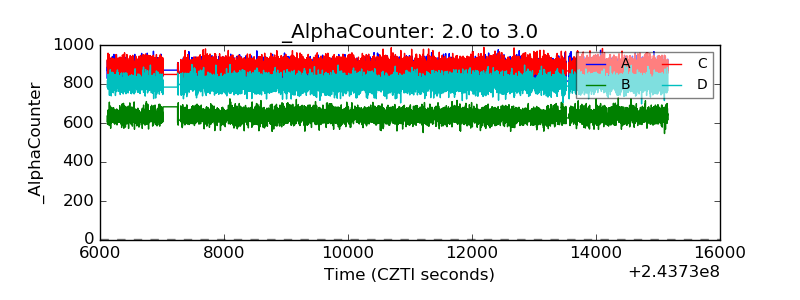 |
| _CPM_Rate | 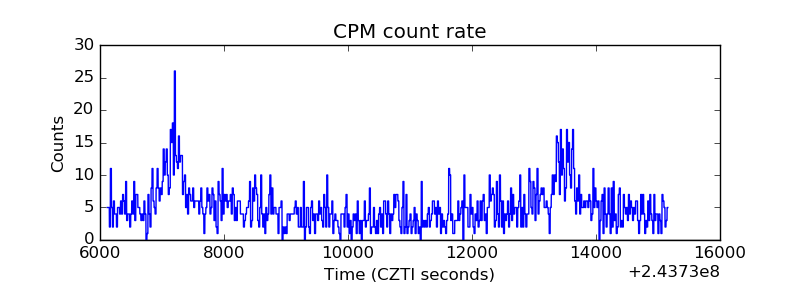 |
| CZT Counter | 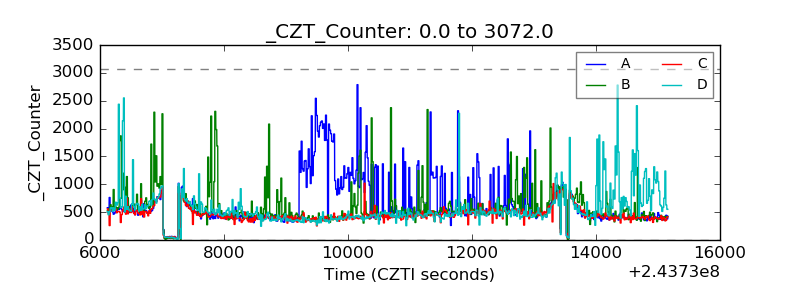 |
| +2.5 Volts monitor | 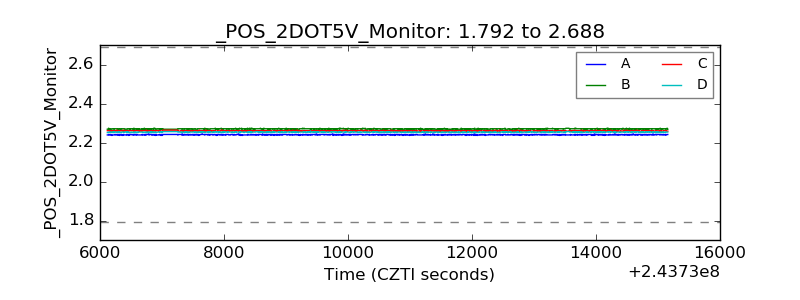 |
| +5 Volts monitor | 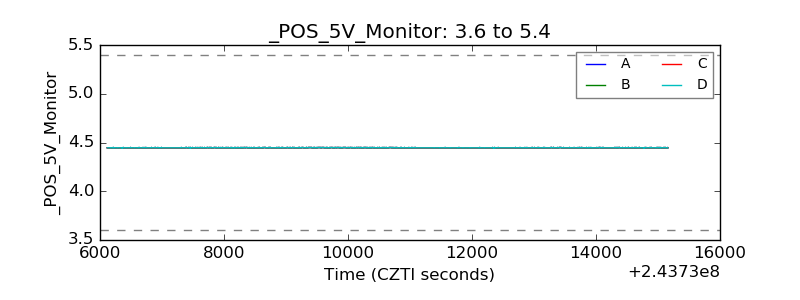 |
| _ROLL_ROT | 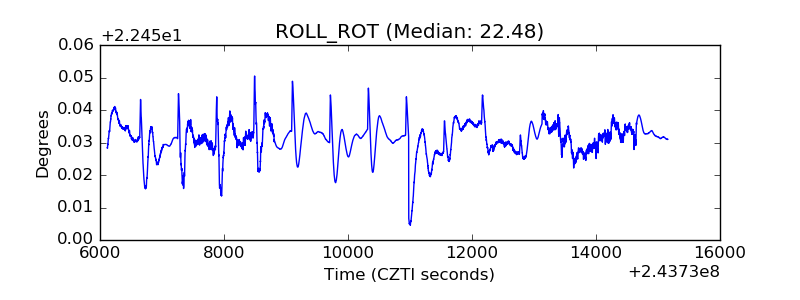 |
| _Roll_DEC | 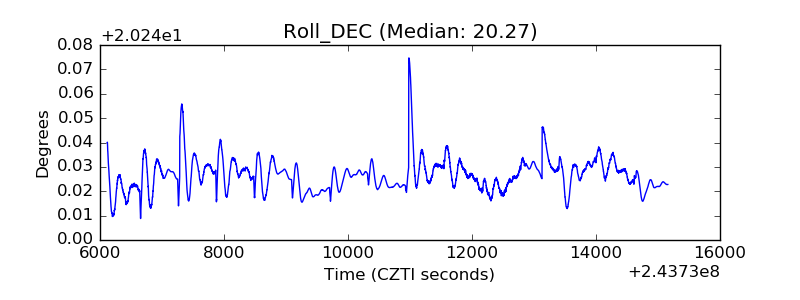 |
| _Roll_RA | 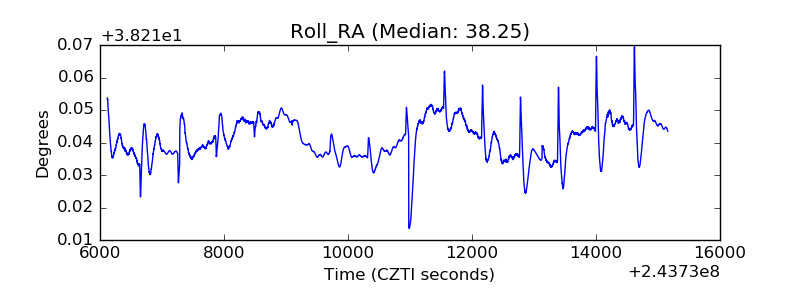 |
| Veto Counter | 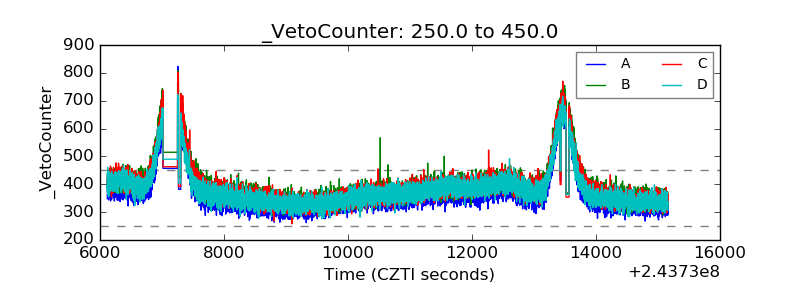 |