| Param | Original file | Final file |
|---|---|---|
| Filename | modeM0/AS1A03_078T01_9000001546_10731cztM0_level2.evt | modeM0/AS1A03_078T01_9000001546_10731cztM0_level2_quad_clean.evt |
| Size (bytes) | 739,278,720 | 95,760,000 |
| Size | 705.0 MB | 91.3 MB |
| Events in quadrant A | 3,821,781 | 649,997 |
| Events in quadrant B | 4,206,839 | 669,906 |
| Events in quadrant C | 3,477,125 | 671,210 |
| Events in quadrant D | 10,372,109 | 383,114 |
| Mode M0 | |||
|---|---|---|---|
| Quadrant | BADHDUFLAG | Total packets | Discarded packets |
| A | 0 | 18660 | 1894 |
| B | 0 | 19459 | 1844 |
| C | 0 | 17095 | 1128 |
| D | 0 | 41855 | 6145 |
| Mode SS | |||
|---|---|---|---|
| Quadrant | BADHDUFLAG | Total packets | Discarded packets |
| A | 0 | 168 | 10 |
| B | 0 | 168 | 8 |
| C | 0 | 168 | 6 |
| D | 0 | 168 | 10 |
| Mode M9 | |||
|---|---|---|---|
| Quadrant | BADHDUFLAG | Total packets | Discarded packets |
| A | 0 | 3 | 0 |
| B | 0 | 3 | 0 |
| C | 0 | 3 | 0 |
| D | 0 | 3 | 0 |
| Quadrant | Total seconds | Saturated seconds | Saturation percentage |
|---|---|---|---|
| A | 7580 | 214 | 2.823219% |
| B | 7589 | 316 | 4.163921% |
| C | 7686 | 96 | 1.249024% |
| D | 7189 | 2714 | 37.752121% |
Noise dominated data is calculated using 1-second bins in cleaned event files. If a bin has >2000 counts, and if more than 50% of those come from <1% of pixels, then it is considered to be noise-dominated and hence unusable.
| Quadrant | # 1 sec bins | Bins with >0 counts | Bins with >2000 counts | High rate bins dominated by noise | Noise dominated (total time) | Noise dominated (detector-on time) | Marked lightcurve |
|---|---|---|---|---|---|---|---|
| A | 8623 | 7998 | 8 | 8 | 0.09% | 0.10% | 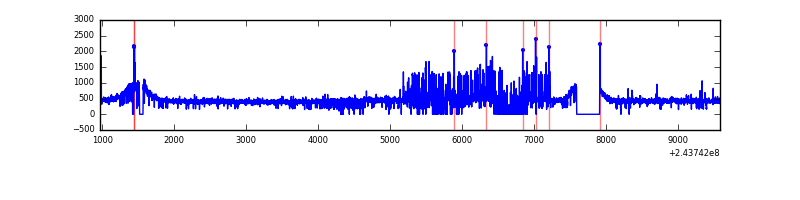 |
| B | 8623 | 7995 | 52 | 52 | 0.60% | 0.65% | 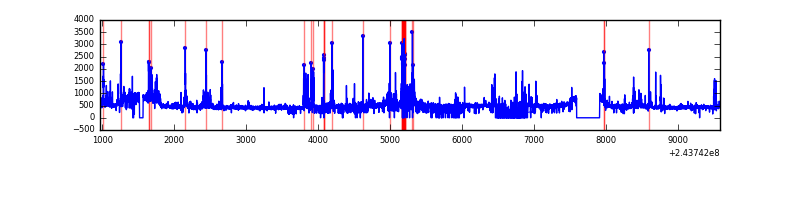 |
| C | 8623 | 8068 | 2 | 2 | 0.02% | 0.02% | 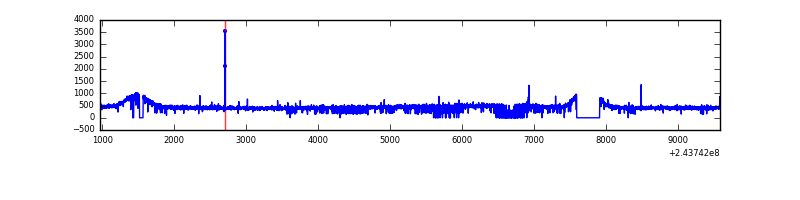 |
| D | 8622 | 7611 | 2219 | 2219 | 25.74% | 29.16% | 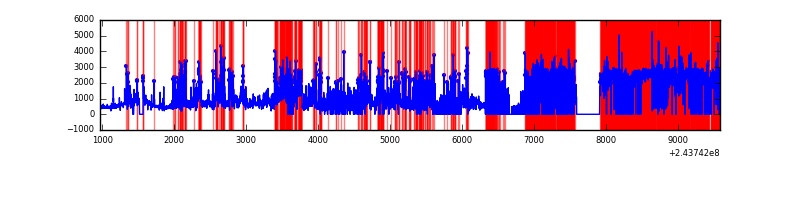 |
Top three noisy pixels from each quadrant. If the there are fewer than three noisy pixels in the level2.evt file, extra rows are filled as -1
| Pixel properties | Quadrant properties | ||||||
|---|---|---|---|---|---|---|---|
| Quadrant | DetID | PixID | Counts | Sigma | Mean | Median | Sigma |
| A | 15 | 239 | 311713 | 1687.05 | 890 | 866 | 184.3 |
| A | 14 | 254 | 25831 | 135.49 | 890 | 866 | 184.3 |
| A | 1 | 162 | 16058 | 82.45 | 890 | 866 | 184.3 |
| B | 4 | 239 | 578834 | 3289.67 | 894 | 867 | 175.7 |
| B | 4 | 81 | 46812 | 261.51 | 894 | 867 | 175.7 |
| B | 0 | 214 | 35527 | 197.28 | 894 | 867 | 175.7 |
| C | 14 | 234 | 12231 | 54.7 | 881 | 882 | 207.5 |
| C | 8 | 128 | 11083 | 49.17 | 881 | 882 | 207.5 |
| C | 13 | 61 | 6673 | 27.91 | 881 | 882 | 207.5 |
| D | 1 | 52 | 7380046 | 49741.77 | 608 | 590 | 148.4 |
| D | 10 | 172 | 297900 | 2004.04 | 608 | 590 | 148.4 |
| D | 12 | 233 | 98988 | 663.26 | 608 | 590 | 148.4 |
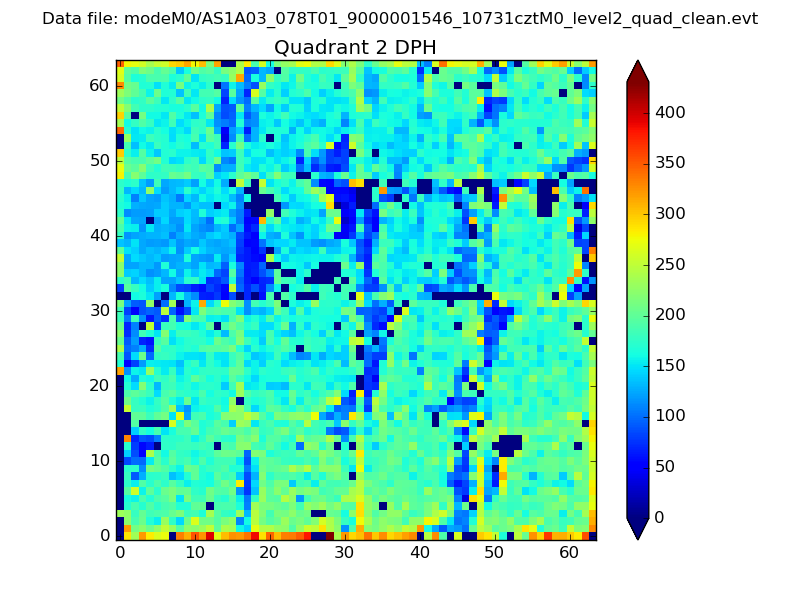
Histogram calculated using DETX and DETY for each event in the final _common_clean file
| Quadrant A | 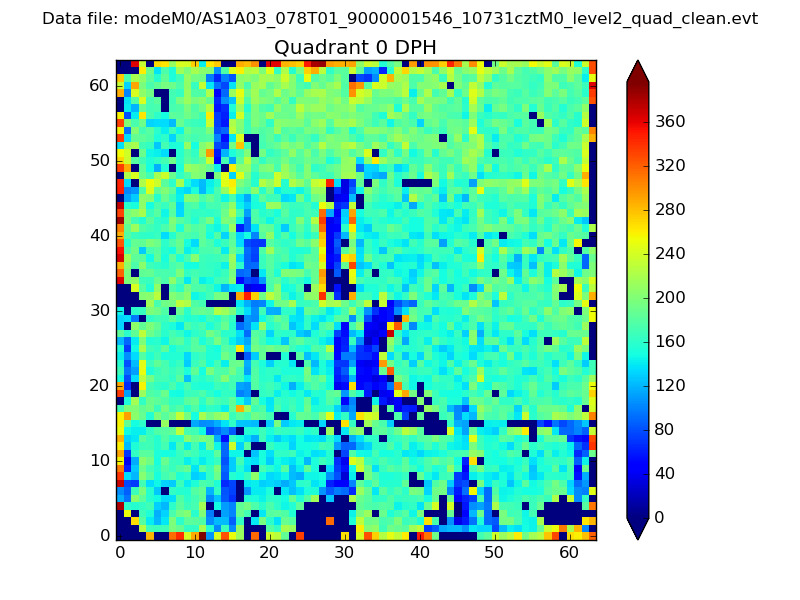 |
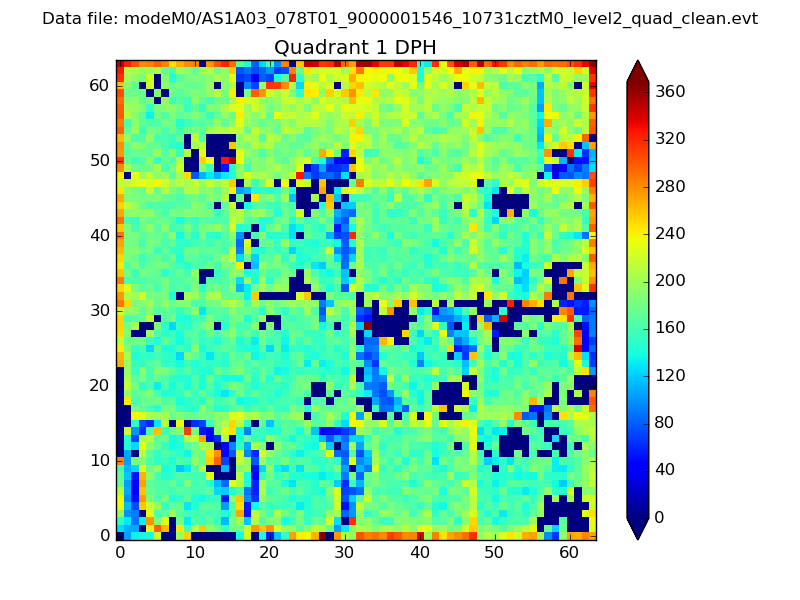 |
Quadrant B |
|---|---|---|---|
| Quadrant D | 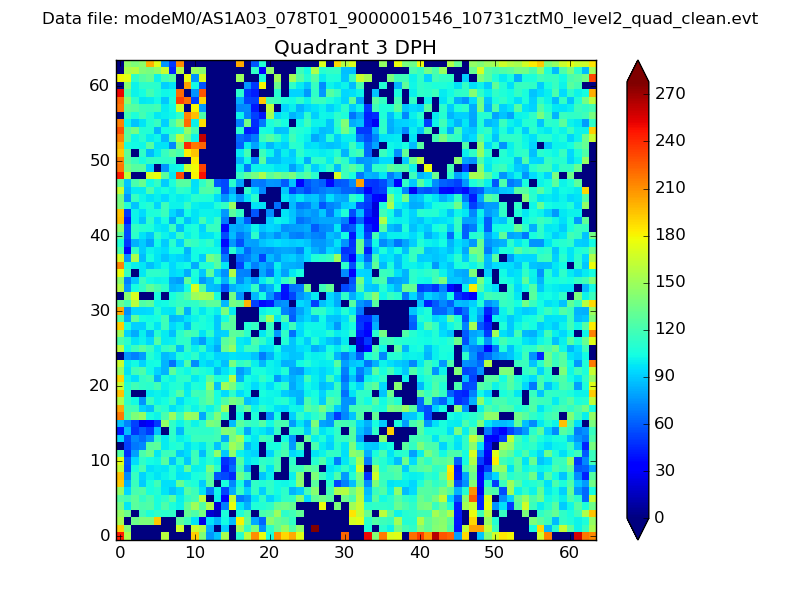 |
 |
Quadrant C |
| Plot type | Count rate plots | Images |
|---|---|---|
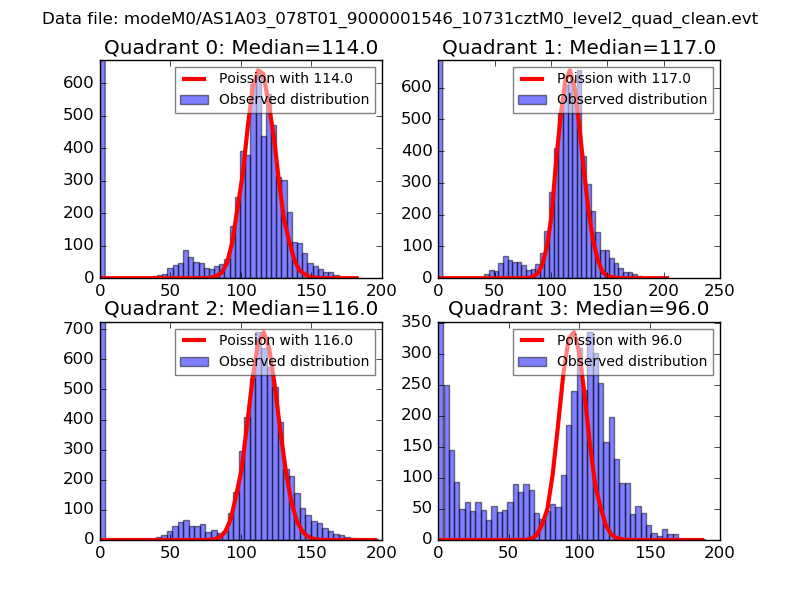
| Comparison with Poisson distribution Blue bars denote a histogram of data divided into 1 sec bins. Red curve is a Poisson curve with rate = median count rate of data. |
 |
 |
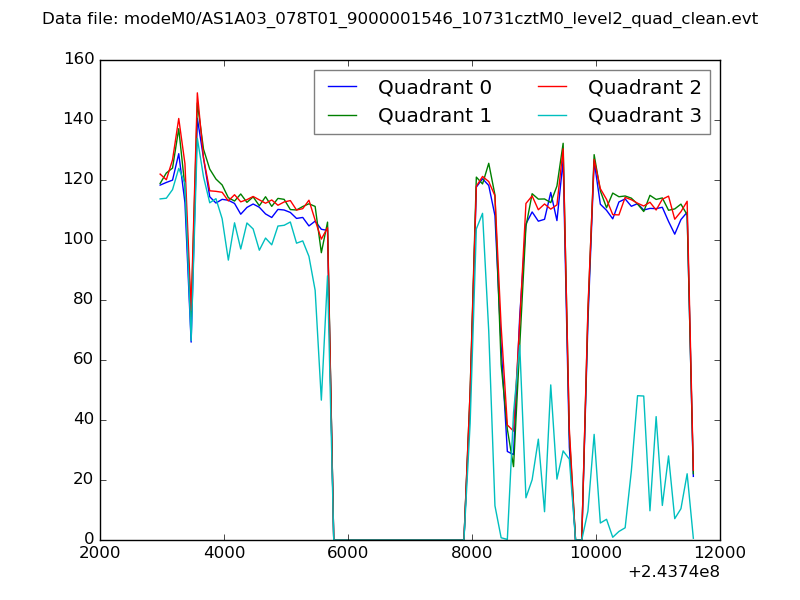
| Quadrant-wise count rates Data is divided into 100 sec bins |
 |
|
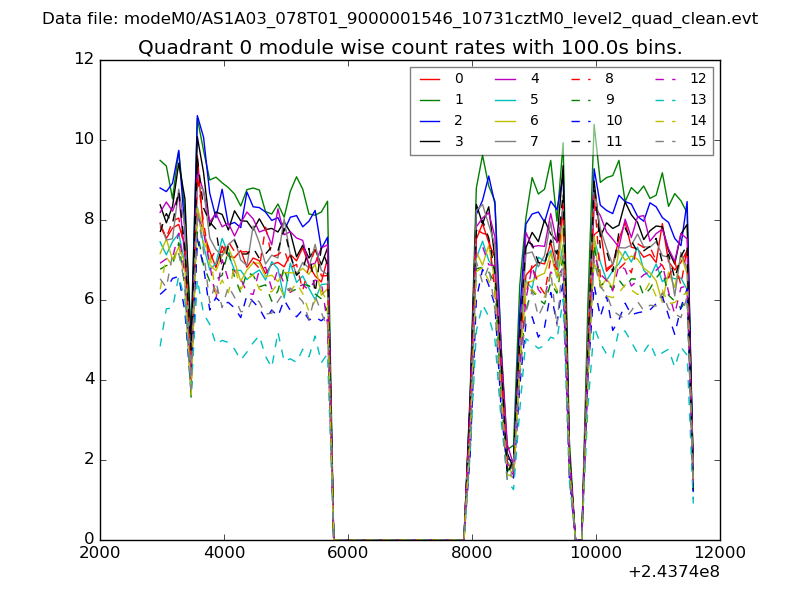
| Module-wise count rates for Quadrant A Data is divided into 100 sec bins |
 |
 |
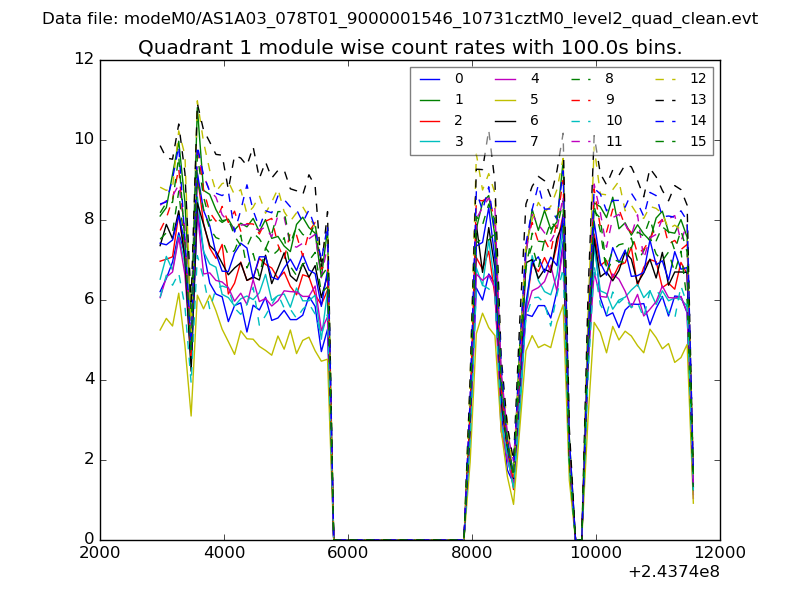
| Module-wise count rates for Quadrant B Data is divided into 100 sec bins |
 |
 |
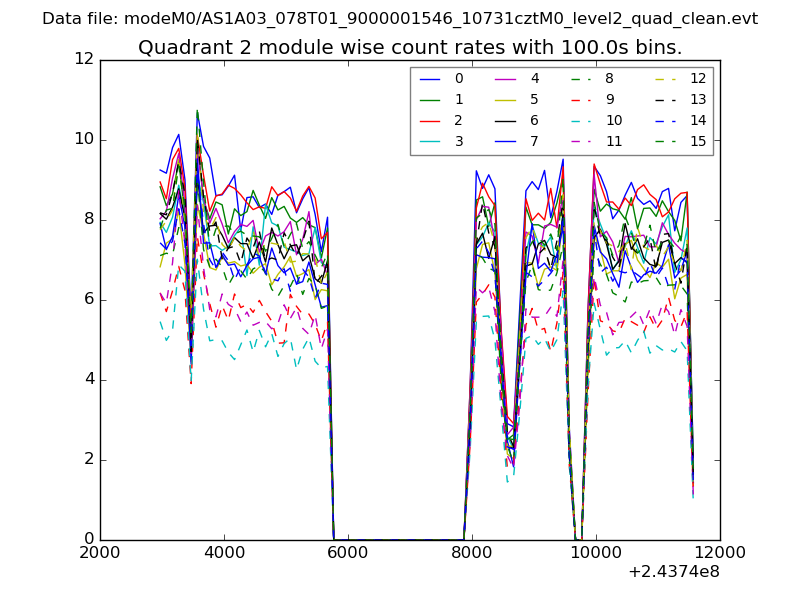
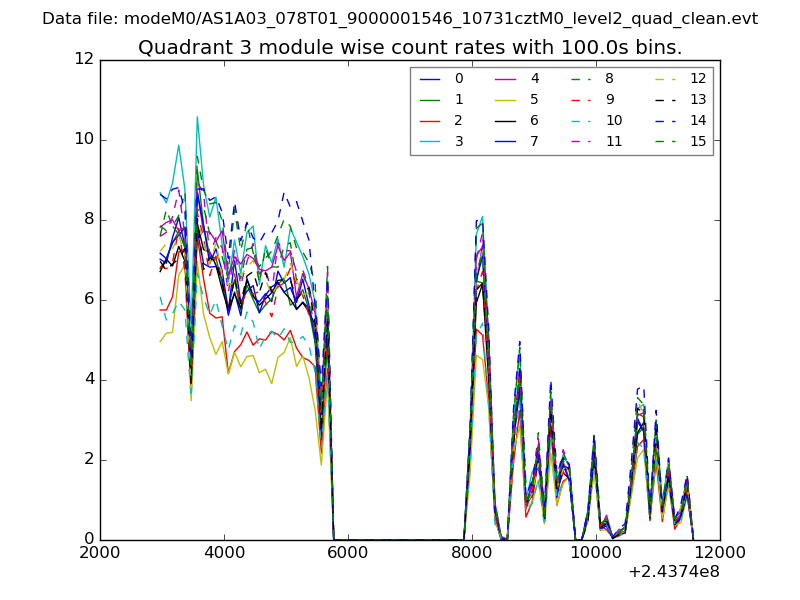
| Module-wise count rates for Quadrant C Data is divided into 100 sec bins |
 |
 |
| Module-wise count rates for Quadrant D Data is divided into 100 sec bins |
 |
 |
| Parameter | Plot |
|---|---|
| CZT HV Monitor | 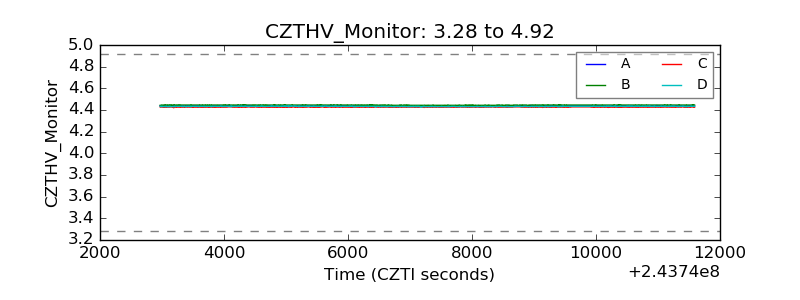 |
| D_VDD | 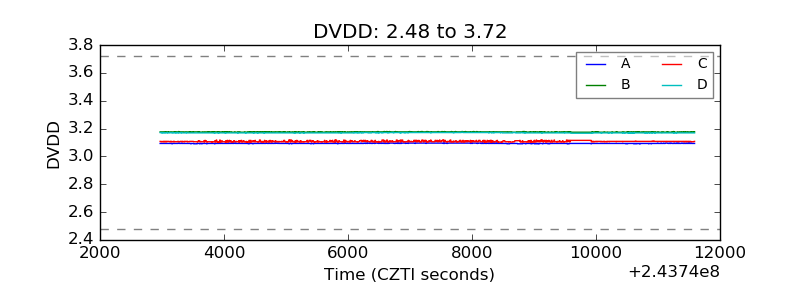 |
| Temperature 1 | 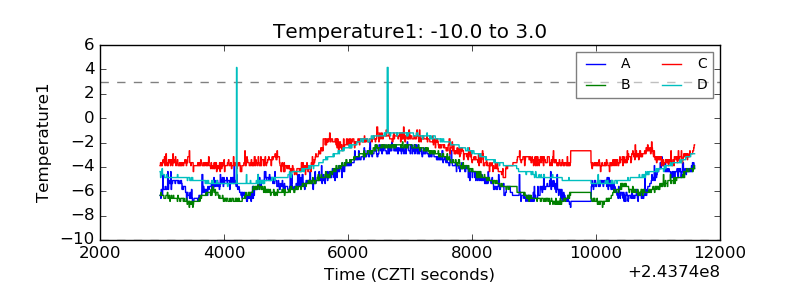 |
| Veto HV Monitor | 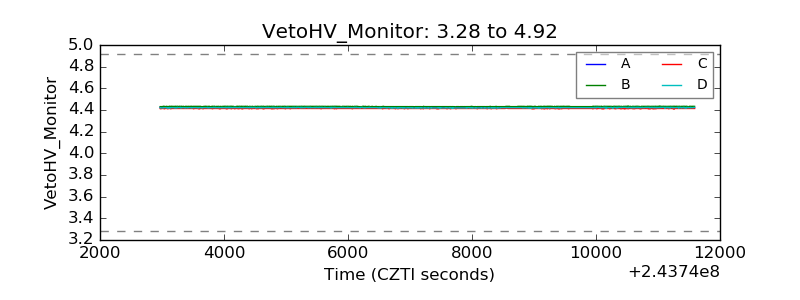 |
| Veto LLD | 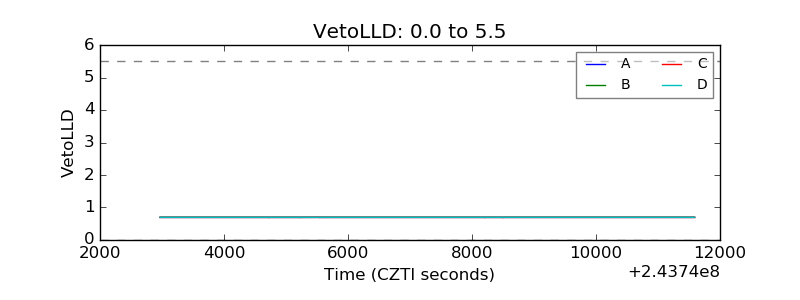 |
| Alpha Counter | 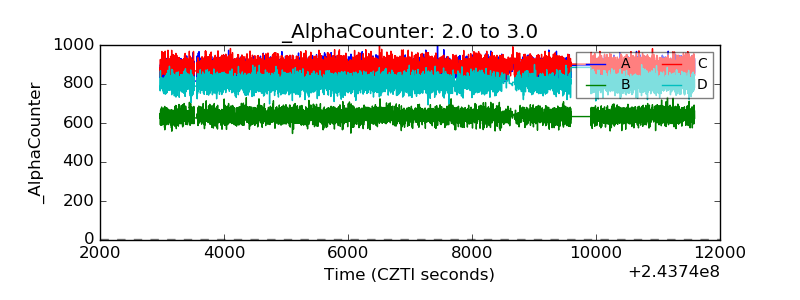 |
| _CPM_Rate | 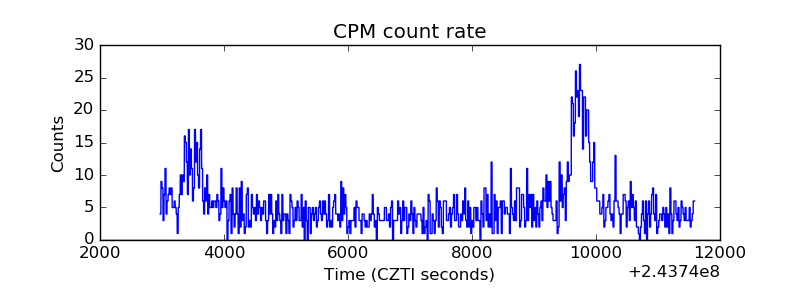 |
| CZT Counter | 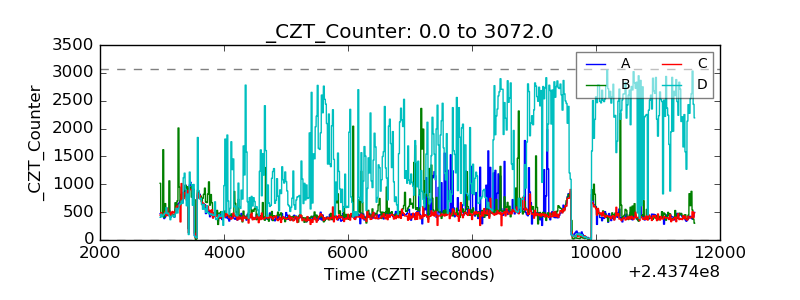 |
| +2.5 Volts monitor |  |
| +5 Volts monitor | 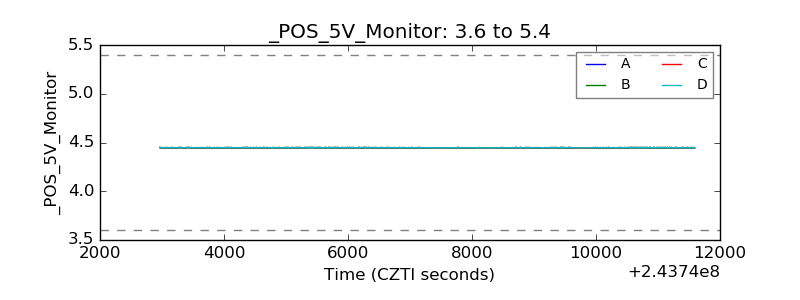 |
| _ROLL_ROT | 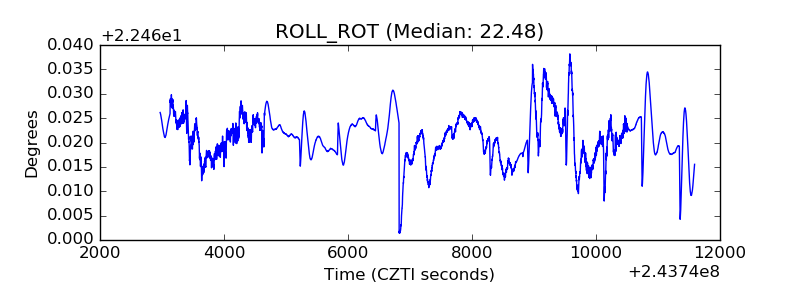 |
| _Roll_DEC | 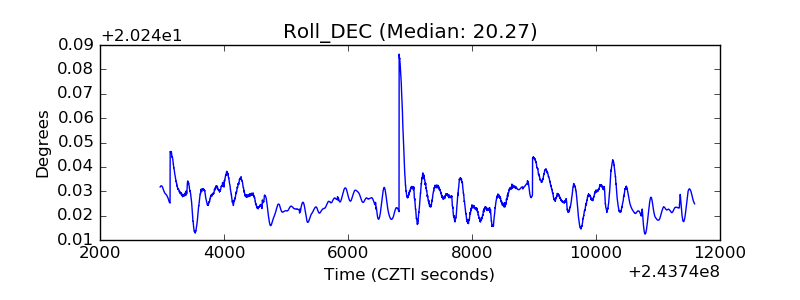 |
| _Roll_RA | 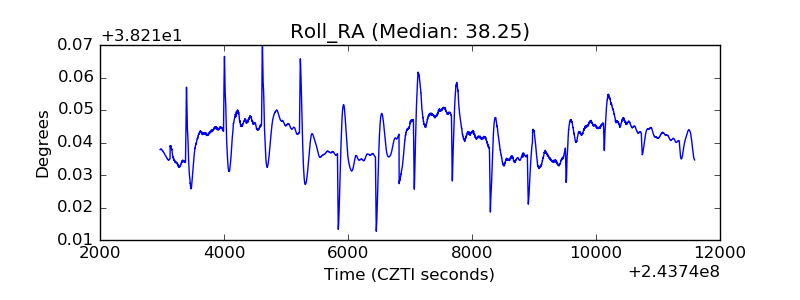 |
| Veto Counter | 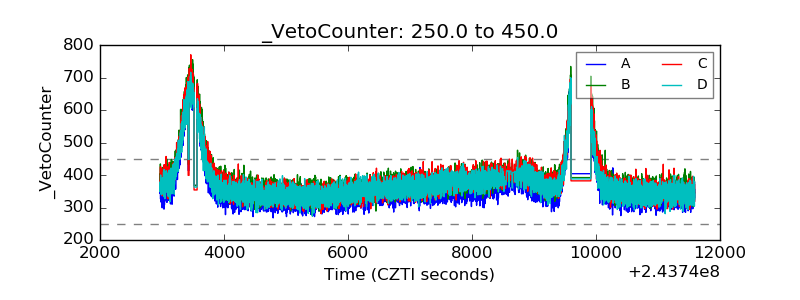 |