| Param | Original file | Final file |
|---|---|---|
| Filename | modeM0/AS1A03_078T01_9000001546_10734cztM0_level2.evt | modeM0/AS1A03_078T01_9000001546_10734cztM0_level2_quad_clean.evt |
| Size (bytes) | 529,099,200 | 67,066,560 |
| Size | 504.6 MB | 64.0 MB |
| Events in quadrant A | 5,329,653 | 388,227 |
| Events in quadrant B | 4,024,708 | 399,768 |
| Events in quadrant C | 2,997,973 | 396,781 |
| Events in quadrant D | 3,218,570 | 379,918 |
| Mode M0 | |||
|---|---|---|---|
| Quadrant | BADHDUFLAG | Total packets | Discarded packets |
| A | 0 | 20155 | 4 |
| B | 0 | 16210 | 1 |
| C | 0 | 13536 | 3 |
| D | 0 | 14162 | 1 |
| Mode SS | |||
|---|---|---|---|
| Quadrant | BADHDUFLAG | Total packets | Discarded packets |
| A | 0 | 138 | 0 |
| B | 0 | 138 | 0 |
| C | 0 | 138 | 0 |
| D | 0 | 138 | 0 |
| Mode M9 | |||
|---|---|---|---|
| Quadrant | BADHDUFLAG | Total packets | Discarded packets |
| A | 0 | 8 | 0 |
| B | 0 | 8 | 0 |
| C | 0 | 8 | 0 |
| D | 0 | 8 | 0 |
| Quadrant | Total seconds | Saturated seconds | Saturation percentage |
|---|---|---|---|
| A | 6672 | 230 | 3.447242% |
| B | 6673 | 270 | 4.046156% |
| C | 6672 | 51 | 0.764388% |
| D | 6673 | 85 | 1.273790% |
Noise dominated data is calculated using 1-second bins in cleaned event files. If a bin has >2000 counts, and if more than 50% of those come from <1% of pixels, then it is considered to be noise-dominated and hence unusable.
| Quadrant | # 1 sec bins | Bins with >0 counts | Bins with >2000 counts | High rate bins dominated by noise | Noise dominated (total time) | Noise dominated (detector-on time) | Marked lightcurve |
|---|---|---|---|---|---|---|---|
| A | 7528 | 6673 | 26 | 26 | 0.35% | 0.39% | 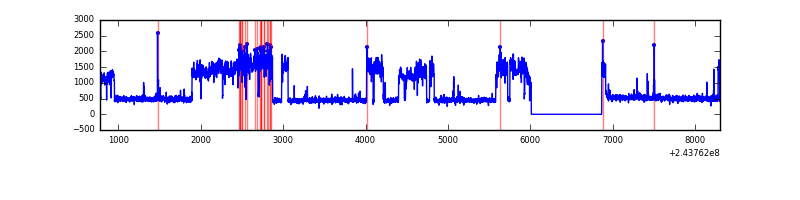 |
| B | 7528 | 6673 | 110 | 110 | 1.46% | 1.65% | 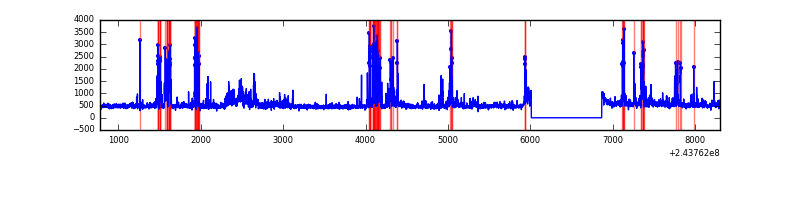 |
| C | 7528 | 6673 | 1 | 1 | 0.01% | 0.01% | 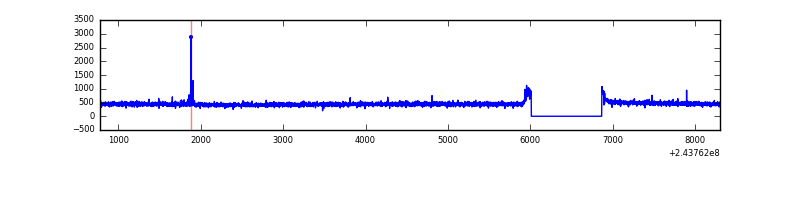 |
| D | 7528 | 6673 | 25 | 25 | 0.33% | 0.37% | 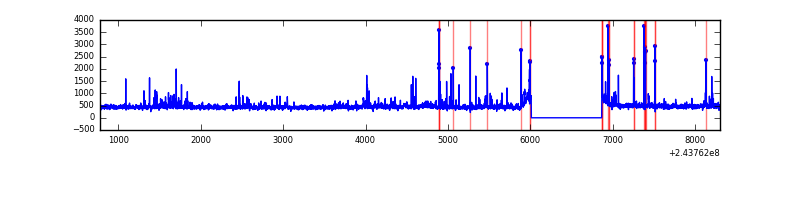 |
Top three noisy pixels from each quadrant. If the there are fewer than three noisy pixels in the level2.evt file, extra rows are filled as -1
| Pixel properties | Quadrant properties | ||||||
|---|---|---|---|---|---|---|---|
| Quadrant | DetID | PixID | Counts | Sigma | Mean | Median | Sigma |
| A | 15 | 239 | 2184585 | 13636.26 | 785 | 765 | 160.1 |
| A | 14 | 254 | 47194 | 289.91 | 785 | 765 | 160.1 |
| A | 1 | 162 | 19799 | 118.85 | 785 | 765 | 160.1 |
| B | 4 | 239 | 747664 | 4890.15 | 785 | 766 | 152.7 |
| B | 0 | 219 | 79347 | 514.49 | 785 | 766 | 152.7 |
| B | 0 | 214 | 50386 | 324.88 | 785 | 766 | 152.7 |
| C | 14 | 234 | 15117 | 80.0 | 765 | 768 | 179.4 |
| C | 13 | 61 | 5558 | 26.7 | 765 | 768 | 179.4 |
| C | 3 | 202 | 1974 | 6.72 | 765 | 768 | 179.4 |
| D | 4 | 95 | 53903 | 288.76 | 762 | 739 | 184.1 |
| D | 13 | 249 | 51933 | 278.06 | 762 | 739 | 184.1 |
| D | 10 | 172 | 49917 | 267.11 | 762 | 739 | 184.1 |
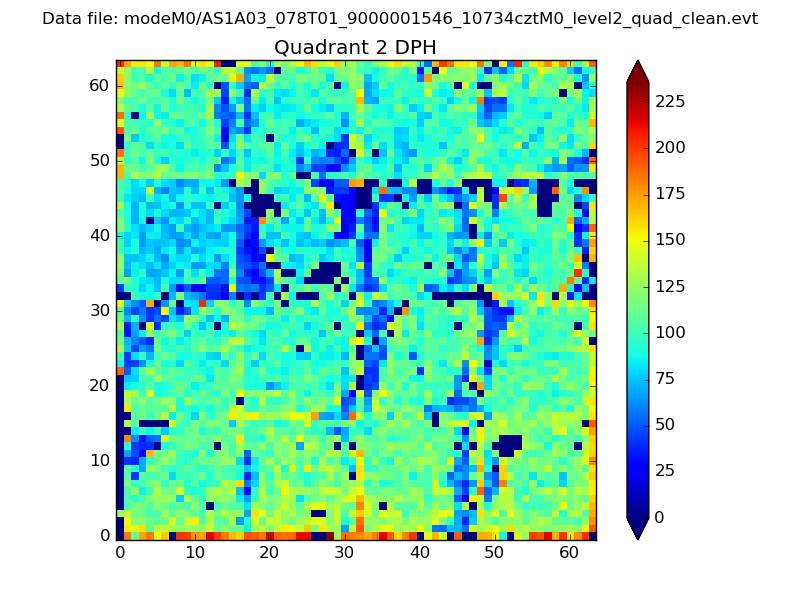
Histogram calculated using DETX and DETY for each event in the final _common_clean file
| Quadrant A | 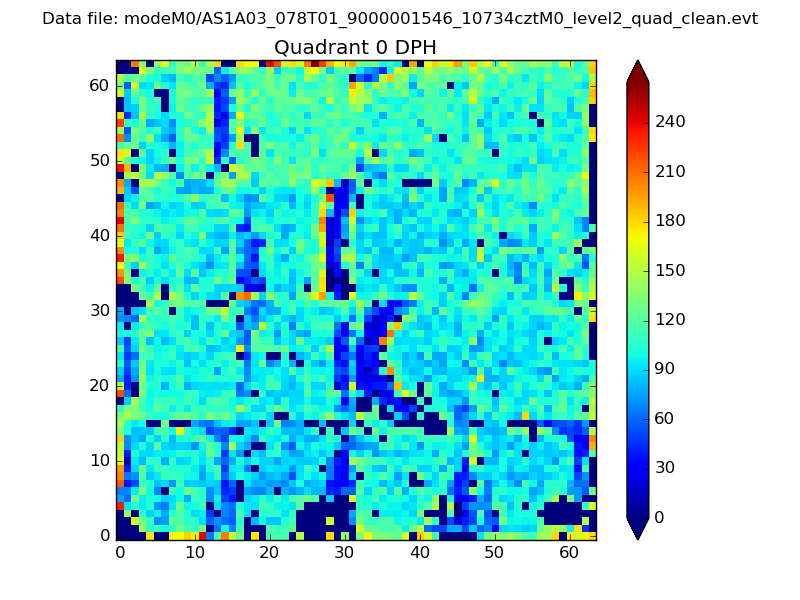 |
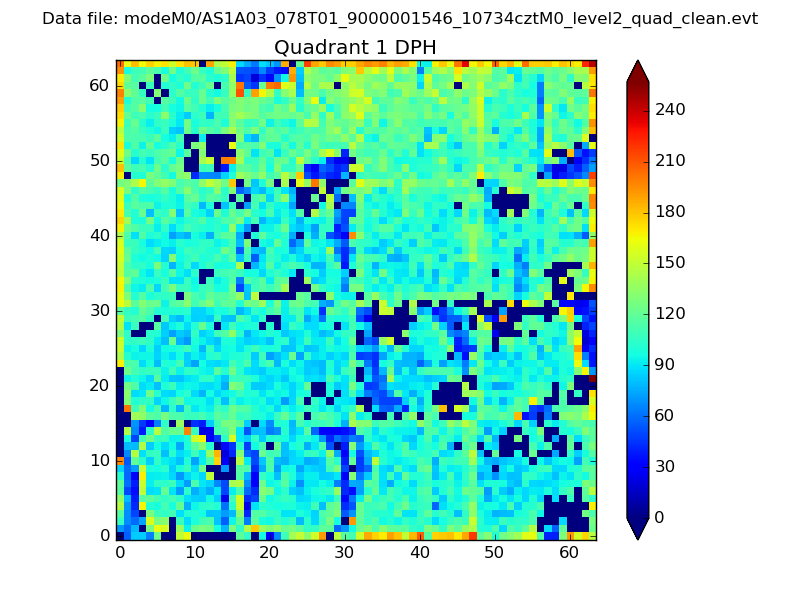 |
Quadrant B |
|---|---|---|---|
| Quadrant D | 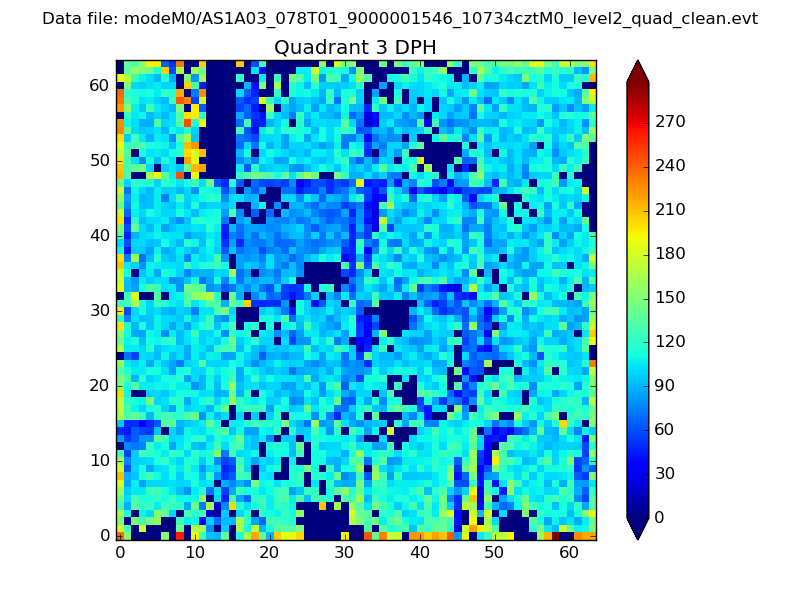 |
 |
Quadrant C |
| Plot type | Count rate plots | Images |
|---|---|---|
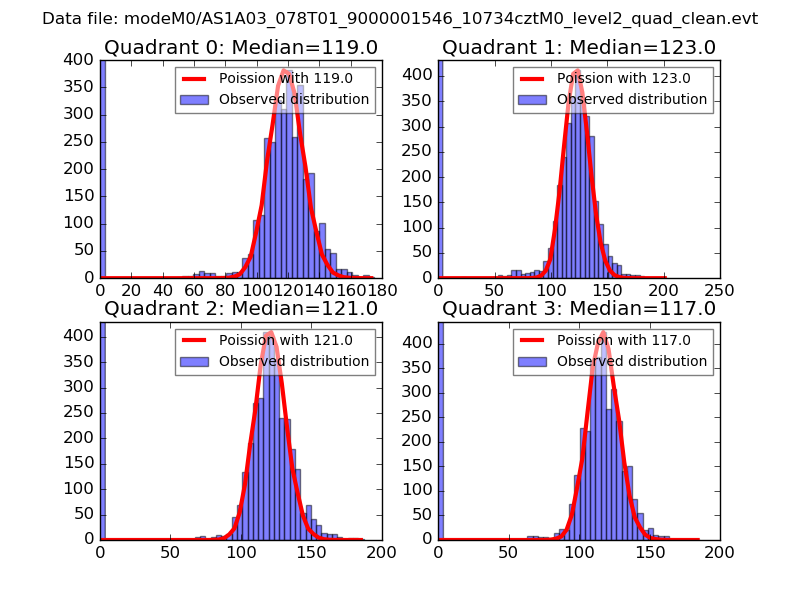
| Comparison with Poisson distribution Blue bars denote a histogram of data divided into 1 sec bins. Red curve is a Poisson curve with rate = median count rate of data. |
 |
 |
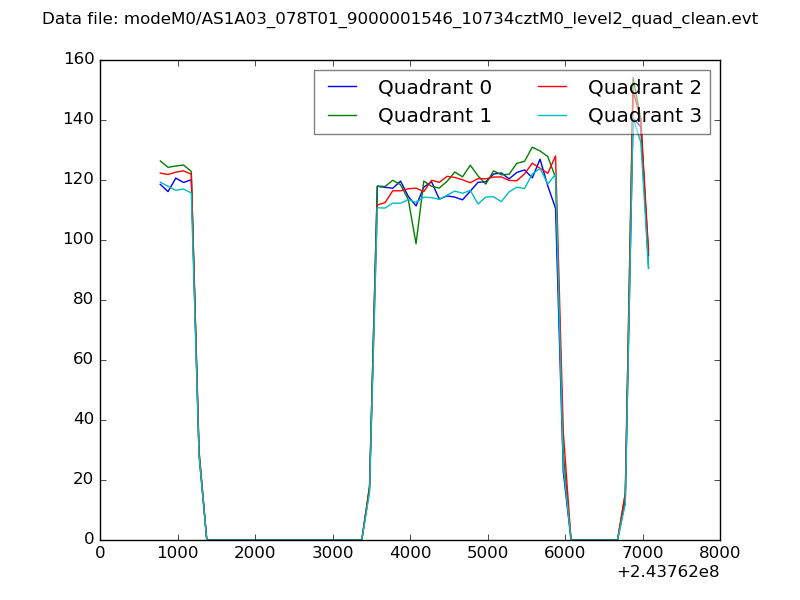
| Quadrant-wise count rates Data is divided into 100 sec bins |
 |
|
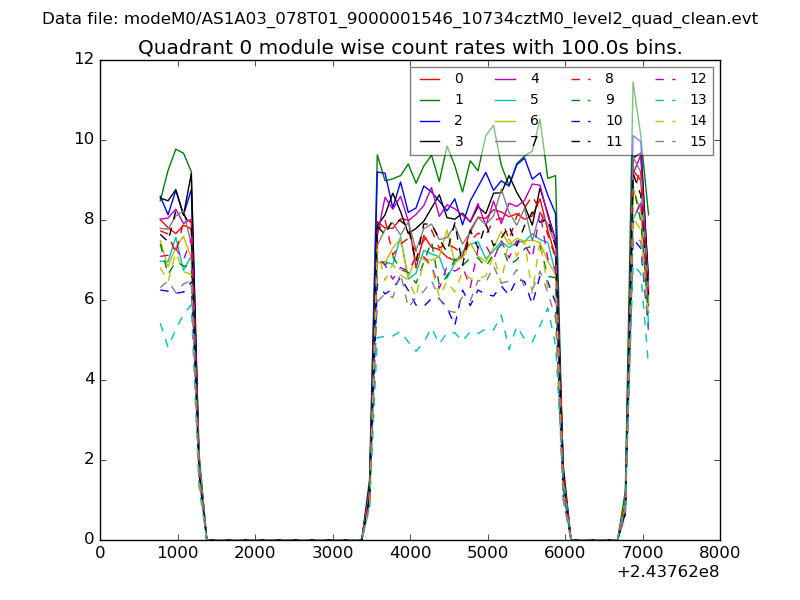
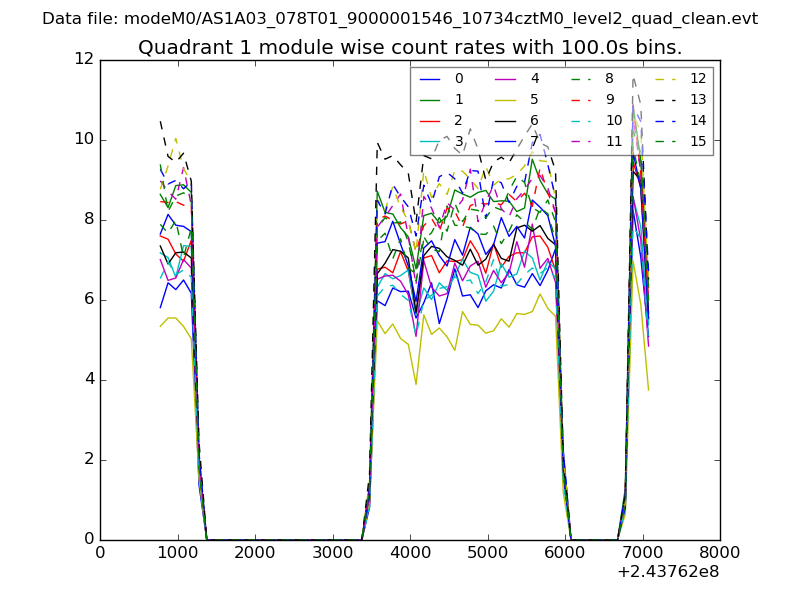
| Module-wise count rates for Quadrant A Data is divided into 100 sec bins |
 |
 |
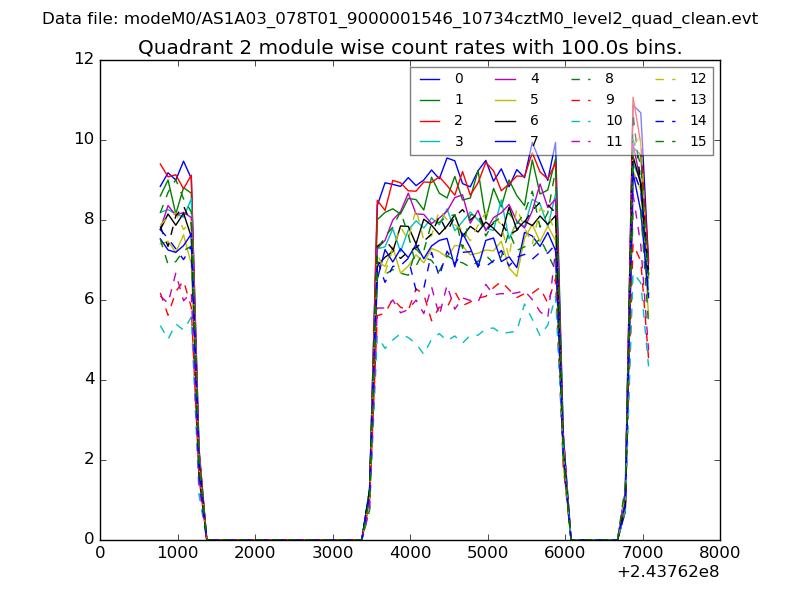
| Module-wise count rates for Quadrant B Data is divided into 100 sec bins |
 |
 |
| Module-wise count rates for Quadrant C Data is divided into 100 sec bins |
 |
 |
| Module-wise count rates for Quadrant D Data is divided into 100 sec bins |
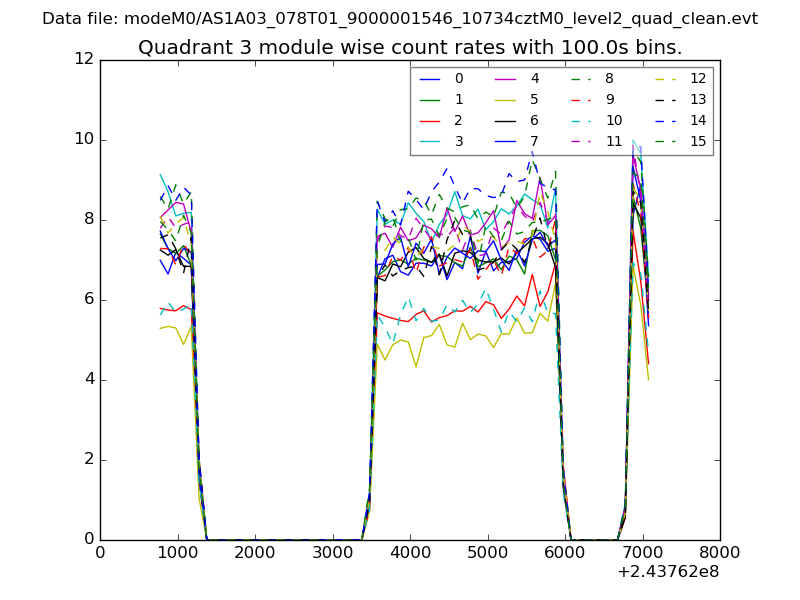 |
 |
| Parameter | Plot |
|---|---|
| CZT HV Monitor | 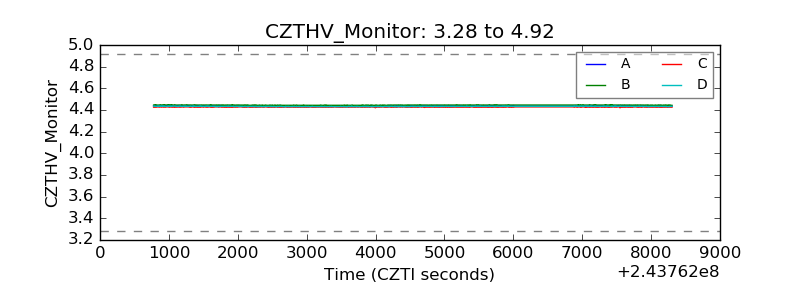 |
| D_VDD | 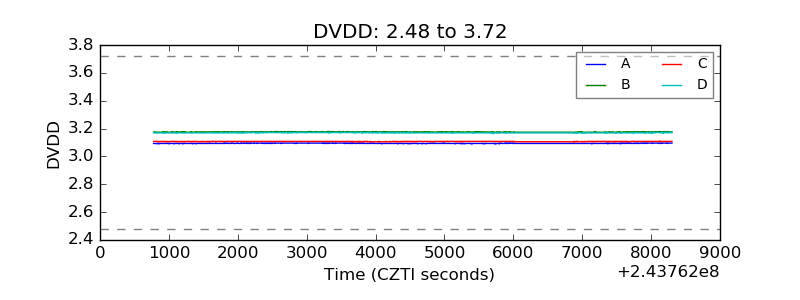 |
| Temperature 1 | 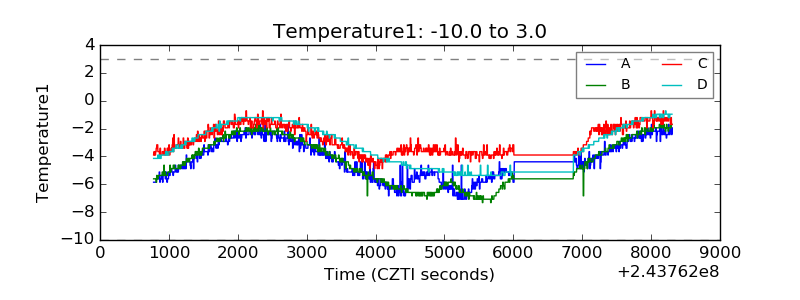 |
| Veto HV Monitor | 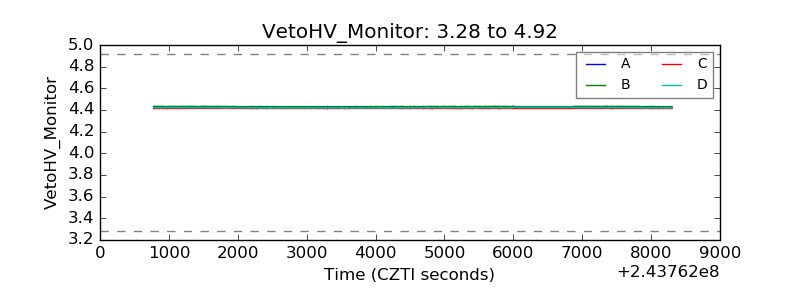 |
| Veto LLD | 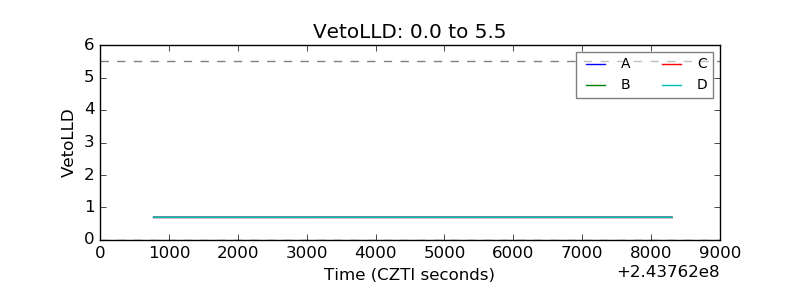 |
| Alpha Counter | 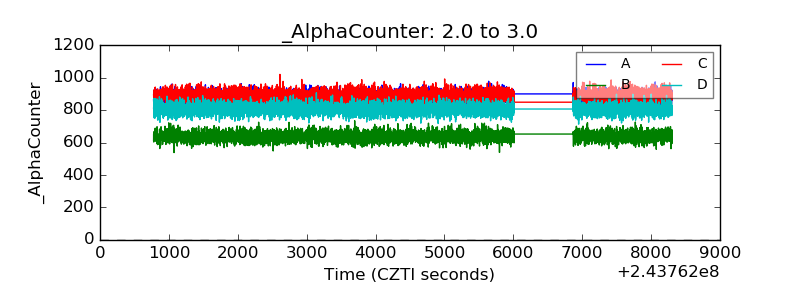 |
| _CPM_Rate | 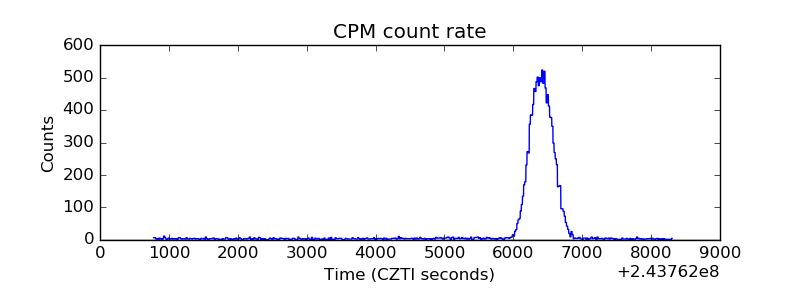 |
| CZT Counter | 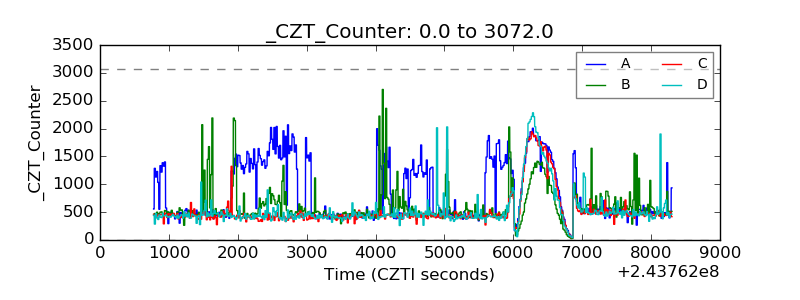 |
| +2.5 Volts monitor |  |
| +5 Volts monitor | 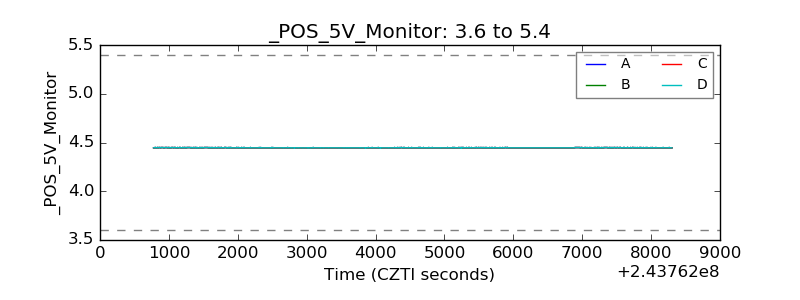 |
| _ROLL_ROT | 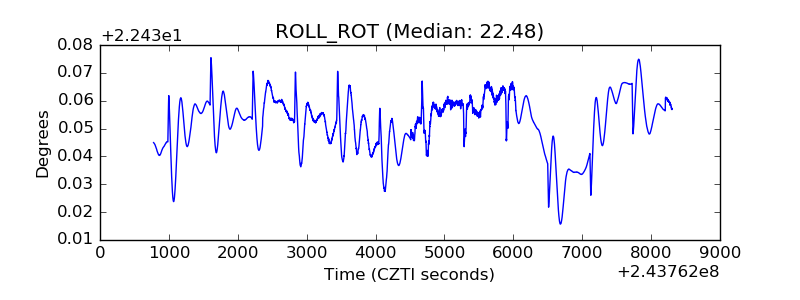 |
| _Roll_DEC | 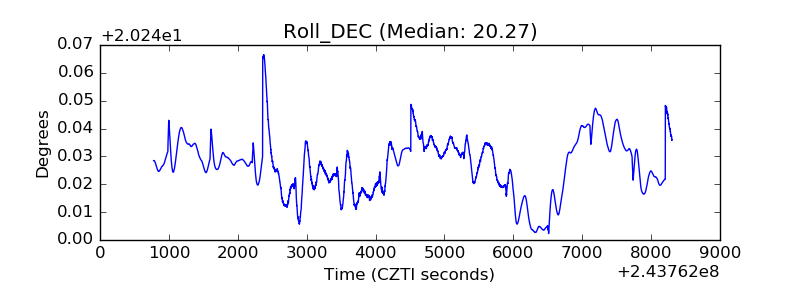 |
| _Roll_RA | 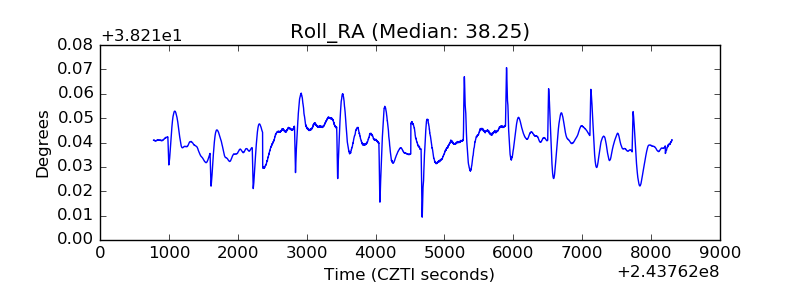 |
| Veto Counter | 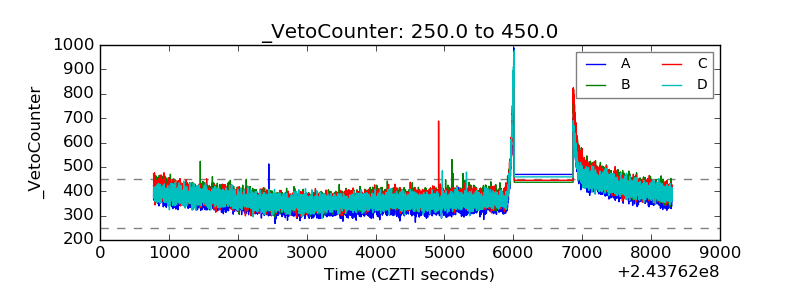 |