| Param | Original file | Final file |
|---|---|---|
| Filename | modeM0/AS1A03_078T01_9000001546_10735cztM0_level2.evt | modeM0/AS1A03_078T01_9000001546_10735cztM0_level2_quad_clean.evt |
| Size (bytes) | 619,611,840 | 62,481,600 |
| Size | 590.9 MB | 59.6 MB |
| Events in quadrant A | 4,741,297 | 367,392 |
| Events in quadrant B | 4,393,901 | 368,890 |
| Events in quadrant C | 3,188,059 | 371,118 |
| Events in quadrant D | 5,985,398 | 313,942 |
| Mode M0 | |||
|---|---|---|---|
| Quadrant | BADHDUFLAG | Total packets | Discarded packets |
| A | 0 | 18433 | 3 |
| B | 0 | 17449 | 2 |
| C | 0 | 14019 | 2 |
| D | 0 | 22164 | 2 |
| Mode SS | |||
|---|---|---|---|
| Quadrant | BADHDUFLAG | Total packets | Discarded packets |
| A | 0 | 138 | 0 |
| B | 0 | 138 | 0 |
| C | 0 | 138 | 0 |
| D | 0 | 138 | 0 |
| Mode M9 | |||
|---|---|---|---|
| Quadrant | BADHDUFLAG | Total packets | Discarded packets |
| A | 0 | 15 | 0 |
| B | 0 | 15 | 0 |
| C | 0 | 15 | 0 |
| D | 0 | 16 | 0 |
| Quadrant | Total seconds | Saturated seconds | Saturation percentage |
|---|---|---|---|
| A | 6736 | 303 | 4.498219% |
| B | 6736 | 278 | 4.127078% |
| C | 6736 | 65 | 0.964964% |
| D | 6736 | 853 | 12.663302% |
Noise dominated data is calculated using 1-second bins in cleaned event files. If a bin has >2000 counts, and if more than 50% of those come from <1% of pixels, then it is considered to be noise-dominated and hence unusable.
| Quadrant | # 1 sec bins | Bins with >0 counts | Bins with >2000 counts | High rate bins dominated by noise | Noise dominated (total time) | Noise dominated (detector-on time) | Marked lightcurve |
|---|---|---|---|---|---|---|---|
| A | 7756 | 6736 | 149 | 149 | 1.92% | 2.21% | 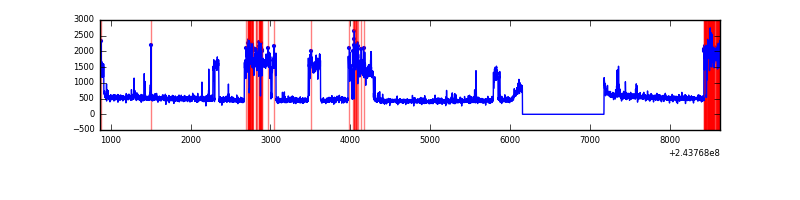 |
| B | 7756 | 6736 | 120 | 120 | 1.55% | 1.78% | 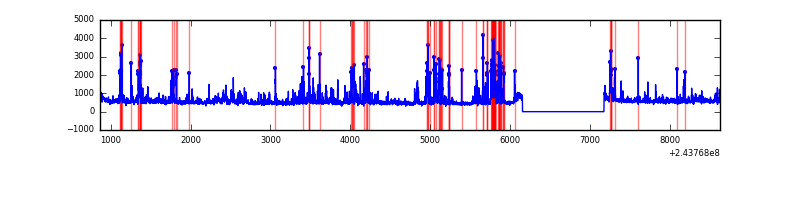 |
| C | 7756 | 6736 | 4 | 4 | 0.05% | 0.06% | 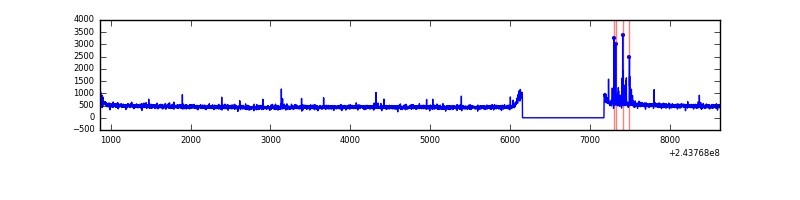 |
| D | 7756 | 6736 | 742 | 742 | 9.57% | 11.02% | 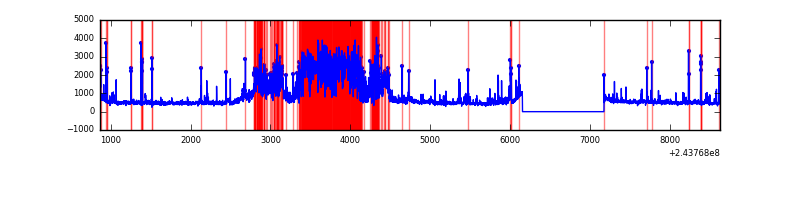 |
Top three noisy pixels from each quadrant. If the there are fewer than three noisy pixels in the level2.evt file, extra rows are filled as -1
| Pixel properties | Quadrant properties | ||||||
|---|---|---|---|---|---|---|---|
| Quadrant | DetID | PixID | Counts | Sigma | Mean | Median | Sigma |
| A | 15 | 239 | 1467338 | 8728.81 | 824 | 805 | 168.0 |
| A | 14 | 254 | 44965 | 262.84 | 824 | 805 | 168.0 |
| A | 13 | 251 | 22739 | 130.55 | 824 | 805 | 168.0 |
| B | 4 | 239 | 940696 | 5935.88 | 821 | 801 | 158.3 |
| B | 15 | 204 | 87705 | 548.84 | 821 | 801 | 158.3 |
| B | 0 | 219 | 72865 | 455.12 | 821 | 801 | 158.3 |
| C | 14 | 234 | 59384 | 310.17 | 802 | 805 | 188.9 |
| C | 13 | 61 | 5797 | 26.43 | 802 | 805 | 188.9 |
| C | 3 | 202 | 2099 | 6.85 | 802 | 805 | 188.9 |
| D | 2 | 16 | 2665567 | 14426.09 | 766 | 745 | 184.7 |
| D | 10 | 172 | 114098 | 613.64 | 766 | 745 | 184.7 |
| D | 13 | 249 | 62683 | 335.3 | 766 | 745 | 184.7 |
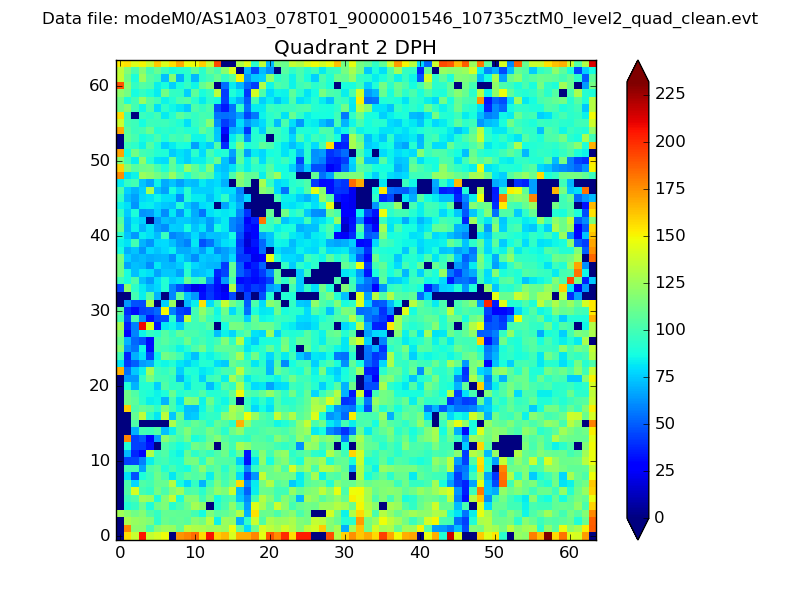
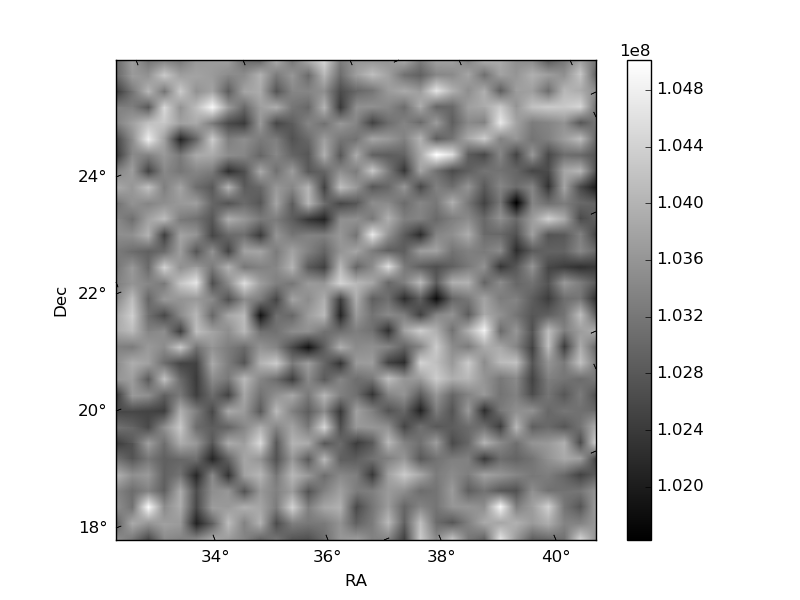
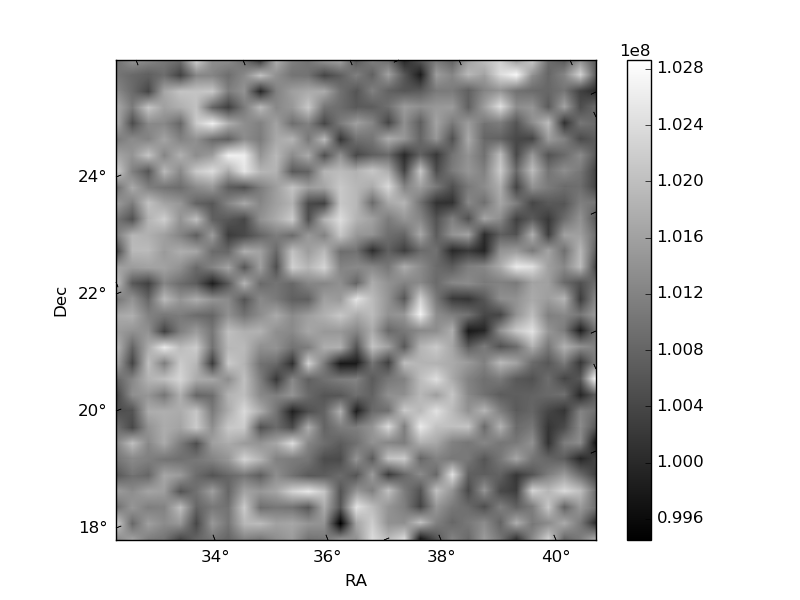
Histogram calculated using DETX and DETY for each event in the final _common_clean file
| Quadrant A | 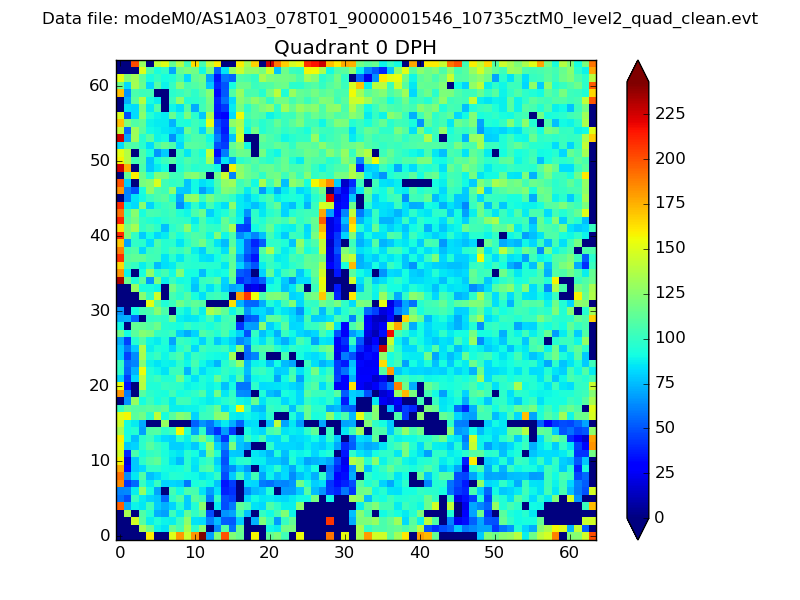 |
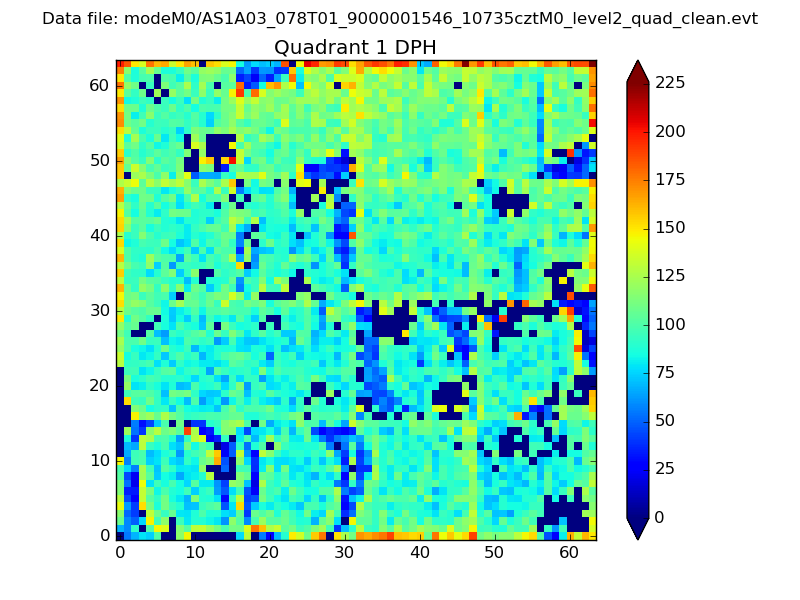 |
Quadrant B |
|---|---|---|---|
| Quadrant D | 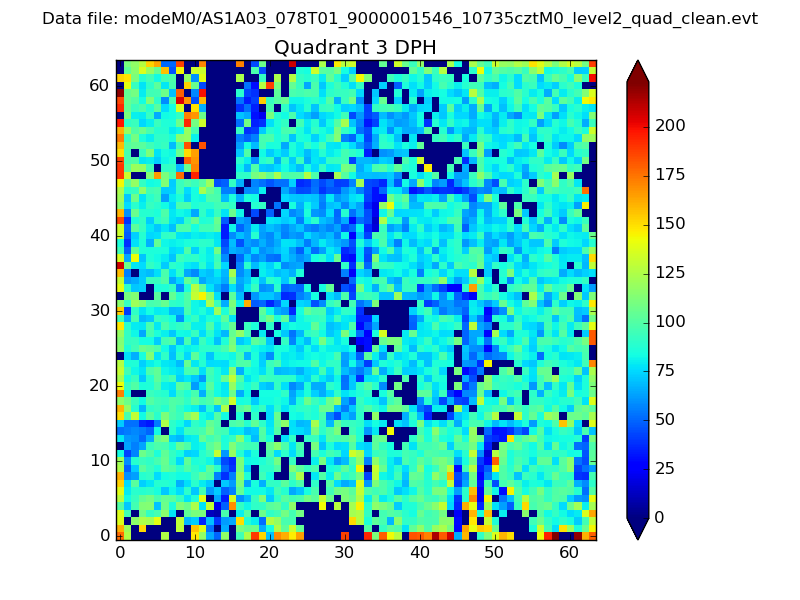 |
 |
Quadrant C |
| Plot type | Count rate plots | Images |
|---|---|---|
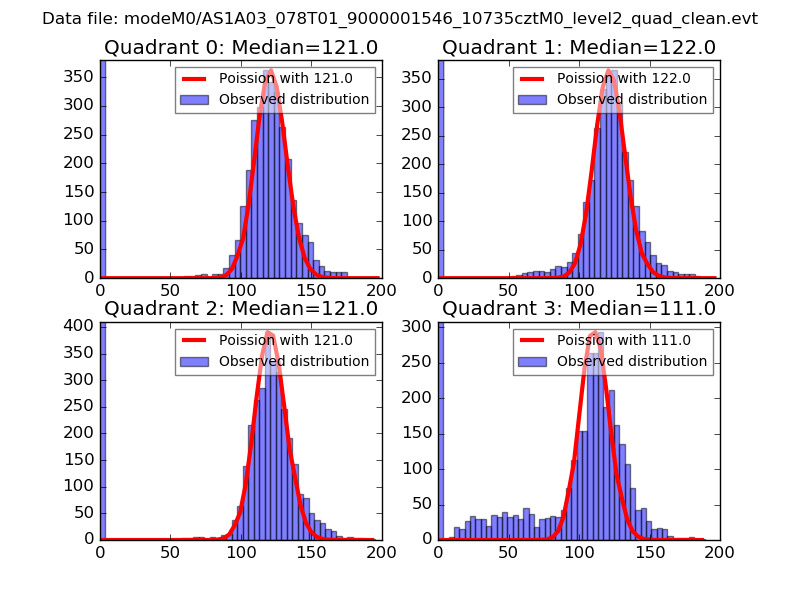
| Comparison with Poisson distribution Blue bars denote a histogram of data divided into 1 sec bins. Red curve is a Poisson curve with rate = median count rate of data. |
 |
 |
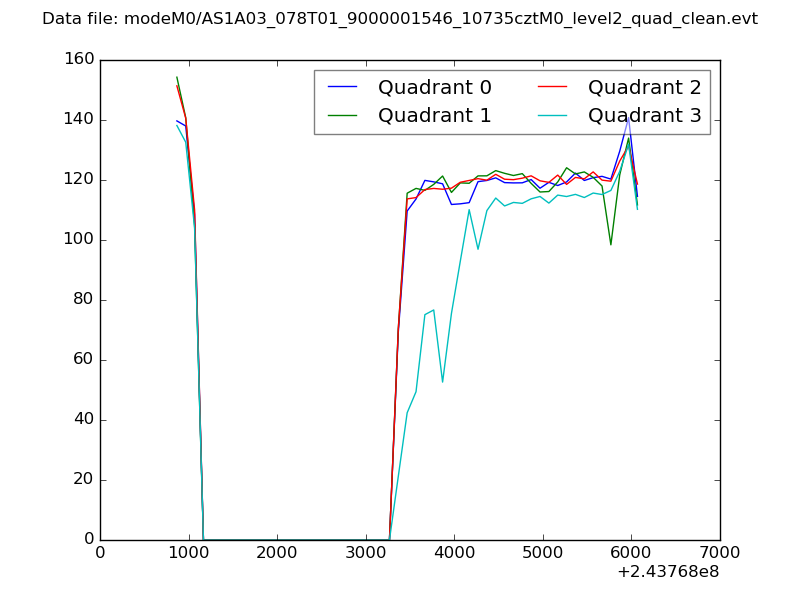
| Quadrant-wise count rates Data is divided into 100 sec bins |
 |
|
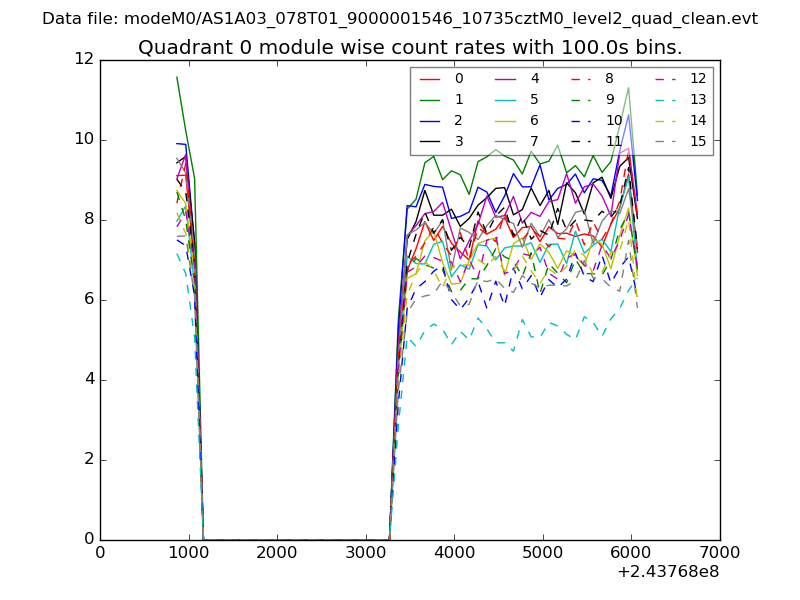
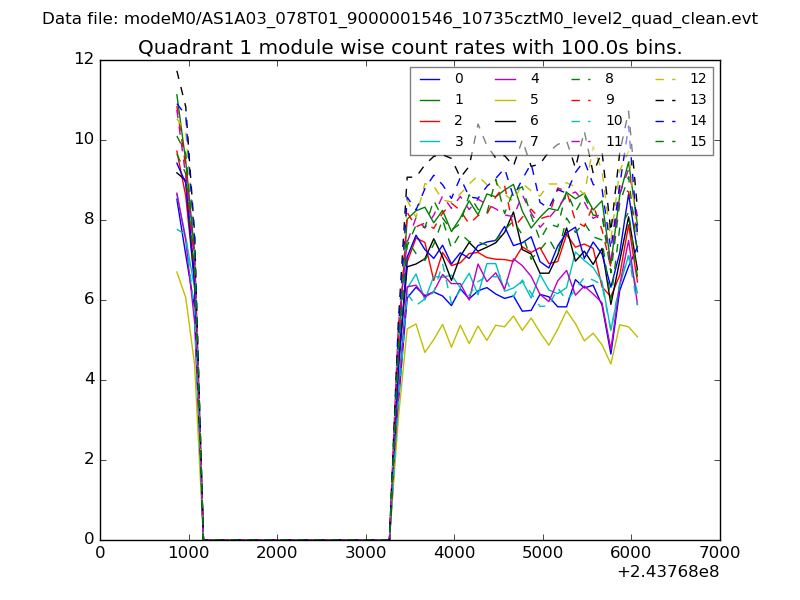
| Module-wise count rates for Quadrant A Data is divided into 100 sec bins |
 |
 |
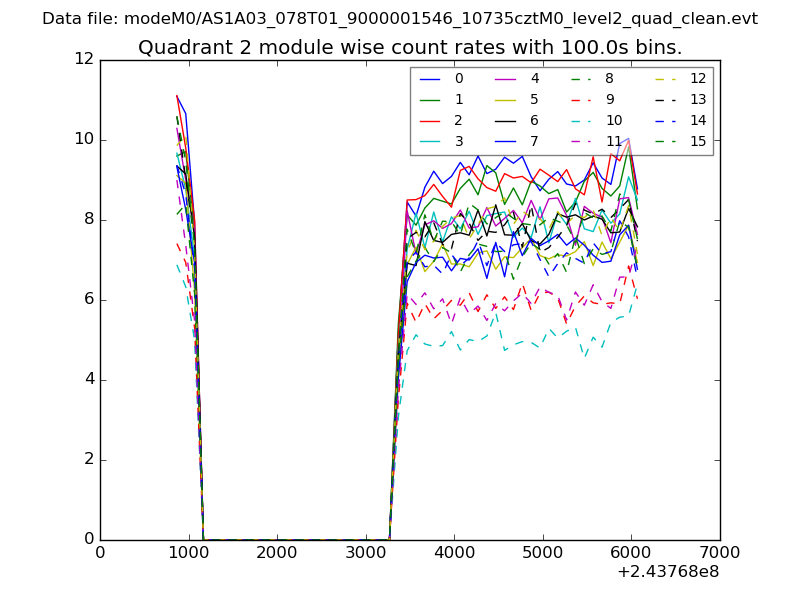
| Module-wise count rates for Quadrant B Data is divided into 100 sec bins |
 |
 |
| Module-wise count rates for Quadrant C Data is divided into 100 sec bins |
 |
 |
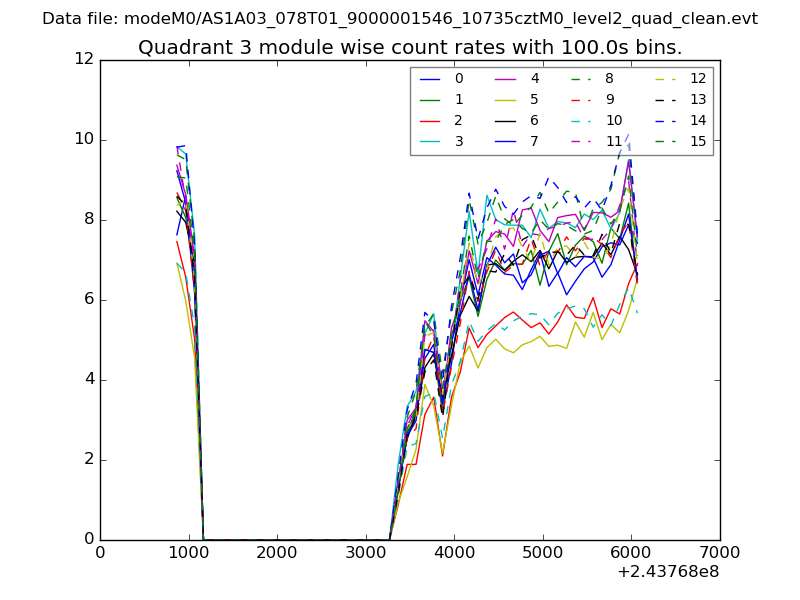
| Module-wise count rates for Quadrant D Data is divided into 100 sec bins |
 |
 |
| Parameter | Plot |
|---|---|
| CZT HV Monitor | 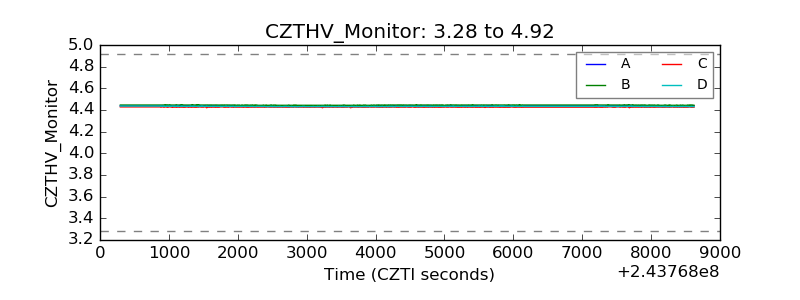 |
| D_VDD | 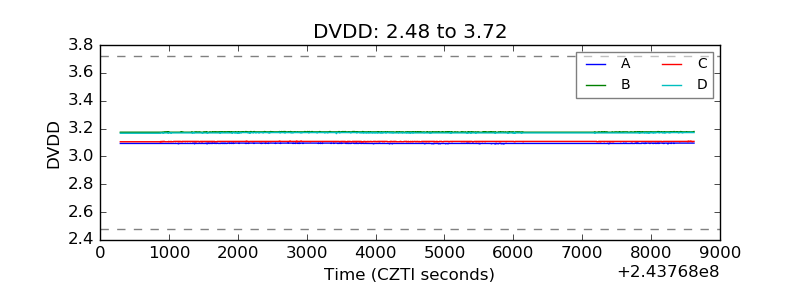 |
| Temperature 1 | 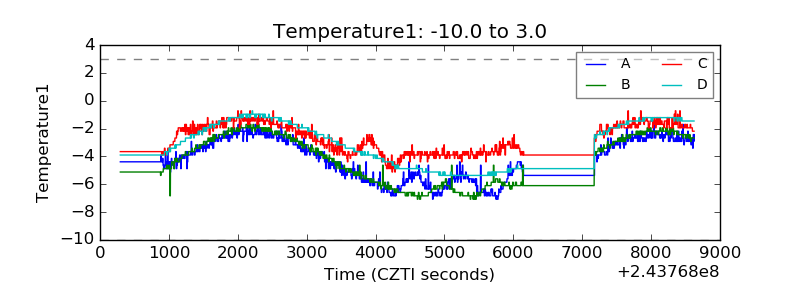 |
| Veto HV Monitor |  |
| Veto LLD | 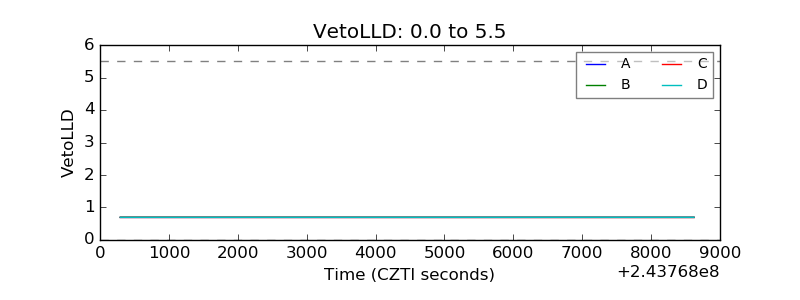 |
| Alpha Counter | 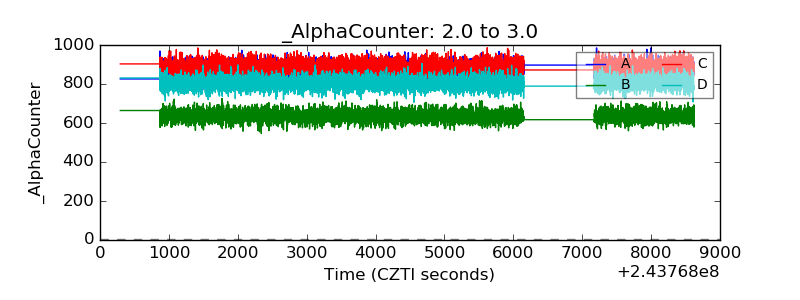 |
| _CPM_Rate | 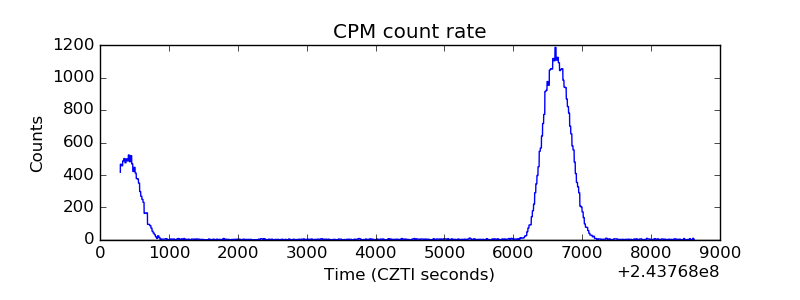 |
| CZT Counter | 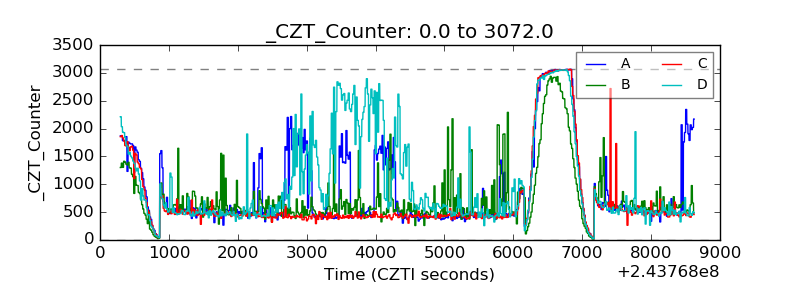 |
| +2.5 Volts monitor |  |
| +5 Volts monitor |  |
| _ROLL_ROT | 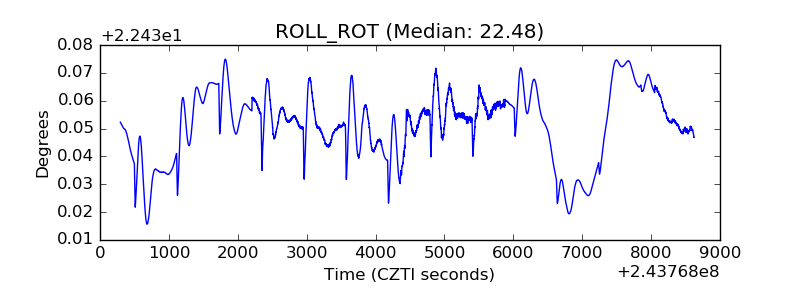 |
| _Roll_DEC | 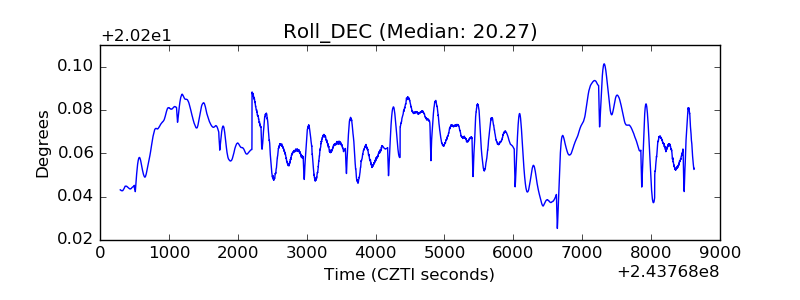 |
| _Roll_RA | 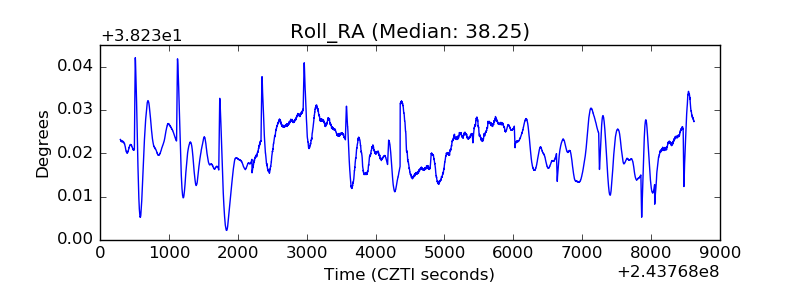 |
| Veto Counter | 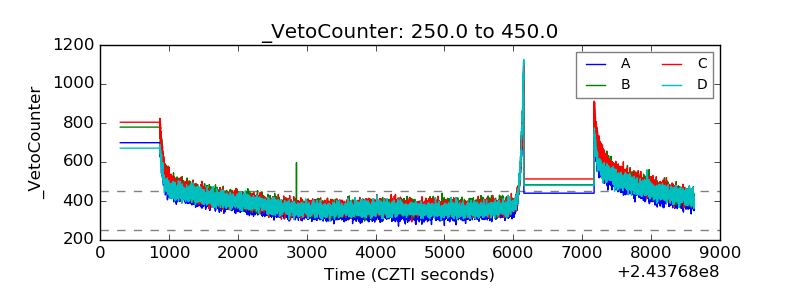 |