| Param | Original file | Final file |
|---|---|---|
| Filename | modeM0/AS1A03_078T01_9000001546_10737cztM0_level2.evt | modeM0/AS1A03_078T01_9000001546_10737cztM0_level2_quad_clean.evt |
| Size (bytes) | 581,086,080 | 63,414,720 |
| Size | 554.2 MB | 60.5 MB |
| Events in quadrant A | 5,597,302 | 369,914 |
| Events in quadrant B | 4,033,857 | 376,499 |
| Events in quadrant C | 3,193,326 | 375,017 |
| Events in quadrant D | 4,337,222 | 348,625 |
| Mode M0 | |||
|---|---|---|---|
| Quadrant | BADHDUFLAG | Total packets | Discarded packets |
| A | 0 | 20963 | 3 |
| B | 0 | 16293 | 2 |
| C | 0 | 13752 | 2 |
| D | 0 | 17243 | 2 |
| Mode SS | |||
|---|---|---|---|
| Quadrant | BADHDUFLAG | Total packets | Discarded packets |
| A | 0 | 132 | 0 |
| B | 0 | 132 | 0 |
| C | 0 | 132 | 0 |
| D | 0 | 132 | 0 |
| Mode M9 | |||
|---|---|---|---|
| Quadrant | BADHDUFLAG | Total packets | Discarded packets |
| A | 0 | 15 | 0 |
| B | 0 | 15 | 0 |
| C | 0 | 15 | 0 |
| D | 0 | 16 | 0 |
| Quadrant | Total seconds | Saturated seconds | Saturation percentage |
|---|---|---|---|
| A | 6442 | 454 | 7.047501% |
| B | 6442 | 225 | 3.492704% |
| C | 6442 | 79 | 1.226327% |
| D | 6442 | 306 | 4.750078% |
Noise dominated data is calculated using 1-second bins in cleaned event files. If a bin has >2000 counts, and if more than 50% of those come from <1% of pixels, then it is considered to be noise-dominated and hence unusable.
| Quadrant | # 1 sec bins | Bins with >0 counts | Bins with >2000 counts | High rate bins dominated by noise | Noise dominated (total time) | Noise dominated (detector-on time) | Marked lightcurve |
|---|---|---|---|---|---|---|---|
| A | 7572 | 6442 | 190 | 190 | 2.51% | 2.95% | 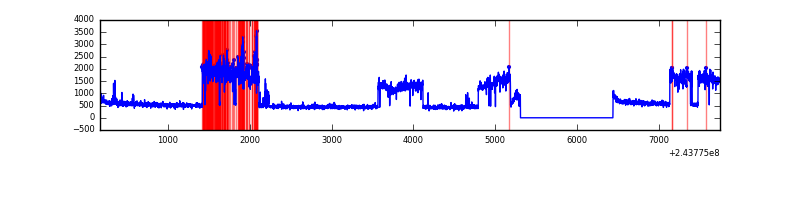 |
| B | 7572 | 6442 | 78 | 78 | 1.03% | 1.21% | 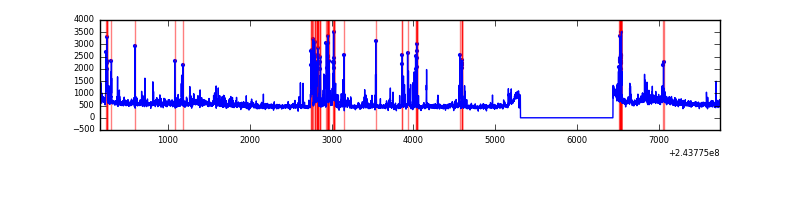 |
| C | 7572 | 6442 | 5 | 5 | 0.07% | 0.08% | 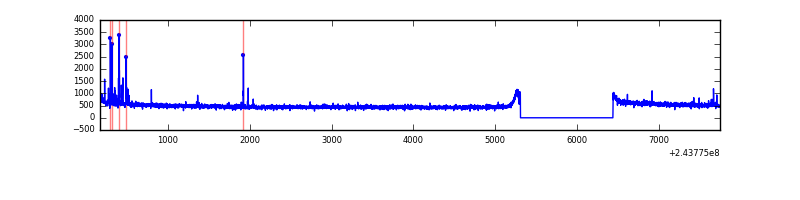 |
| D | 7572 | 6442 | 227 | 227 | 3.00% | 3.52% | 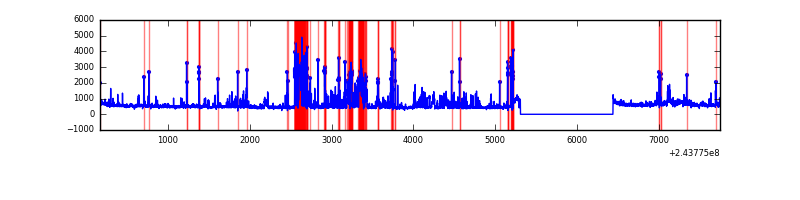 |
Top three noisy pixels from each quadrant. If the there are fewer than three noisy pixels in the level2.evt file, extra rows are filled as -1
| Pixel properties | Quadrant properties | ||||||
|---|---|---|---|---|---|---|---|
| Quadrant | DetID | PixID | Counts | Sigma | Mean | Median | Sigma |
| A | 15 | 239 | 2337140 | 14081.96 | 814 | 794 | 165.9 |
| A | 15 | 174 | 62885 | 374.24 | 814 | 794 | 165.9 |
| A | 14 | 254 | 32630 | 191.89 | 814 | 794 | 165.9 |
| B | 4 | 239 | 569407 | 3610.67 | 818 | 800 | 157.5 |
| B | 0 | 219 | 129723 | 818.66 | 818 | 800 | 157.5 |
| B | 0 | 214 | 68317 | 428.73 | 818 | 800 | 157.5 |
| C | 14 | 234 | 66866 | 354.91 | 802 | 805 | 186.1 |
| C | 13 | 61 | 6004 | 27.93 | 802 | 805 | 186.1 |
| C | 3 | 202 | 2031 | 6.59 | 802 | 805 | 186.1 |
| D | 2 | 16 | 781218 | 4134.82 | 788 | 767 | 188.8 |
| D | 10 | 172 | 116278 | 611.98 | 788 | 767 | 188.8 |
| D | 1 | 52 | 110319 | 580.4 | 788 | 767 | 188.8 |
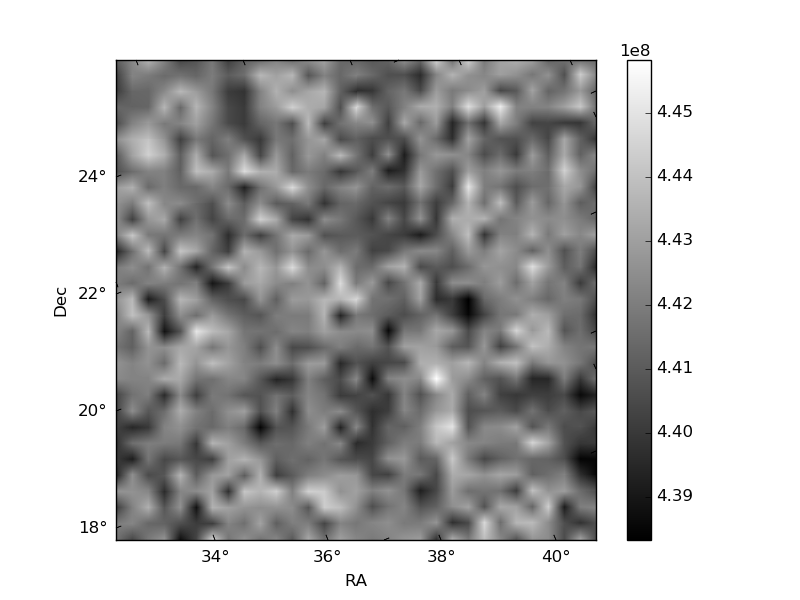
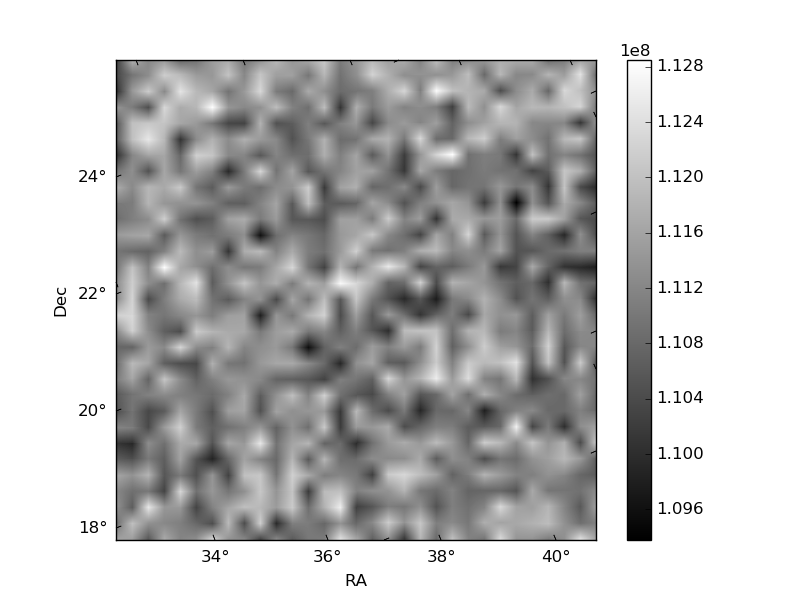
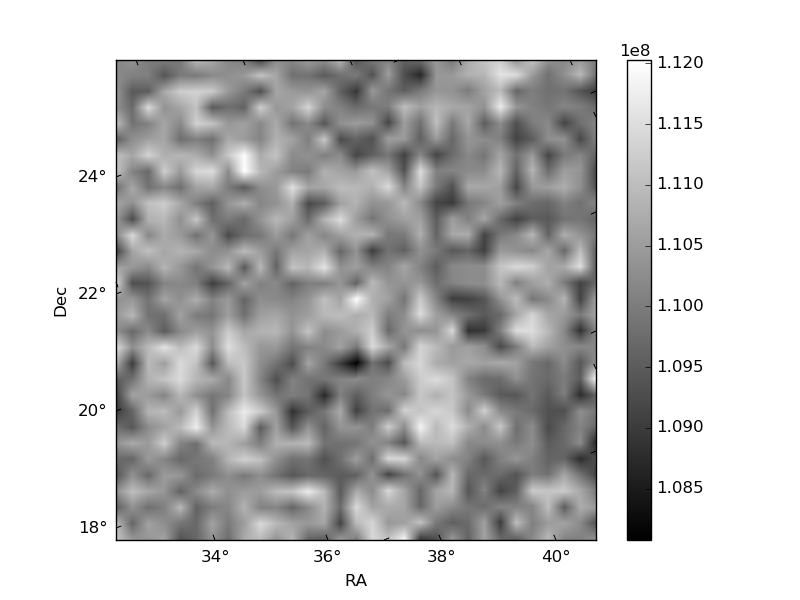
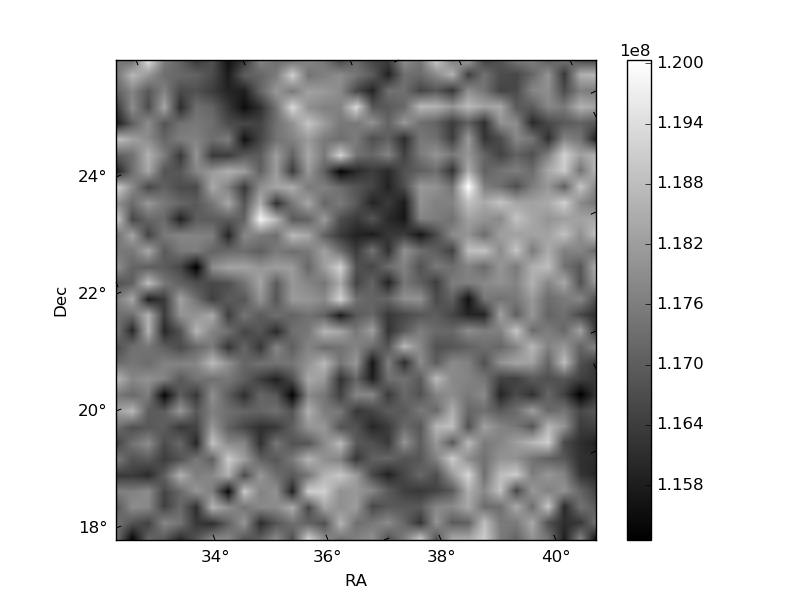
Histogram calculated using DETX and DETY for each event in the final _common_clean file
| Quadrant A | 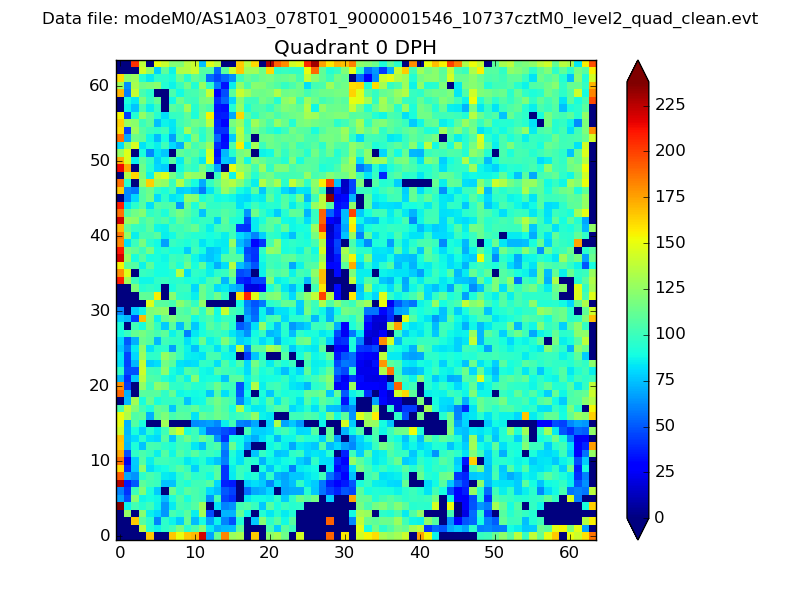 |
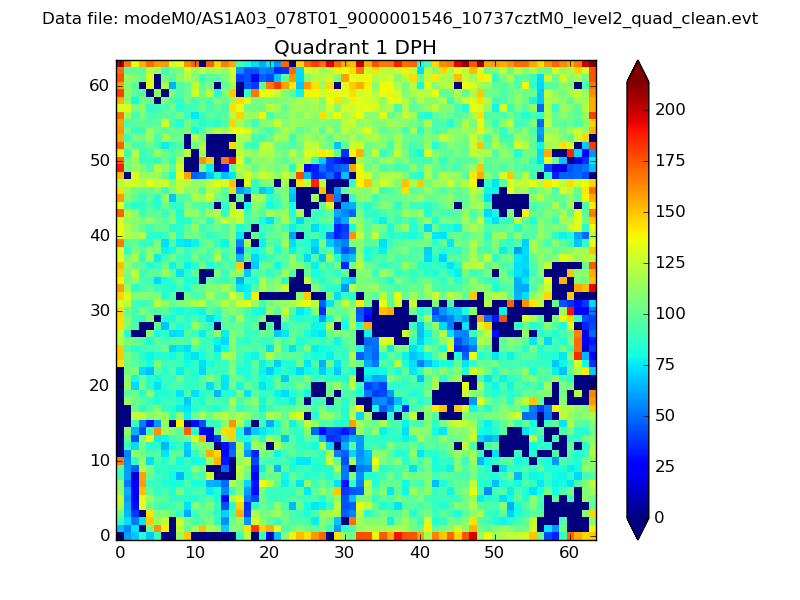 |
Quadrant B |
|---|---|---|---|
| Quadrant D |  |
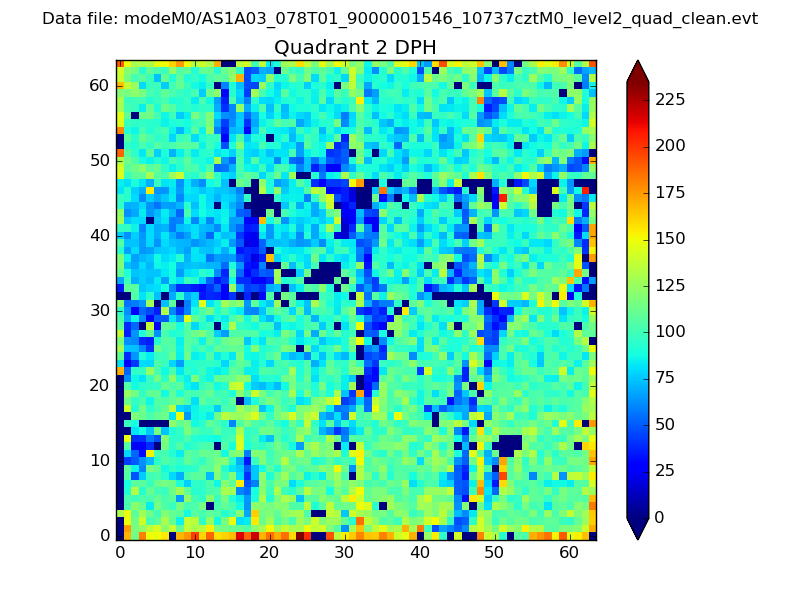 |
Quadrant C |
| Plot type | Count rate plots | Images |
|---|---|---|
| Comparison with Poisson distribution Blue bars denote a histogram of data divided into 1 sec bins. Red curve is a Poisson curve with rate = median count rate of data. |
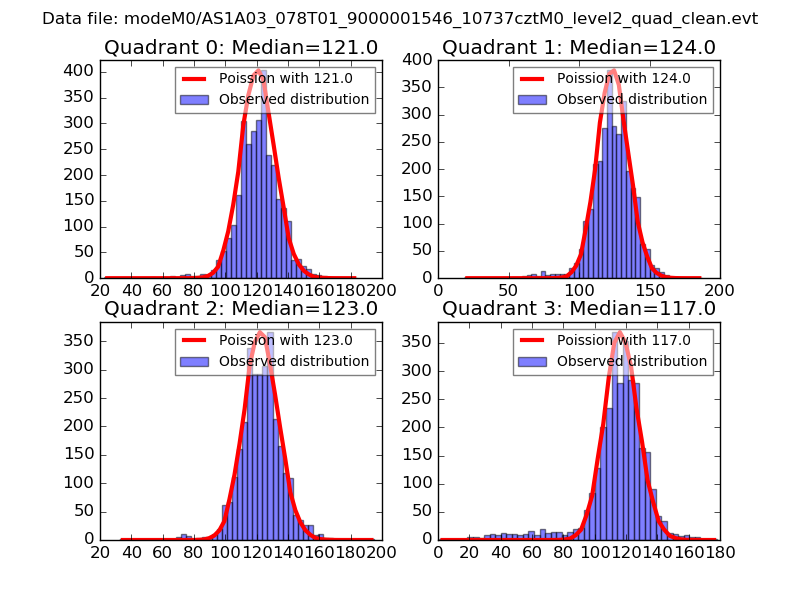 |
 |
| Quadrant-wise count rates Data is divided into 100 sec bins |
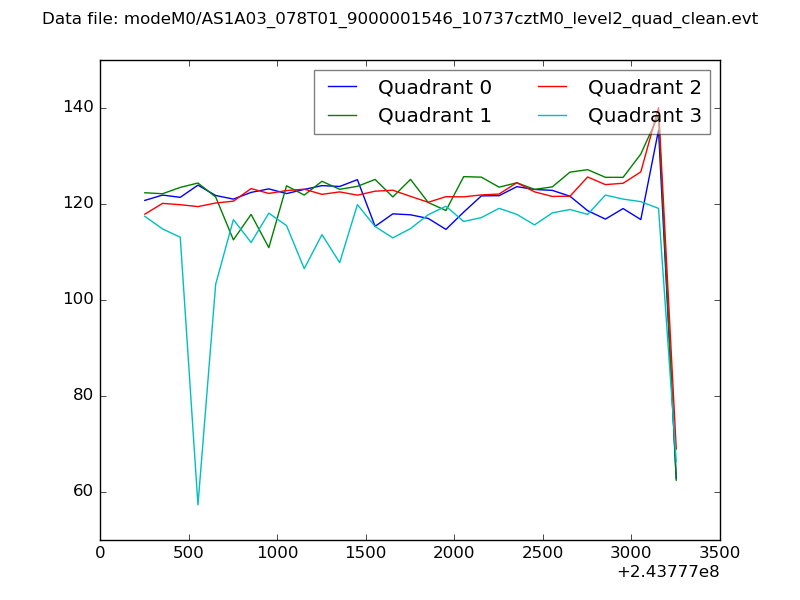 |
|
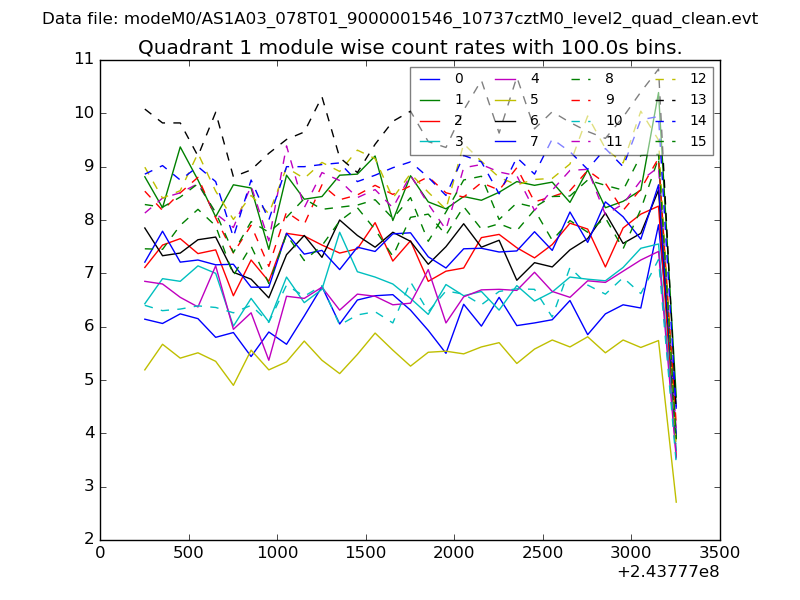
| Module-wise count rates for Quadrant A Data is divided into 100 sec bins |
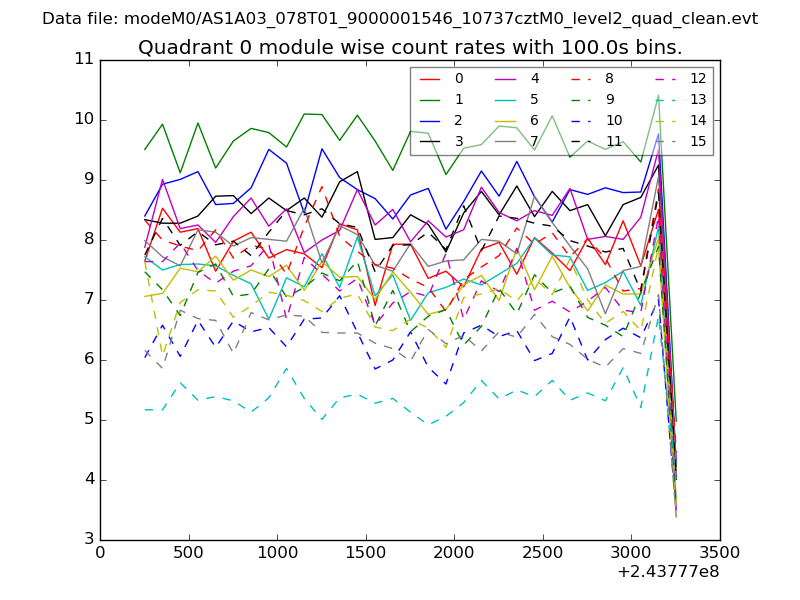 |
 |
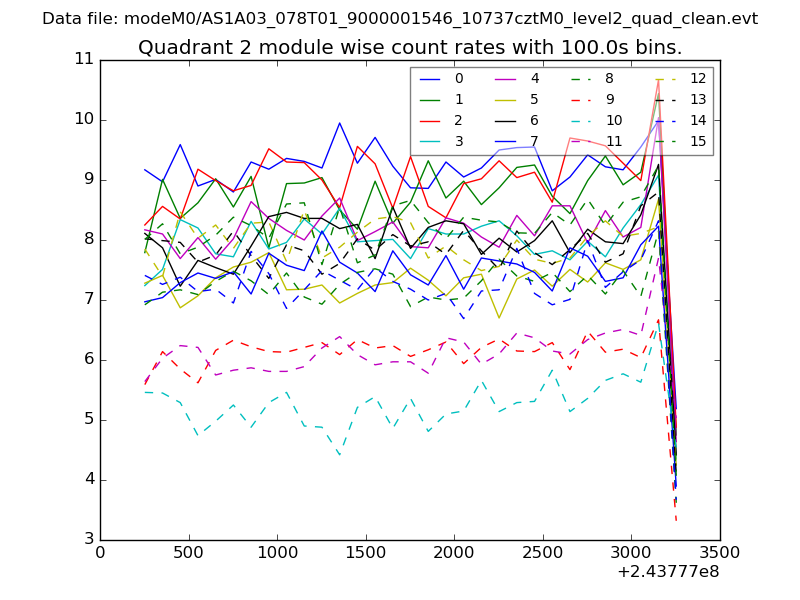
| Module-wise count rates for Quadrant B Data is divided into 100 sec bins |
 |
 |
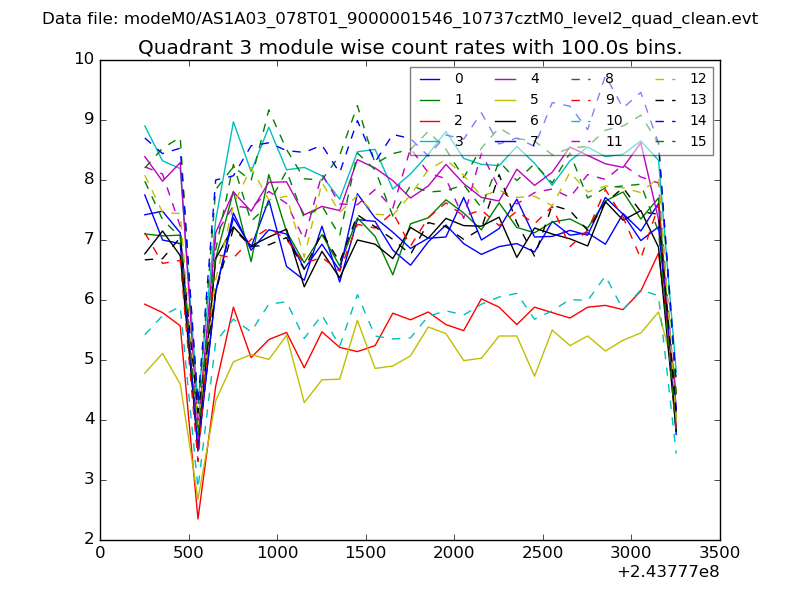
| Module-wise count rates for Quadrant C Data is divided into 100 sec bins |
 |
 |
| Module-wise count rates for Quadrant D Data is divided into 100 sec bins |
 |
 |
| Parameter | Plot |
|---|---|
| CZT HV Monitor | 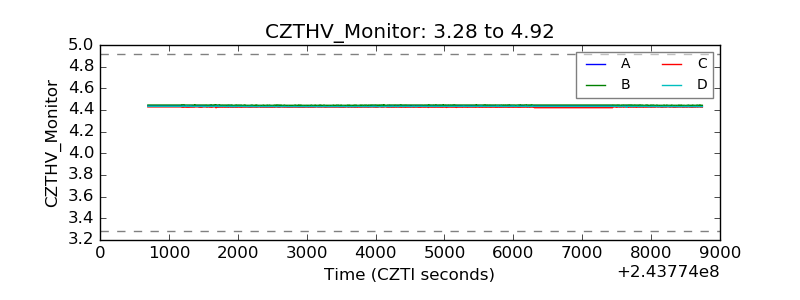 |
| D_VDD | 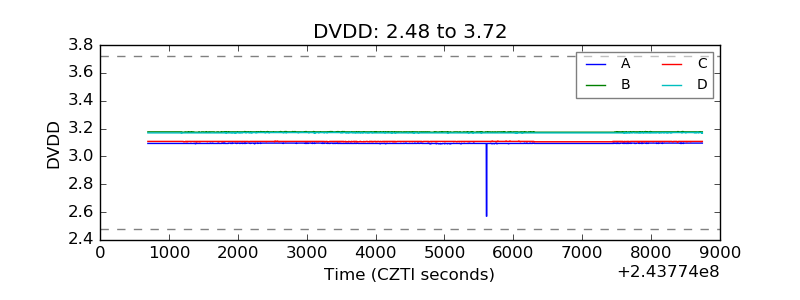 |
| Temperature 1 | 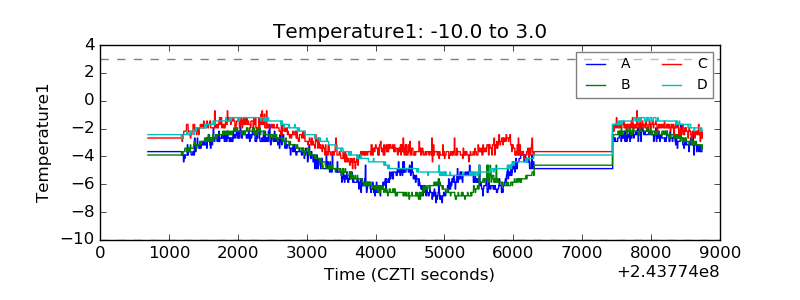 |
| Veto HV Monitor | 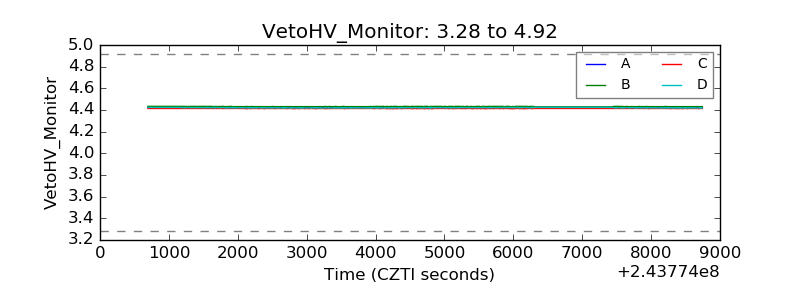 |
| Veto LLD | 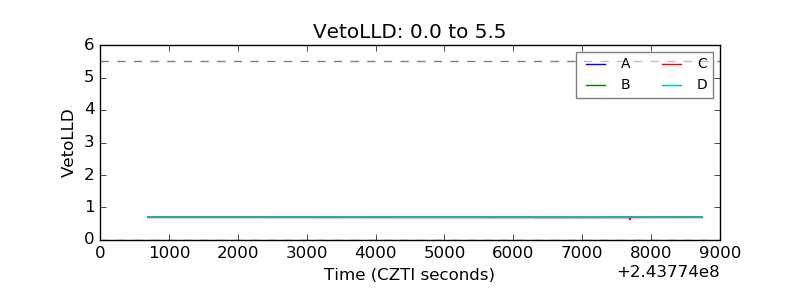 |
| Alpha Counter | 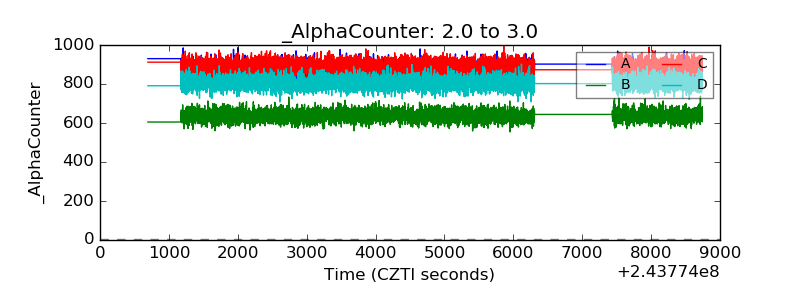 |
| _CPM_Rate | 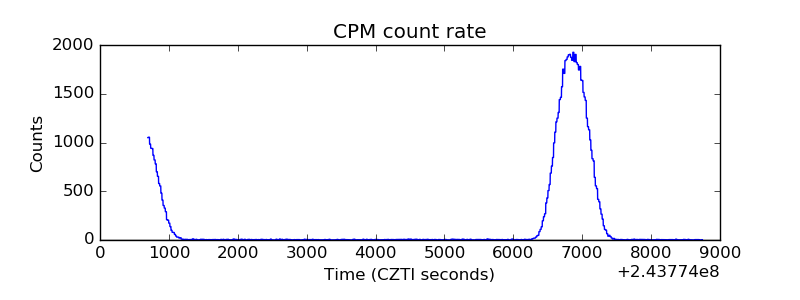 |
| CZT Counter | 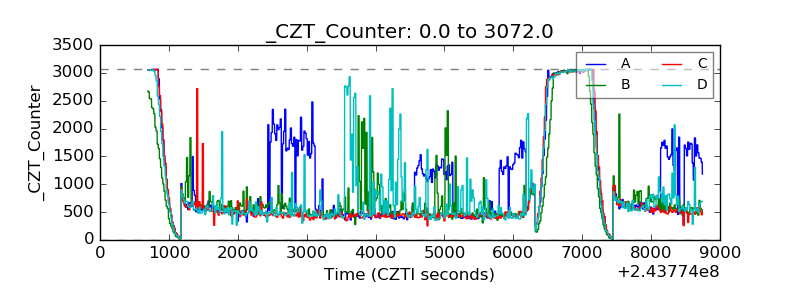 |
| +2.5 Volts monitor |  |
| +5 Volts monitor |  |
| _ROLL_ROT | 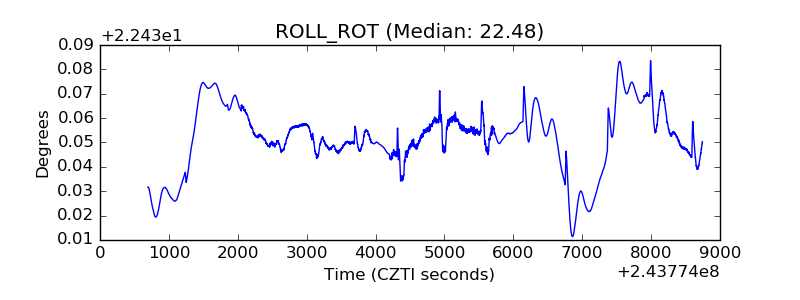 |
| _Roll_DEC | 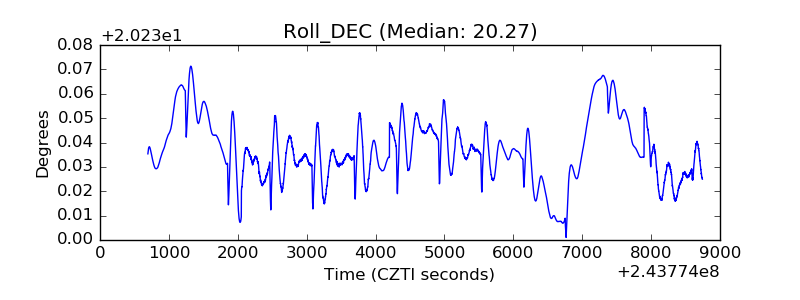 |
| _Roll_RA | 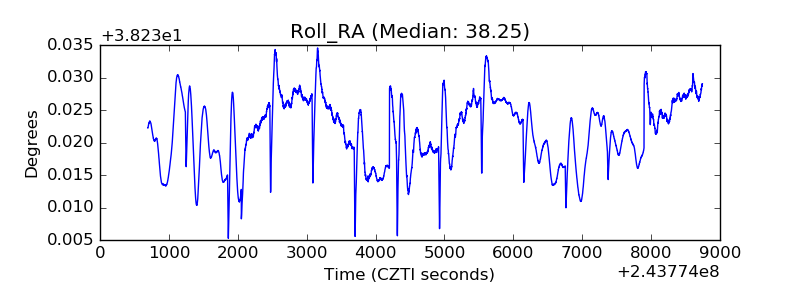 |
| Veto Counter | 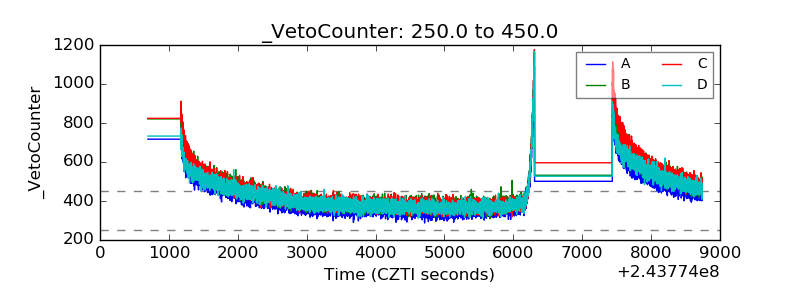 |