| Param | Original file | Final file |
|---|---|---|
| Filename | modeM0/AS1A03_078T01_9000001546_10738cztM0_level2.evt | modeM0/AS1A03_078T01_9000001546_10738cztM0_level2_quad_clean.evt |
| Size (bytes) | 583,712,640 | 72,426,240 |
| Size | 556.7 MB | 69.1 MB |
| Events in quadrant A | 4,735,804 | 441,302 |
| Events in quadrant B | 4,063,263 | 445,722 |
| Events in quadrant C | 3,240,290 | 448,298 |
| Events in quadrant D | 5,209,774 | 415,761 |
| Mode M0 | |||
|---|---|---|---|
| Quadrant | BADHDUFLAG | Total packets | Discarded packets |
| A | 0 | 18362 | 3 |
| B | 0 | 16312 | 2 |
| C | 0 | 13776 | 2 |
| D | 0 | 20022 | 2 |
| Mode SS | |||
|---|---|---|---|
| Quadrant | BADHDUFLAG | Total packets | Discarded packets |
| A | 0 | 130 | 0 |
| B | 0 | 130 | 0 |
| C | 0 | 130 | 0 |
| D | 0 | 130 | 0 |
| Mode M9 | |||
|---|---|---|---|
| Quadrant | BADHDUFLAG | Total packets | Discarded packets |
| A | 0 | 24 | 0 |
| B | 0 | 24 | 0 |
| C | 0 | 24 | 0 |
| D | 0 | 24 | 0 |
| Quadrant | Total seconds | Saturated seconds | Saturation percentage |
|---|---|---|---|
| A | 6332 | 438 | 6.917246% |
| B | 6332 | 276 | 4.358812% |
| C | 6332 | 104 | 1.642451% |
| D | 6332 | 639 | 10.091598% |
Noise dominated data is calculated using 1-second bins in cleaned event files. If a bin has >2000 counts, and if more than 50% of those come from <1% of pixels, then it is considered to be noise-dominated and hence unusable.
| Quadrant | # 1 sec bins | Bins with >0 counts | Bins with >2000 counts | High rate bins dominated by noise | Noise dominated (total time) | Noise dominated (detector-on time) | Marked lightcurve |
|---|---|---|---|---|---|---|---|
| A | 8747 | 6333 | 117 | 117 | 1.34% | 1.85% | 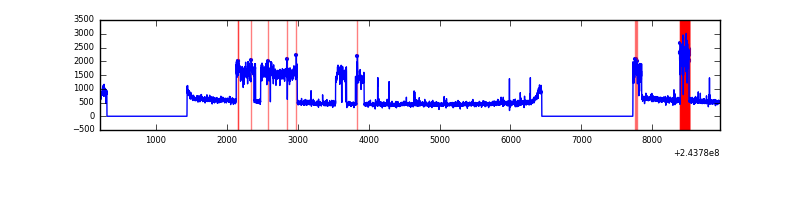 |
| B | 8747 | 6333 | 84 | 84 | 0.96% | 1.33% | 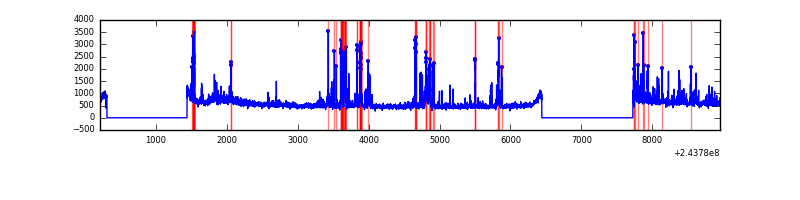 |
| C | 8747 | 6333 | 1 | 1 | 0.01% | 0.02% | 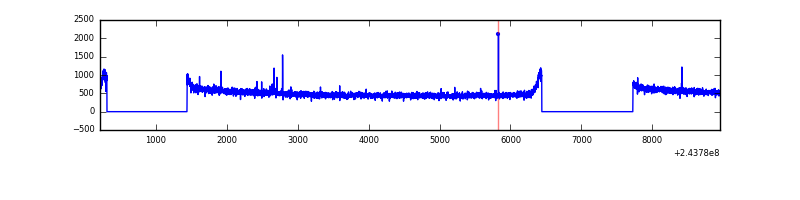 |
| D | 8747 | 6333 | 459 | 459 | 5.25% | 7.25% | 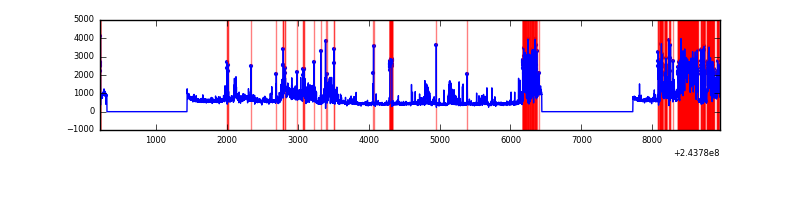 |
Top three noisy pixels from each quadrant. If the there are fewer than three noisy pixels in the level2.evt file, extra rows are filled as -1
| Pixel properties | Quadrant properties | ||||||
|---|---|---|---|---|---|---|---|
| Quadrant | DetID | PixID | Counts | Sigma | Mean | Median | Sigma |
| A | 15 | 239 | 1478842 | 8890.24 | 829 | 815 | 166.3 |
| A | 14 | 254 | 28252 | 165.03 | 829 | 815 | 166.3 |
| A | 11 | 29 | 11834 | 66.28 | 829 | 815 | 166.3 |
| B | 4 | 239 | 654097 | 4104.01 | 836 | 816 | 159.2 |
| B | 15 | 204 | 46839 | 289.12 | 836 | 816 | 159.2 |
| B | 0 | 219 | 41505 | 255.61 | 836 | 816 | 159.2 |
| C | 14 | 234 | 13811 | 68.21 | 828 | 836 | 190.2 |
| C | 13 | 61 | 6036 | 27.33 | 828 | 836 | 190.2 |
| C | 3 | 202 | 2033 | 6.29 | 828 | 836 | 190.2 |
| D | 2 | 16 | 896142 | 4755.5 | 790 | 771 | 188.3 |
| D | 1 | 52 | 870739 | 4620.57 | 790 | 771 | 188.3 |
| D | 13 | 249 | 135820 | 717.27 | 790 | 771 | 188.3 |
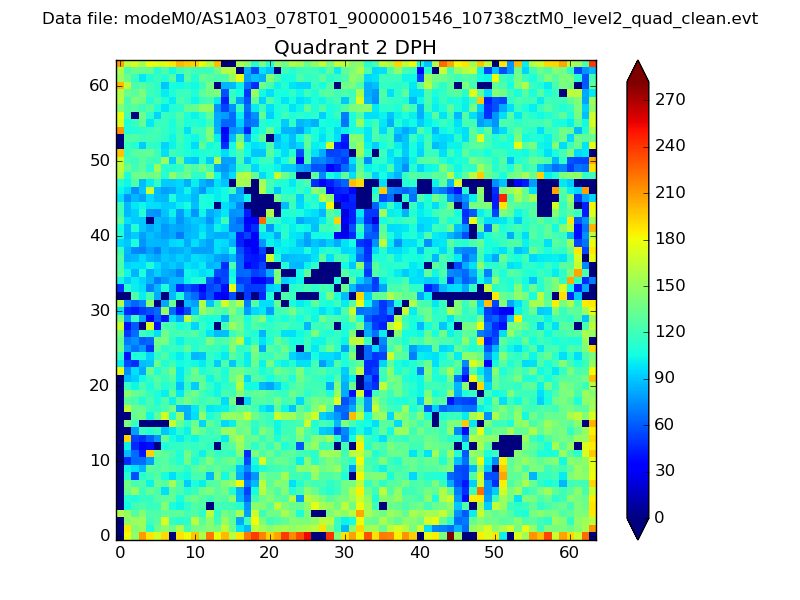
Histogram calculated using DETX and DETY for each event in the final _common_clean file
| Quadrant A | 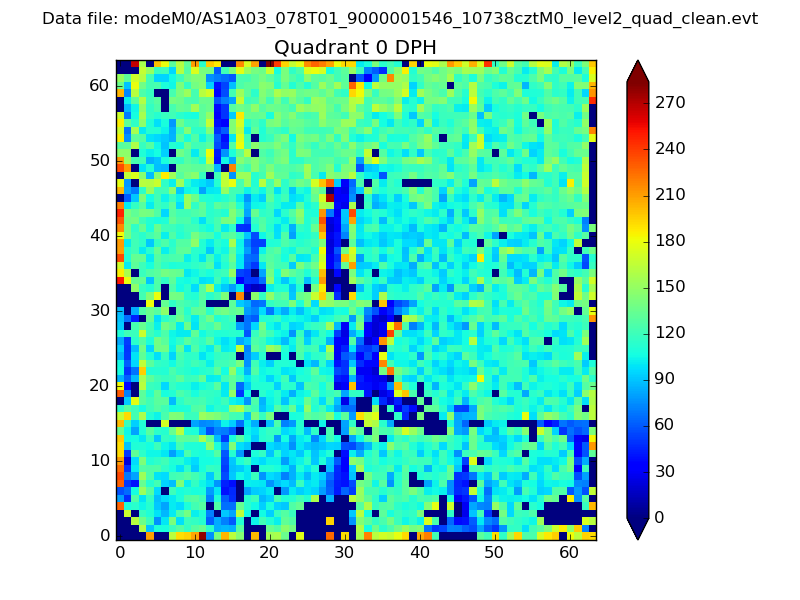 |
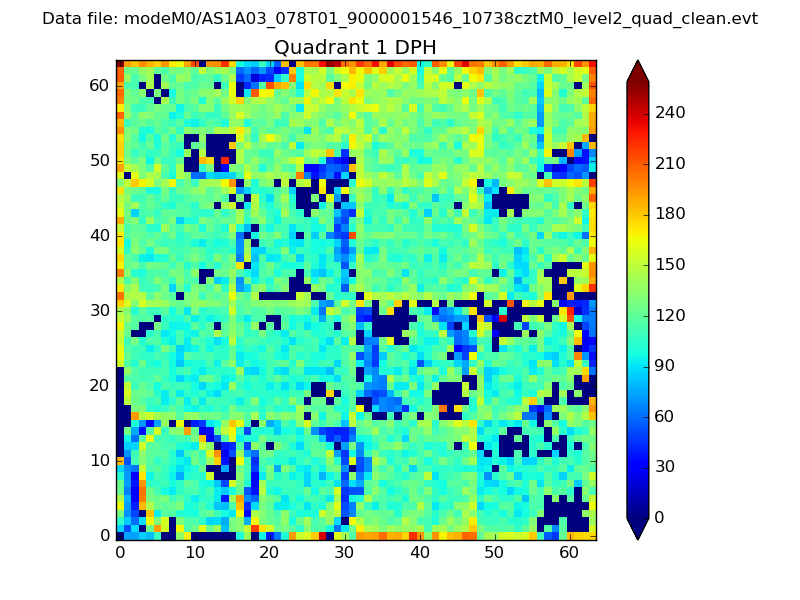 |
Quadrant B |
|---|---|---|---|
| Quadrant D | 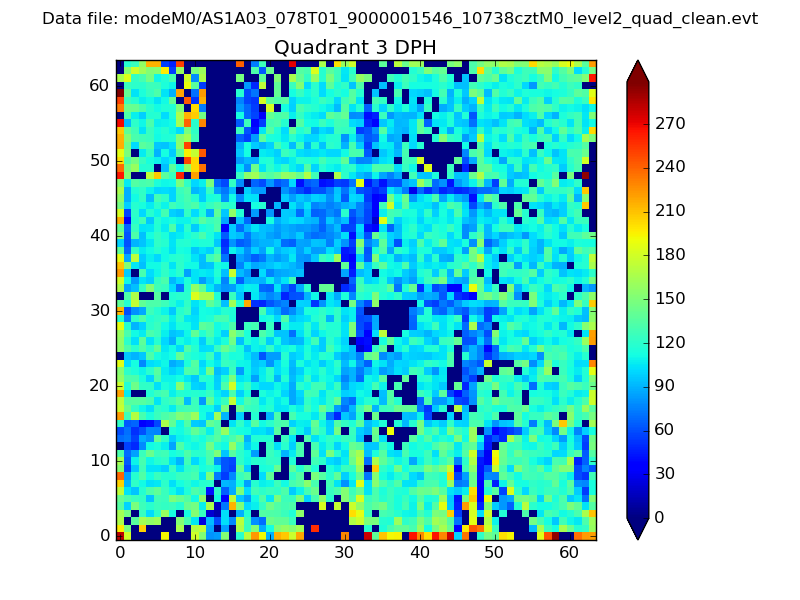 |
 |
Quadrant C |
| Plot type | Count rate plots | Images |
|---|---|---|
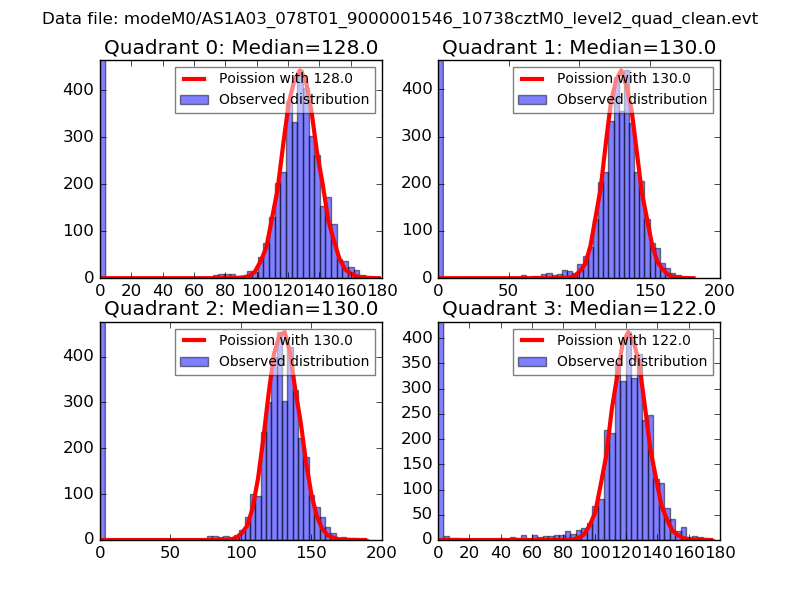
| Comparison with Poisson distribution Blue bars denote a histogram of data divided into 1 sec bins. Red curve is a Poisson curve with rate = median count rate of data. |
 |
 |
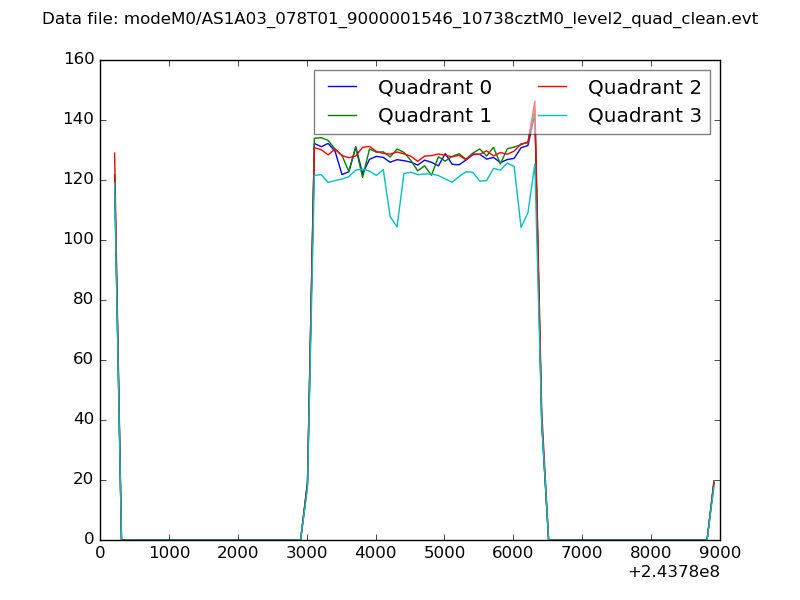
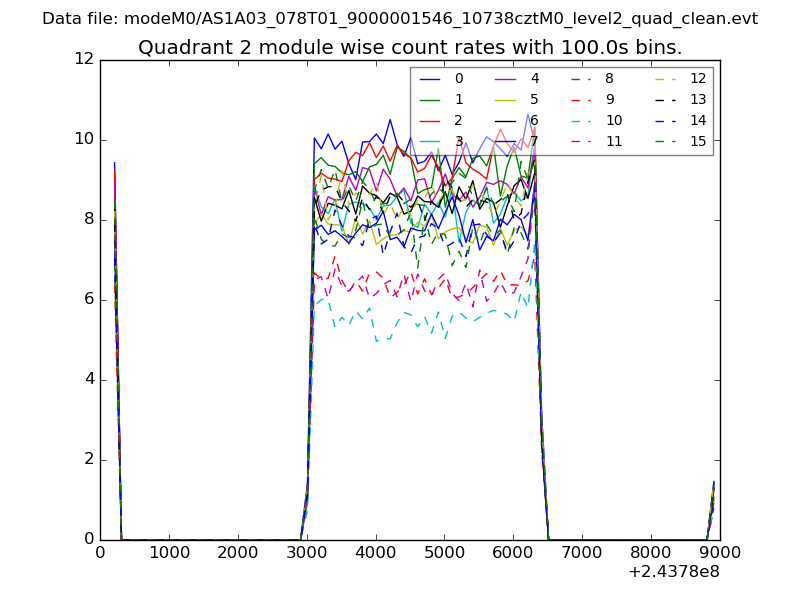
| Quadrant-wise count rates Data is divided into 100 sec bins |
 |
|
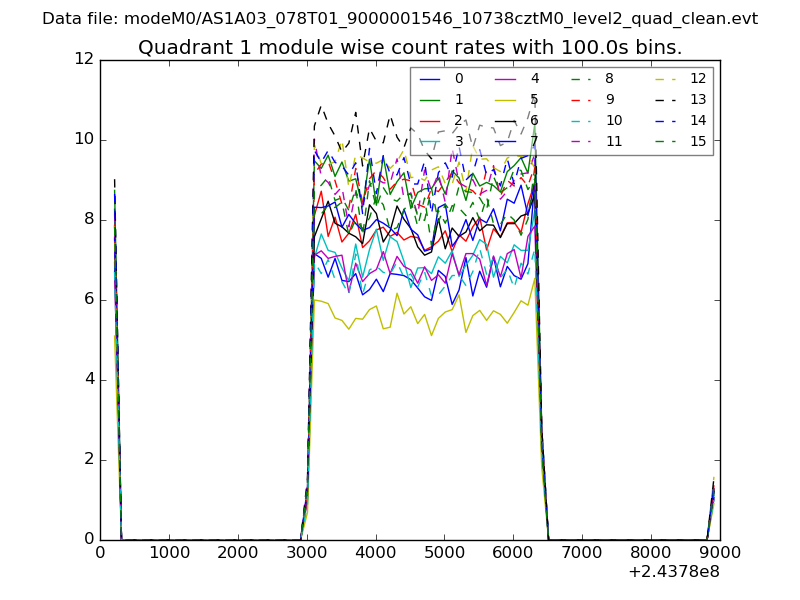
| Module-wise count rates for Quadrant A Data is divided into 100 sec bins |
 |
 |
| Module-wise count rates for Quadrant B Data is divided into 100 sec bins |
 |
 |
| Module-wise count rates for Quadrant C Data is divided into 100 sec bins |
 |
 |
| Module-wise count rates for Quadrant D Data is divided into 100 sec bins |
 |
 |
| Parameter | Plot |
|---|---|
| CZT HV Monitor | 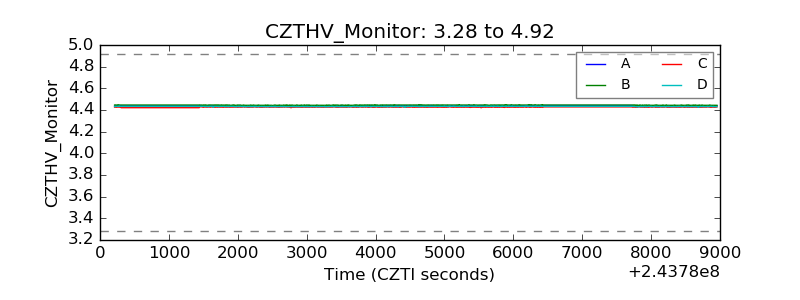 |
| D_VDD | 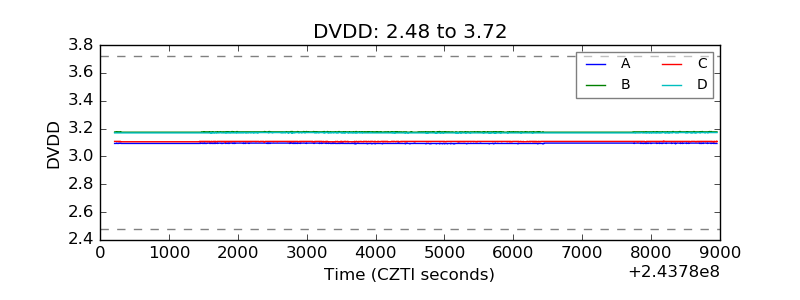 |
| Temperature 1 | 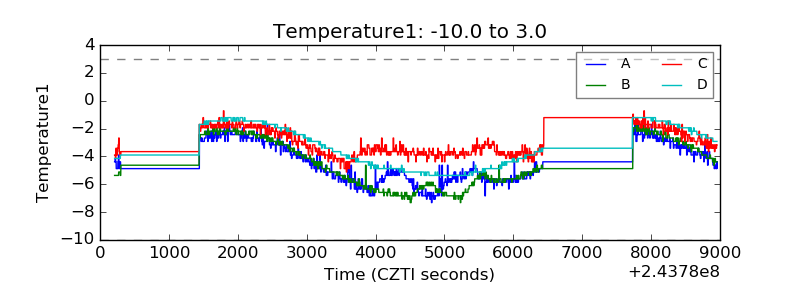 |
| Veto HV Monitor | 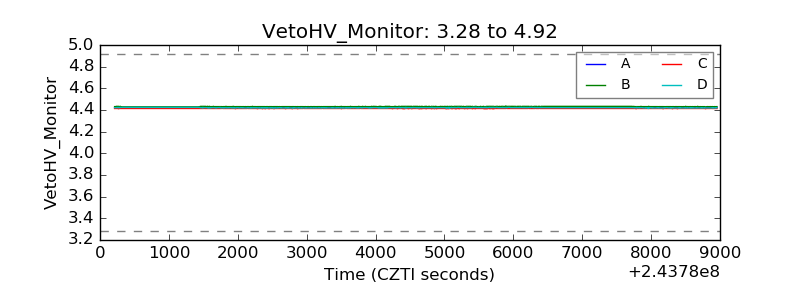 |
| Veto LLD | 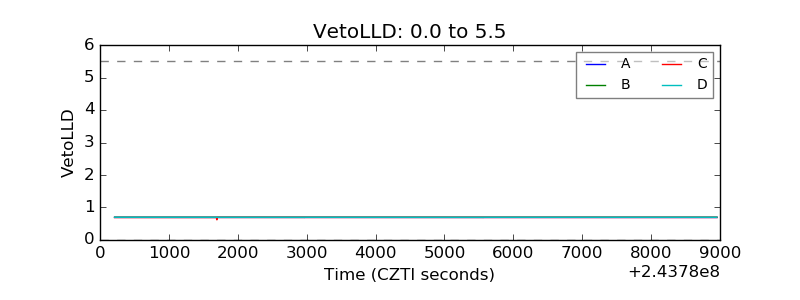 |
| Alpha Counter | 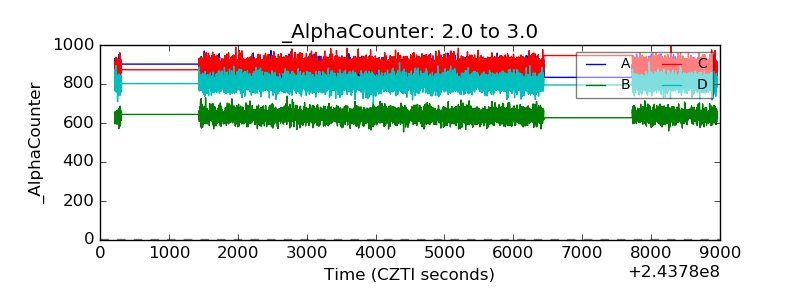 |
| _CPM_Rate | 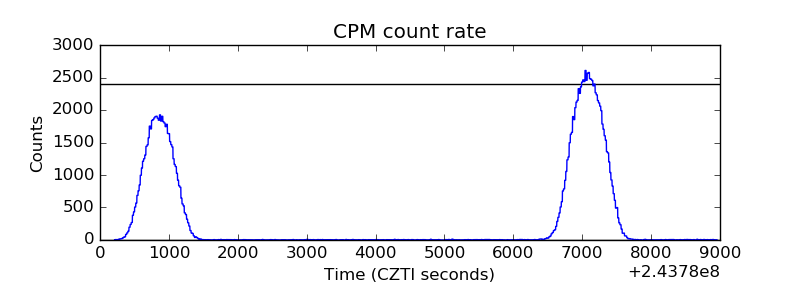 |
| CZT Counter |  |
| +2.5 Volts monitor |  |
| +5 Volts monitor |  |
| _ROLL_ROT |  |
| _Roll_DEC |  |
| _Roll_RA |  |
| Veto Counter |  |