| Param | Original file | Final file |
|---|---|---|
| Filename | modeM0/AS1A03_078T01_9000001546_10739cztM0_level2.evt | modeM0/AS1A03_078T01_9000001546_10739cztM0_level2_quad_clean.evt |
| Size (bytes) | 584,424,000 | 83,525,760 |
| Size | 557.4 MB | 79.7 MB |
| Events in quadrant A | 3,559,502 | 531,047 |
| Events in quadrant B | 4,576,452 | 533,957 |
| Events in quadrant C | 3,144,483 | 542,517 |
| Events in quadrant D | 6,005,115 | 494,991 |
| Mode M0 | |||
|---|---|---|---|
| Quadrant | BADHDUFLAG | Total packets | Discarded packets |
| A | 0 | 14566 | 3 |
| B | 0 | 17697 | 2 |
| C | 0 | 13281 | 2 |
| D | 0 | 22133 | 2 |
| Mode SS | |||
|---|---|---|---|
| Quadrant | BADHDUFLAG | Total packets | Discarded packets |
| A | 0 | 124 | 0 |
| B | 0 | 124 | 0 |
| C | 0 | 124 | 0 |
| D | 0 | 124 | 0 |
| Mode M9 | |||
|---|---|---|---|
| Quadrant | BADHDUFLAG | Total packets | Discarded packets |
| A | 0 | 22 | 0 |
| B | 0 | 22 | 0 |
| C | 0 | 22 | 0 |
| D | 0 | 23 | 0 |
| Quadrant | Total seconds | Saturated seconds | Saturation percentage |
|---|---|---|---|
| A | 6112 | 251 | 4.106675% |
| B | 6112 | 485 | 7.935209% |
| C | 6112 | 54 | 0.883508% |
| D | 6112 | 807 | 13.203534% |
Noise dominated data is calculated using 1-second bins in cleaned event files. If a bin has >2000 counts, and if more than 50% of those come from <1% of pixels, then it is considered to be noise-dominated and hence unusable.
| Quadrant | # 1 sec bins | Bins with >0 counts | Bins with >2000 counts | High rate bins dominated by noise | Noise dominated (total time) | Noise dominated (detector-on time) | Marked lightcurve |
|---|---|---|---|---|---|---|---|
| A | 7437 | 6113 | 110 | 110 | 1.48% | 1.80% | 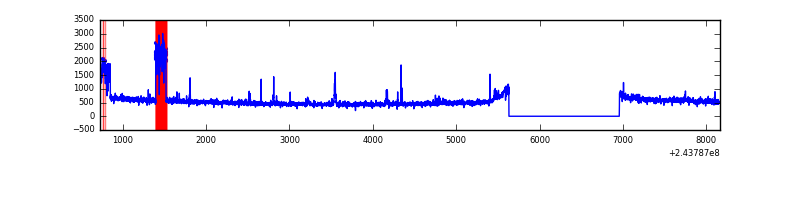 |
| B | 7437 | 6113 | 259 | 259 | 3.48% | 4.24% | 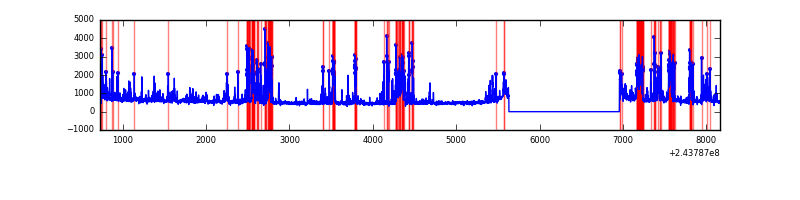 |
| C | 7437 | 6113 | 0 | 0 | 0.00% | 0.00% | 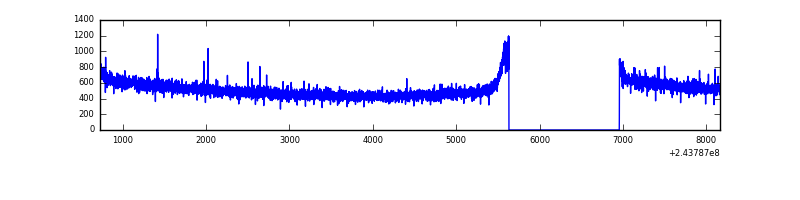 |
| D | 7437 | 6113 | 648 | 648 | 8.71% | 10.60% | 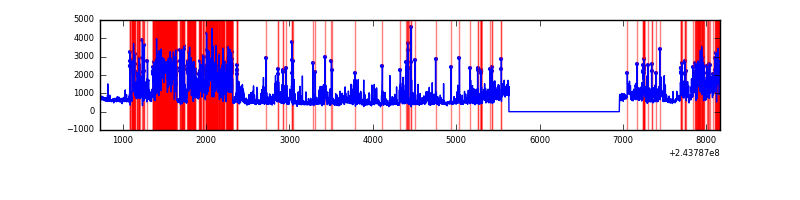 |
Top three noisy pixels from each quadrant. If the there are fewer than three noisy pixels in the level2.evt file, extra rows are filled as -1
| Pixel properties | Quadrant properties | ||||||
|---|---|---|---|---|---|---|---|
| Quadrant | DetID | PixID | Counts | Sigma | Mean | Median | Sigma |
| A | 15 | 239 | 355825 | 2185.73 | 804 | 790 | 162.4 |
| A | 14 | 254 | 60656 | 368.56 | 804 | 790 | 162.4 |
| A | 13 | 251 | 22254 | 132.14 | 804 | 790 | 162.4 |
| B | 4 | 239 | 1355520 | 9044.59 | 794 | 777 | 149.8 |
| B | 15 | 204 | 44333 | 290.79 | 794 | 777 | 149.8 |
| B | 0 | 214 | 30328 | 197.29 | 794 | 777 | 149.8 |
| C | 13 | 61 | 5976 | 27.98 | 805 | 811 | 184.6 |
| C | 14 | 234 | 5889 | 27.51 | 805 | 811 | 184.6 |
| C | 3 | 202 | 2051 | 6.72 | 805 | 811 | 184.6 |
| D | 1 | 52 | 1401251 | 7711.04 | 760 | 742 | 181.6 |
| D | 2 | 16 | 1225020 | 6740.73 | 760 | 742 | 181.6 |
| D | 10 | 157 | 172170 | 943.86 | 760 | 742 | 181.6 |
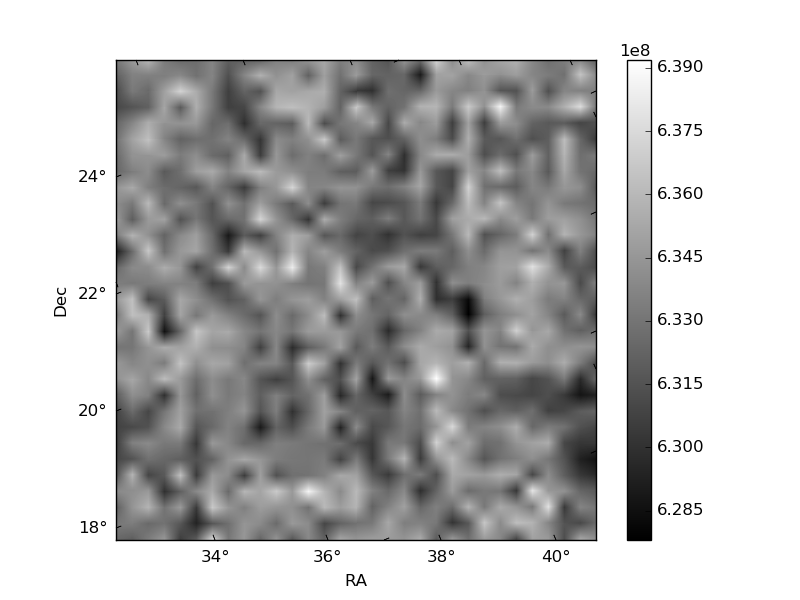
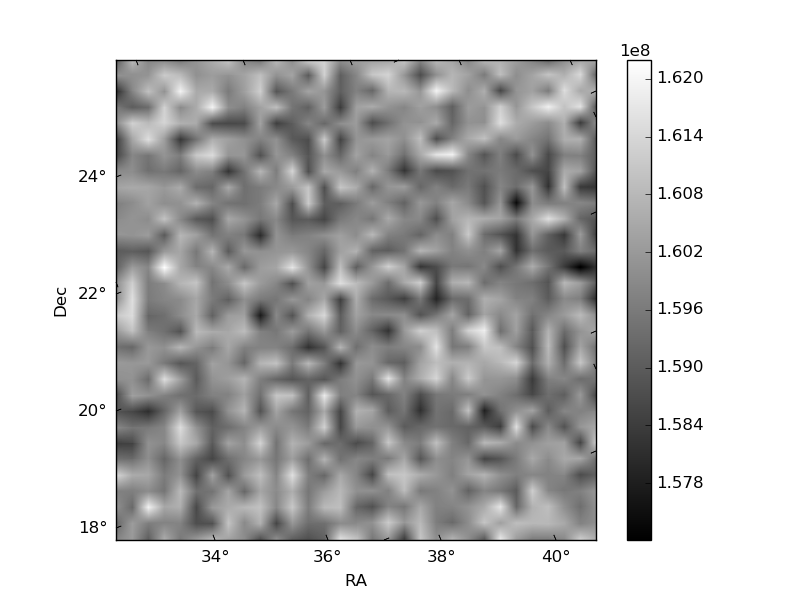
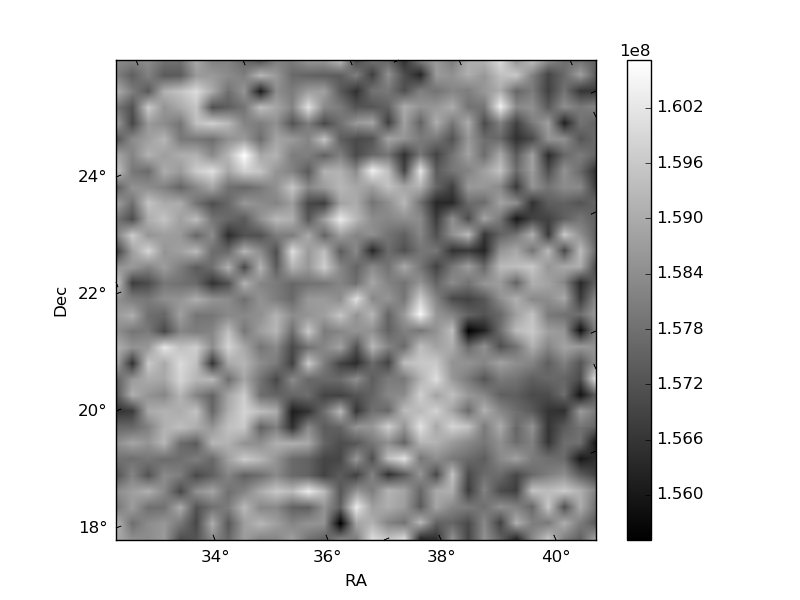
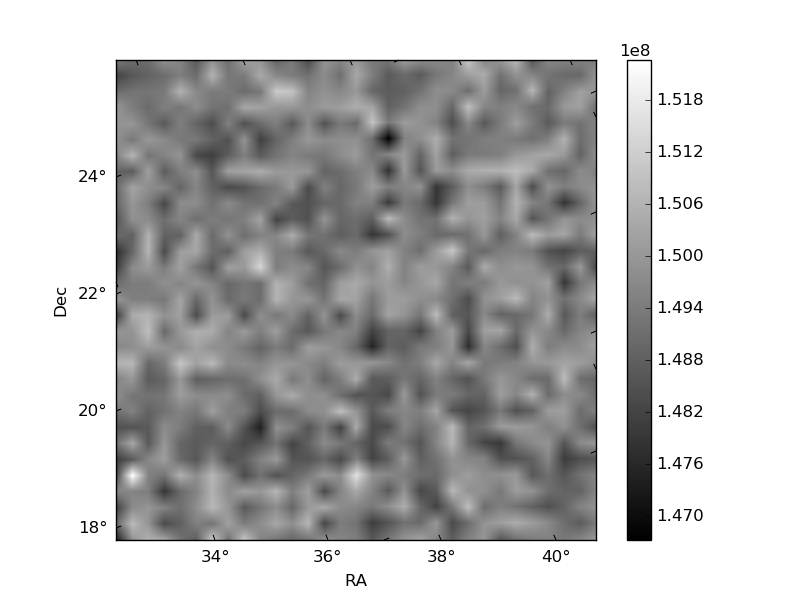
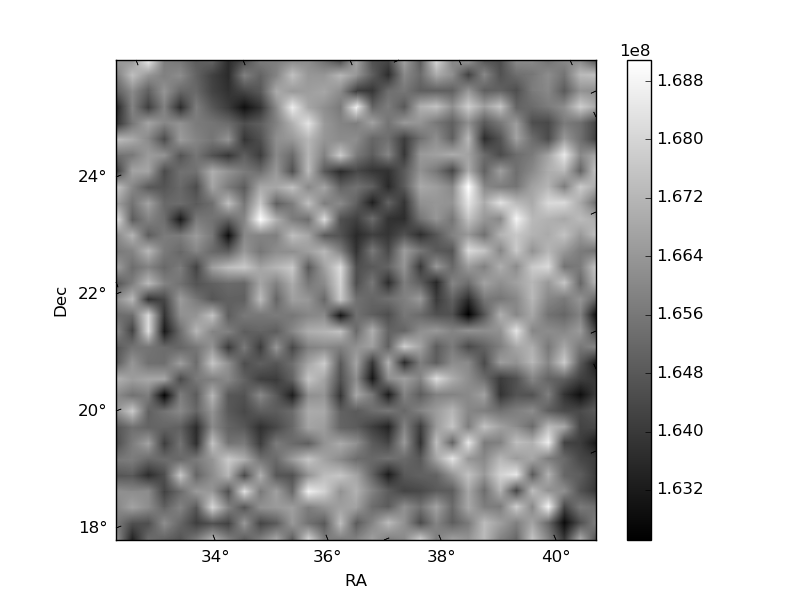
Histogram calculated using DETX and DETY for each event in the final _common_clean file
| Quadrant A | 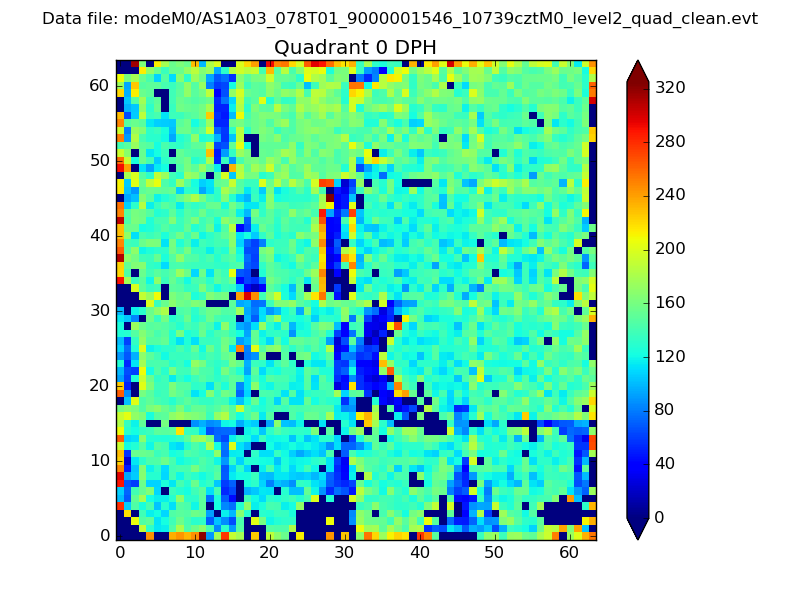 |
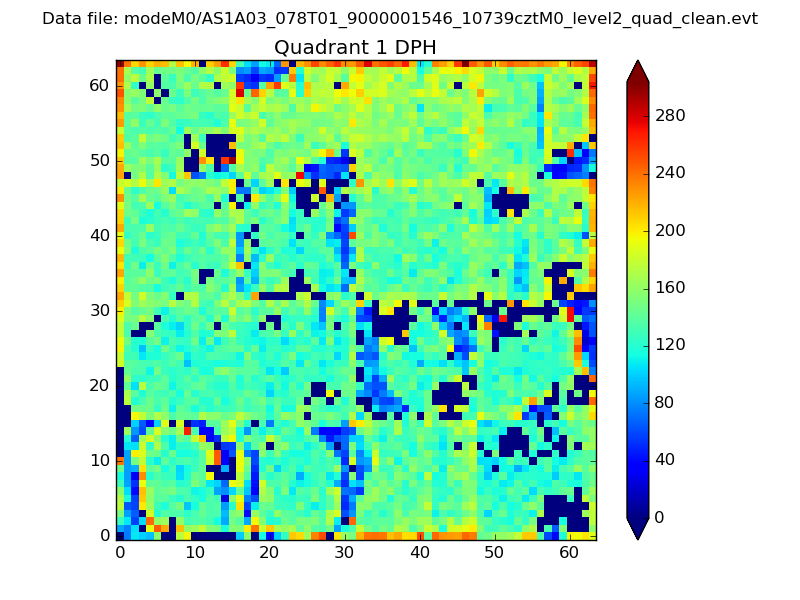 |
Quadrant B |
|---|---|---|---|
| Quadrant D | 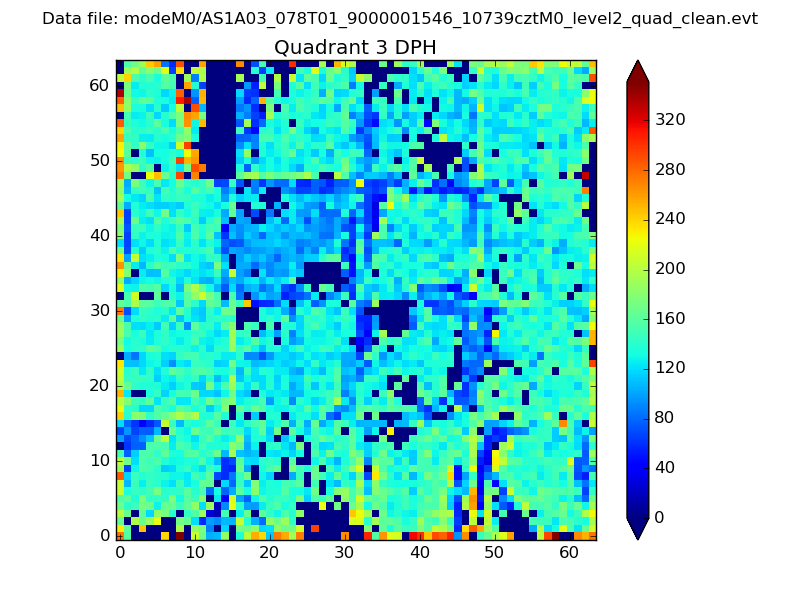 |
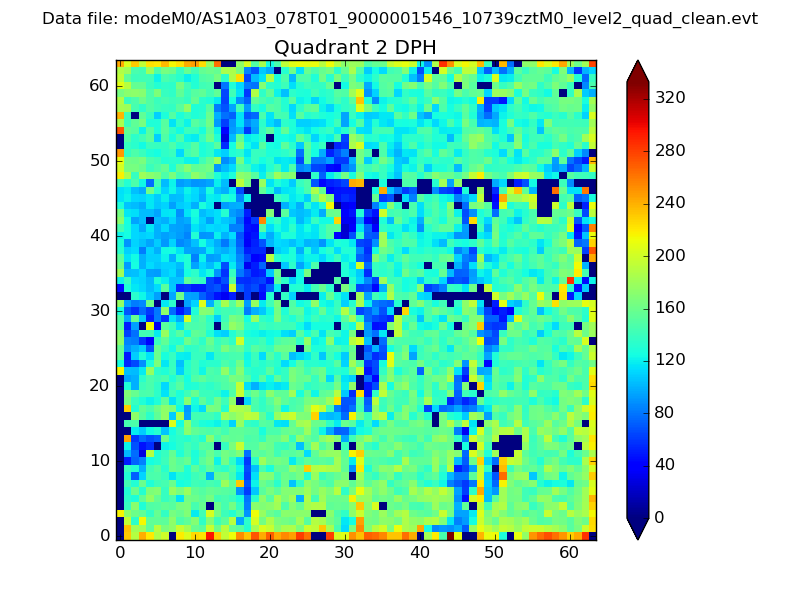 |
Quadrant C |
| Plot type | Count rate plots | Images |
|---|---|---|
| Comparison with Poisson distribution Blue bars denote a histogram of data divided into 1 sec bins. Red curve is a Poisson curve with rate = median count rate of data. |
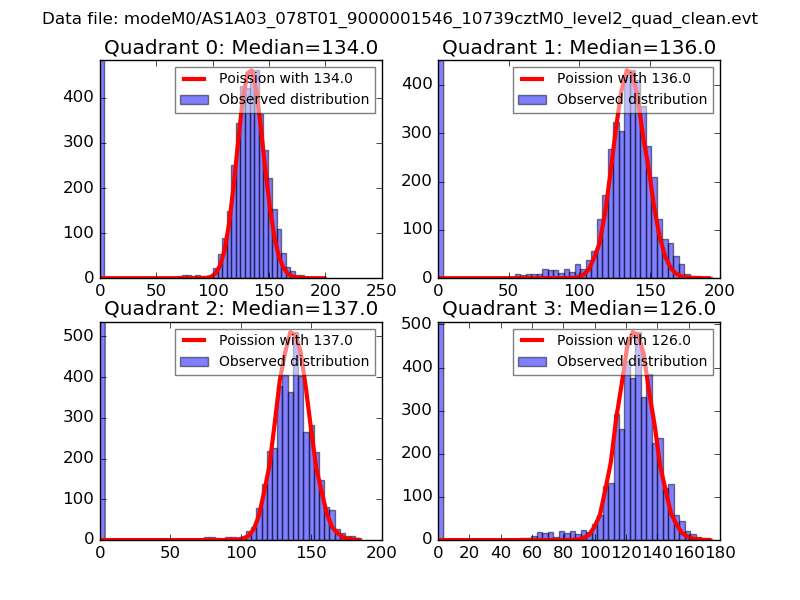 |
 |
| Quadrant-wise count rates Data is divided into 100 sec bins |
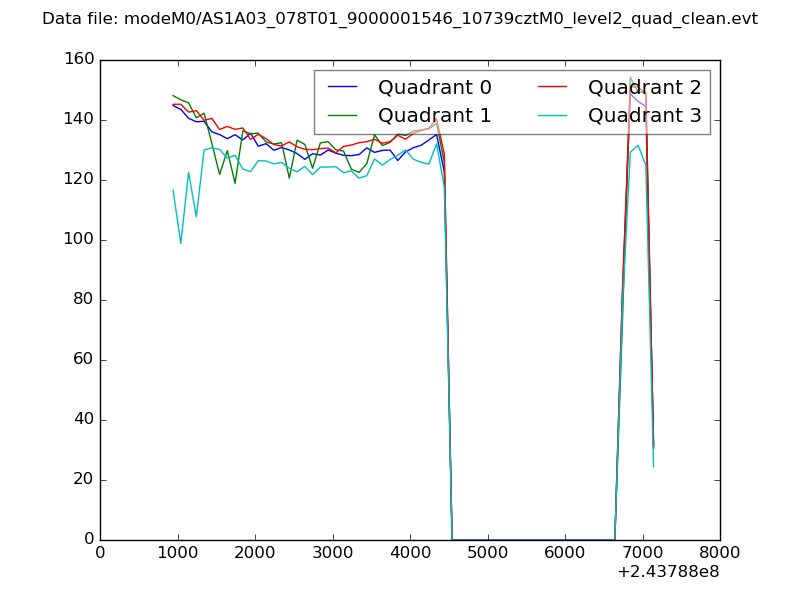 |
|
| Module-wise count rates for Quadrant A Data is divided into 100 sec bins |
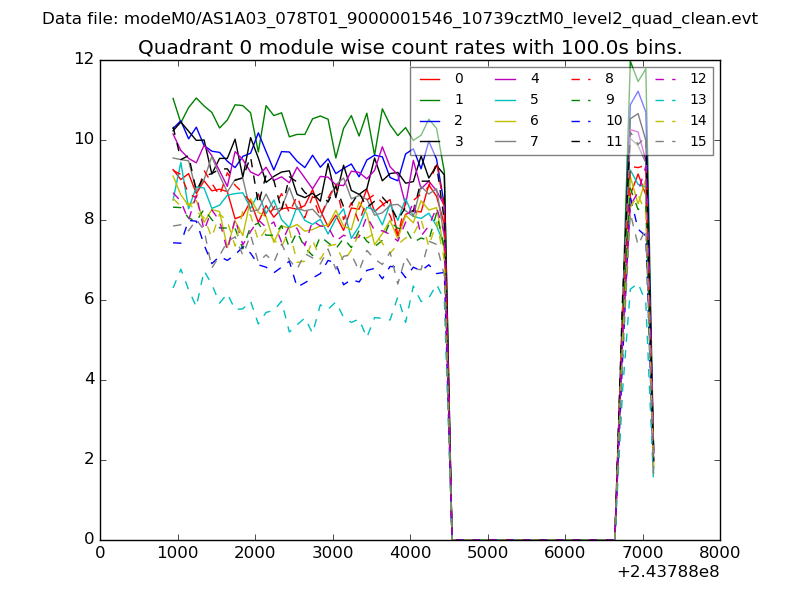 |
 |
| Module-wise count rates for Quadrant B Data is divided into 100 sec bins |
 |
 |
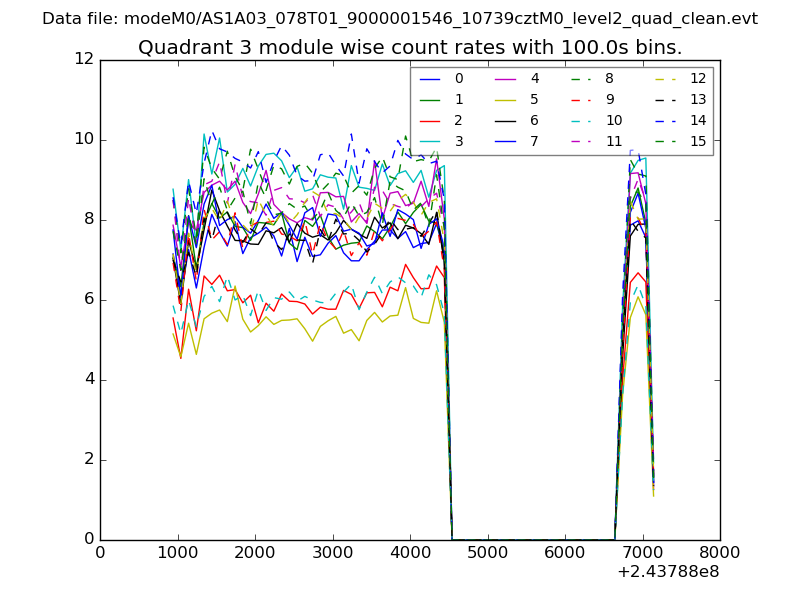
| Module-wise count rates for Quadrant C Data is divided into 100 sec bins |
 |
 |
| Module-wise count rates for Quadrant D Data is divided into 100 sec bins |
 |
 |
| Parameter | Plot |
|---|---|
| CZT HV Monitor |  |
| D_VDD | 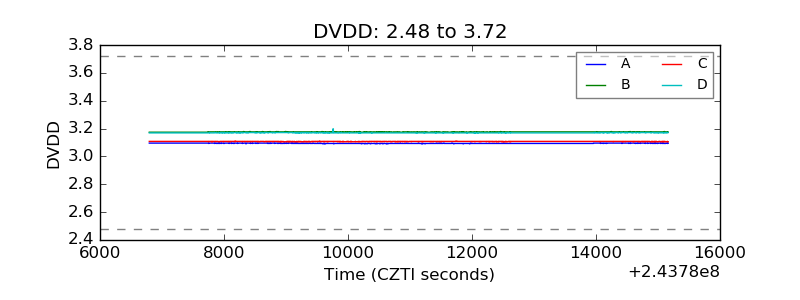 |
| Temperature 1 | 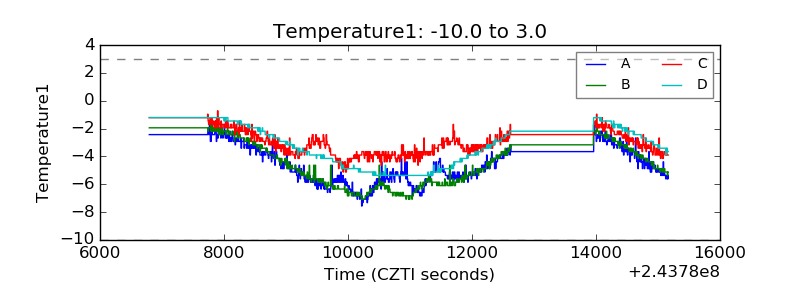 |
| Veto HV Monitor | 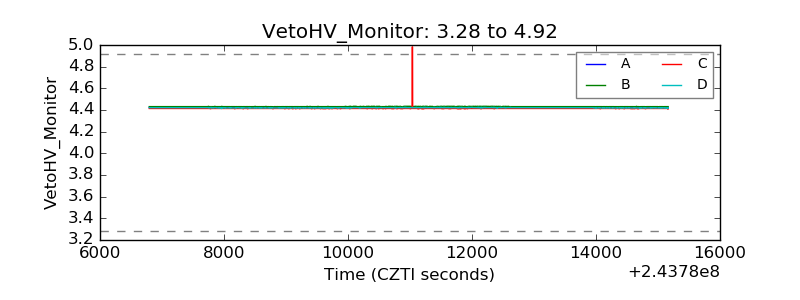 |
| Veto LLD | 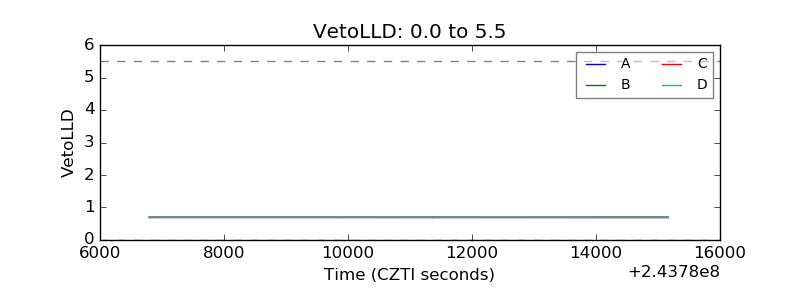 |
| Alpha Counter | 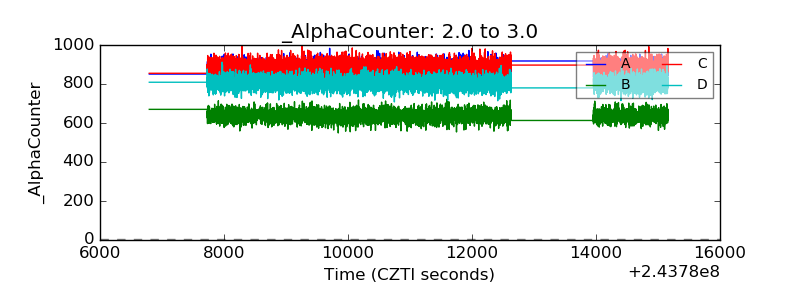 |
| _CPM_Rate | 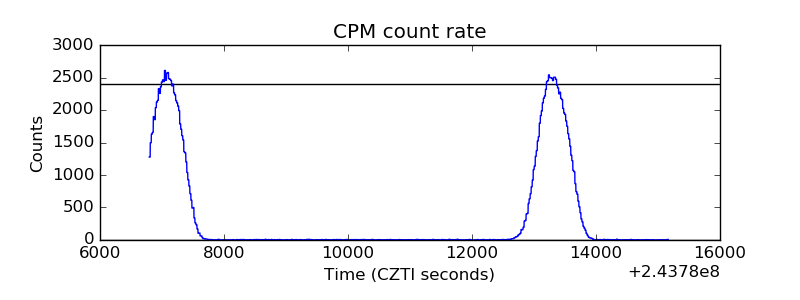 |
| CZT Counter | 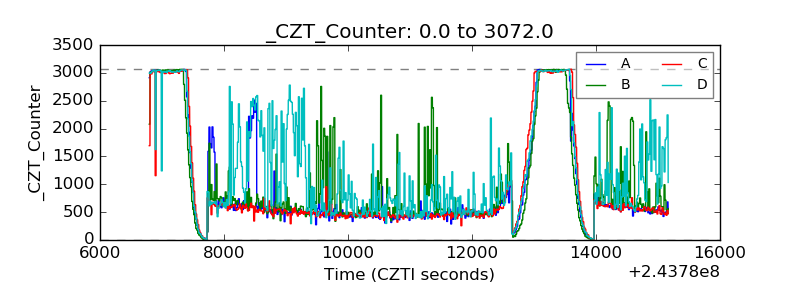 |
| +2.5 Volts monitor |  |
| +5 Volts monitor |  |
| _ROLL_ROT | 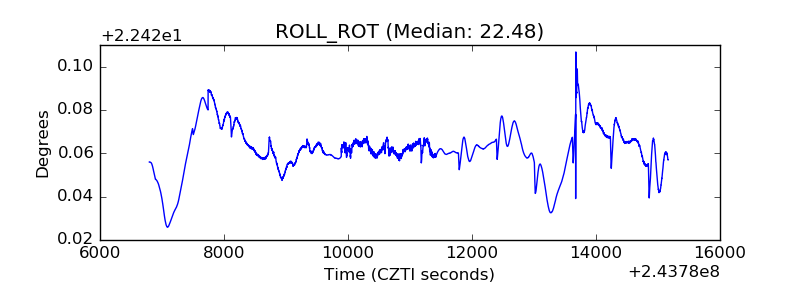 |
| _Roll_DEC | 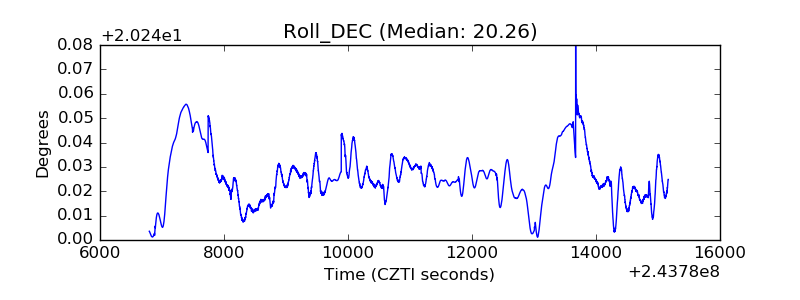 |
| _Roll_RA | 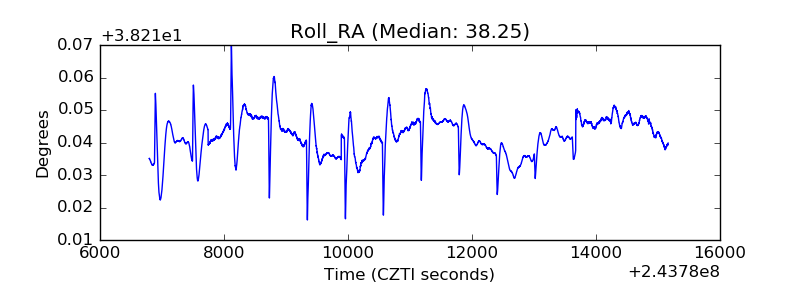 |
| Veto Counter | 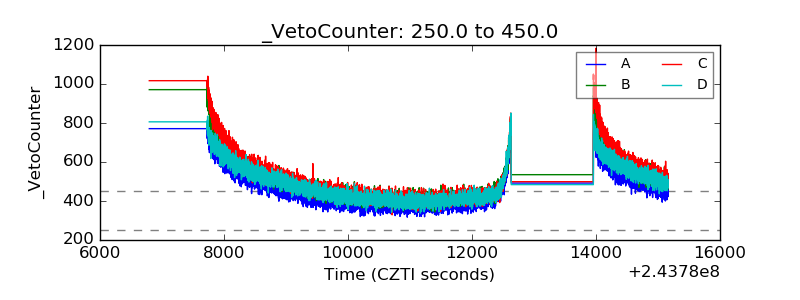 |