| Param | Original file | Final file |
|---|---|---|
| Filename | modeM0/AS1A03_078T01_9000001546_10740cztM0_level2.evt | modeM0/AS1A03_078T01_9000001546_10740cztM0_level2_quad_clean.evt |
| Size (bytes) | 626,279,040 | 95,126,400 |
| Size | 597.3 MB | 90.7 MB |
| Events in quadrant A | 4,159,533 | 610,661 |
| Events in quadrant B | 5,373,874 | 612,218 |
| Events in quadrant C | 3,323,214 | 631,722 |
| Events in quadrant D | 5,672,691 | 574,925 |
| Mode M0 | |||
|---|---|---|---|
| Quadrant | BADHDUFLAG | Total packets | Discarded packets |
| A | 0 | 16542 | 3 |
| B | 0 | 20384 | 2 |
| C | 0 | 13987 | 2 |
| D | 0 | 21399 | 2 |
| Mode SS | |||
|---|---|---|---|
| Quadrant | BADHDUFLAG | Total packets | Discarded packets |
| A | 0 | 134 | 0 |
| B | 0 | 134 | 0 |
| C | 0 | 134 | 0 |
| D | 0 | 134 | 0 |
| Mode M9 | |||
|---|---|---|---|
| Quadrant | BADHDUFLAG | Total packets | Discarded packets |
| A | 0 | 26 | 0 |
| B | 0 | 26 | 0 |
| C | 0 | 26 | 0 |
| D | 0 | 26 | 0 |
| Quadrant | Total seconds | Saturated seconds | Saturation percentage |
|---|---|---|---|
| A | 6463 | 466 | 7.210274% |
| B | 6463 | 768 | 11.883026% |
| C | 6463 | 111 | 1.717469% |
| D | 6463 | 556 | 8.602816% |
Noise dominated data is calculated using 1-second bins in cleaned event files. If a bin has >2000 counts, and if more than 50% of those come from <1% of pixels, then it is considered to be noise-dominated and hence unusable.
| Quadrant | # 1 sec bins | Bins with >0 counts | Bins with >2000 counts | High rate bins dominated by noise | Noise dominated (total time) | Noise dominated (detector-on time) | Marked lightcurve |
|---|---|---|---|---|---|---|---|
| A | 9103 | 6465 | 326 | 326 | 3.58% | 5.04% | 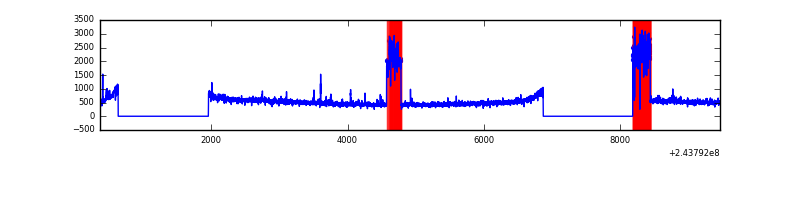 |
| B | 9103 | 6465 | 417 | 417 | 4.58% | 6.45% | 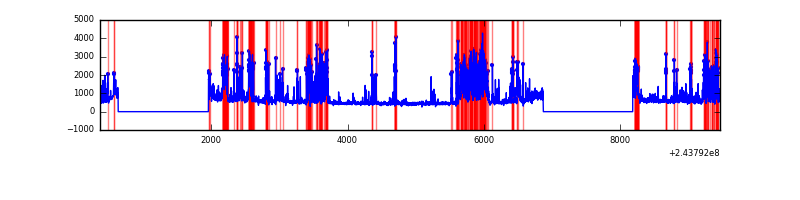 |
| C | 9103 | 6465 | 0 | 0 | 0.00% | 0.00% | 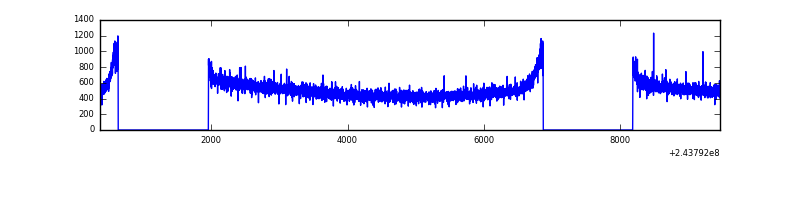 |
| D | 9103 | 6465 | 347 | 347 | 3.81% | 5.37% | 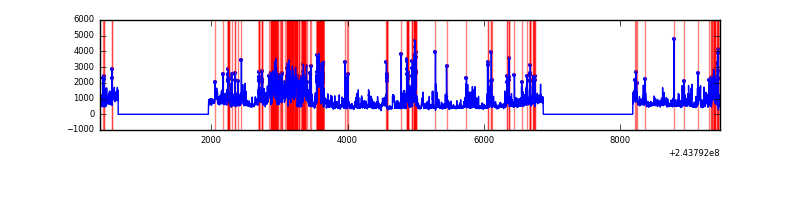 |
Top three noisy pixels from each quadrant. If the there are fewer than three noisy pixels in the level2.evt file, extra rows are filled as -1
| Pixel properties | Quadrant properties | ||||||
|---|---|---|---|---|---|---|---|
| Quadrant | DetID | PixID | Counts | Sigma | Mean | Median | Sigma |
| A | 15 | 239 | 855768 | 5044.76 | 832 | 817 | 169.5 |
| A | 13 | 251 | 35279 | 203.35 | 832 | 817 | 169.5 |
| A | 14 | 254 | 31362 | 180.24 | 832 | 817 | 169.5 |
| B | 4 | 239 | 2003808 | 12693.52 | 829 | 812 | 157.8 |
| B | 15 | 204 | 42853 | 266.43 | 829 | 812 | 157.8 |
| B | 0 | 197 | 39545 | 245.46 | 829 | 812 | 157.8 |
| C | 13 | 61 | 6217 | 27.26 | 851 | 856 | 196.6 |
| C | 8 | 222 | 2728 | 9.52 | 851 | 856 | 196.6 |
| C | 14 | 234 | 2489 | 8.3 | 851 | 856 | 196.6 |
| D | 2 | 16 | 922305 | 4699.51 | 820 | 799 | 196.1 |
| D | 1 | 52 | 497094 | 2531.02 | 820 | 799 | 196.1 |
| D | 7 | 71 | 273748 | 1391.99 | 820 | 799 | 196.1 |
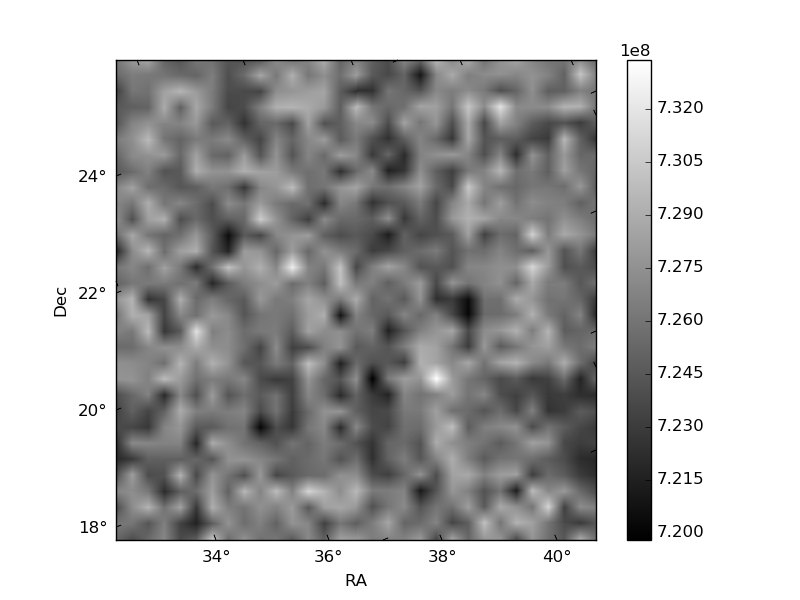
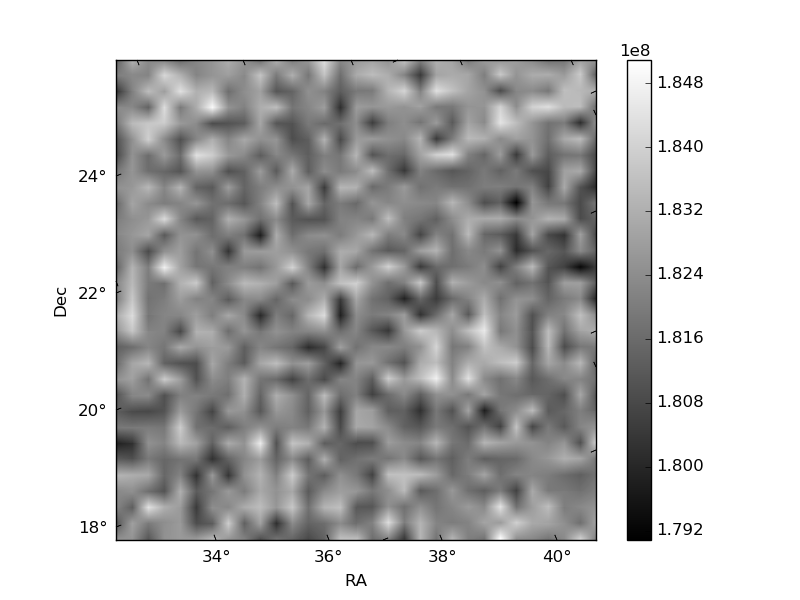
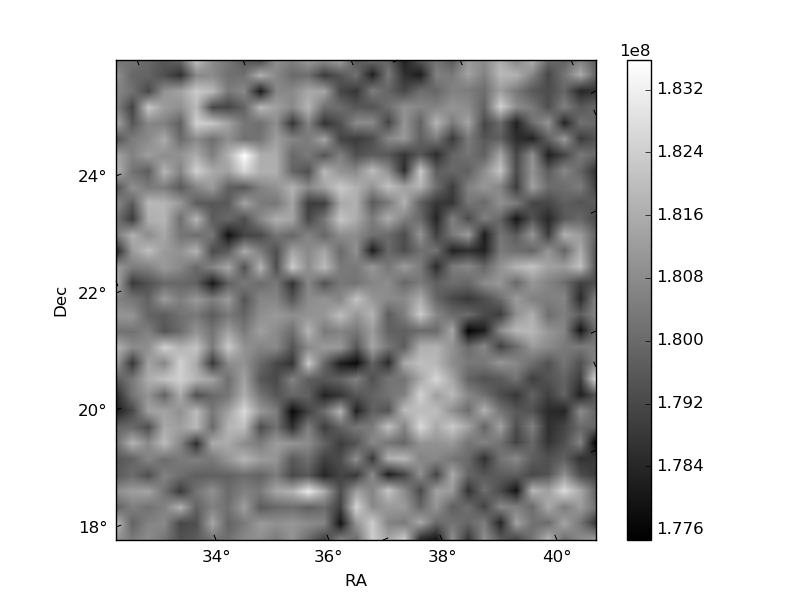
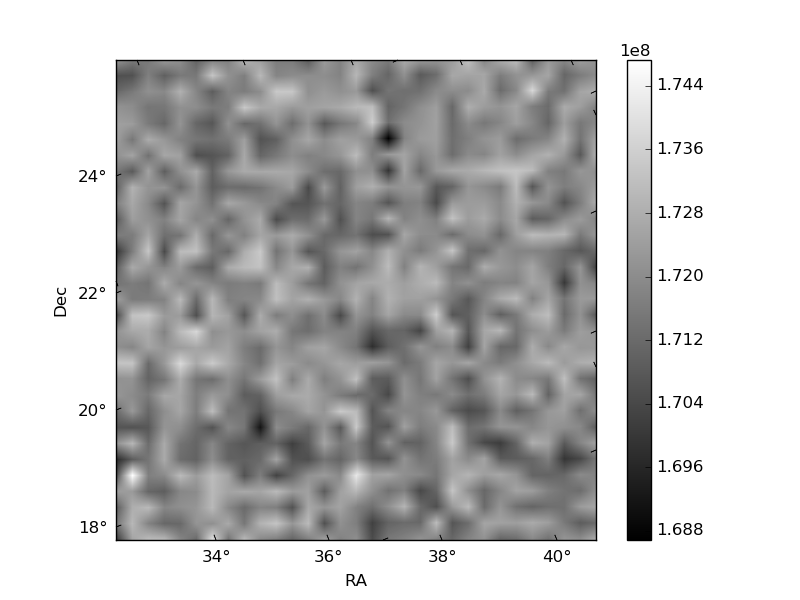
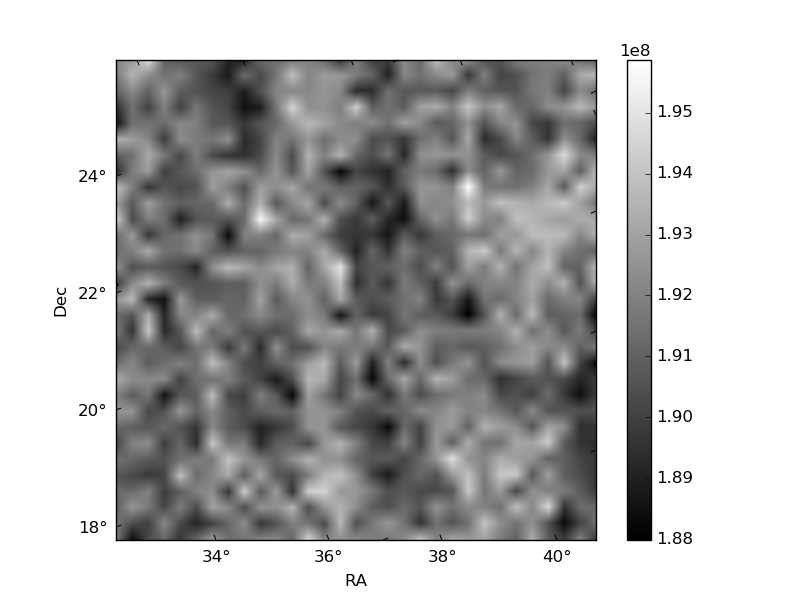
Histogram calculated using DETX and DETY for each event in the final _common_clean file
| Quadrant A | 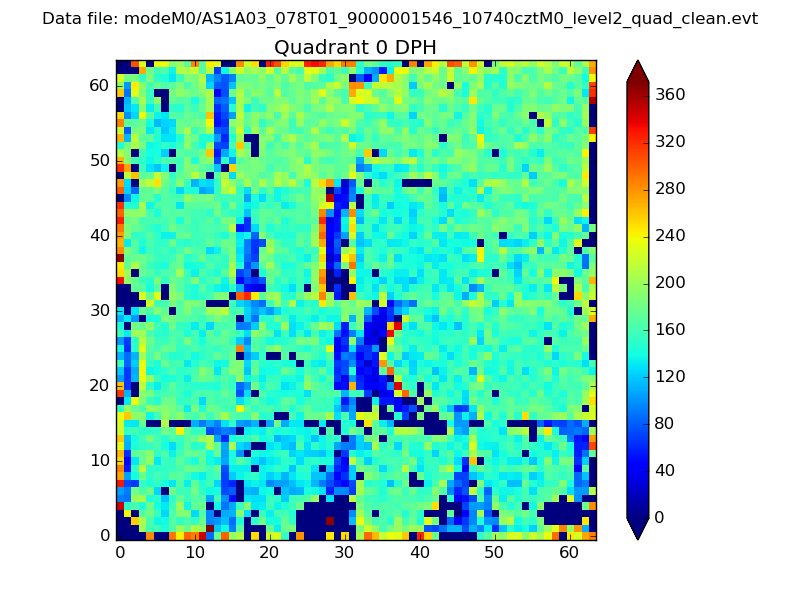 |
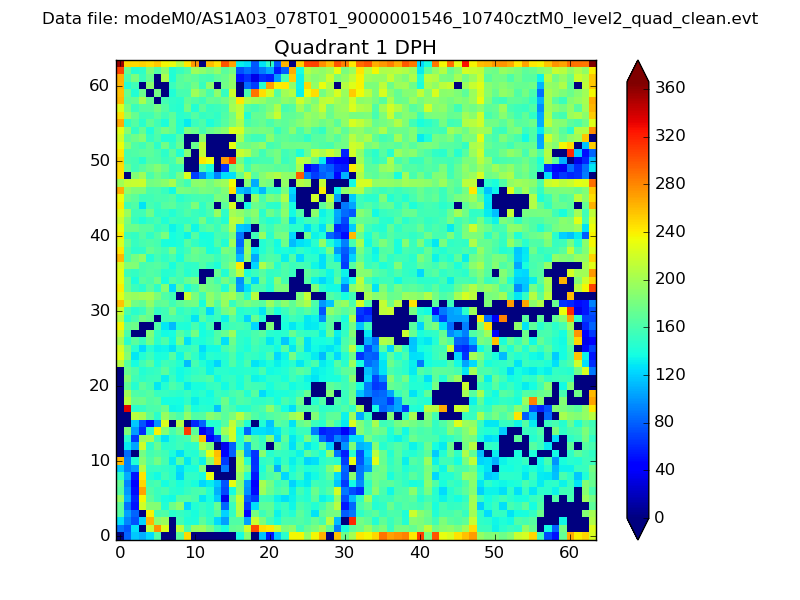 |
Quadrant B |
|---|---|---|---|
| Quadrant D | 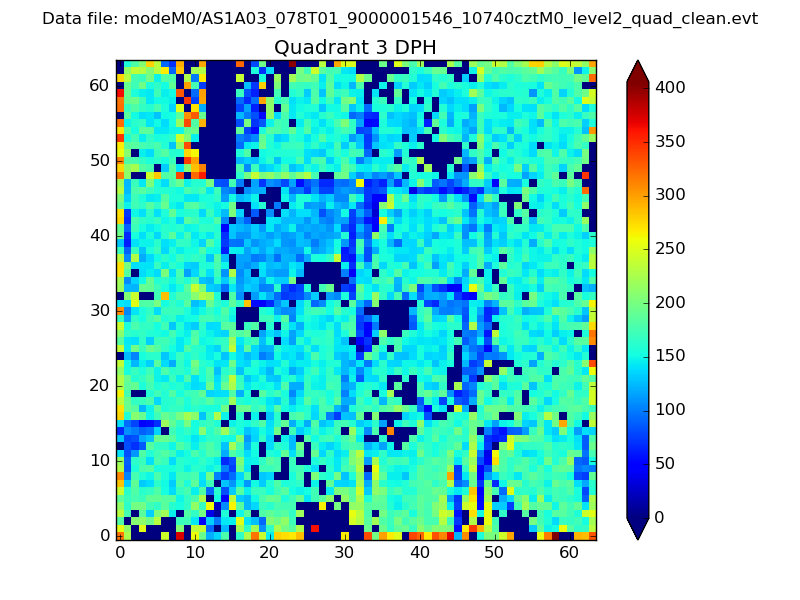 |
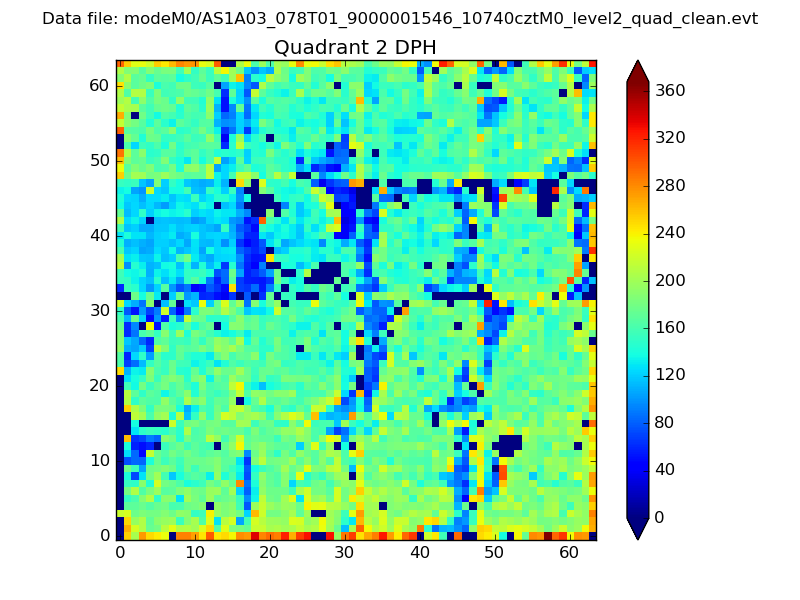 |
Quadrant C |
| Plot type | Count rate plots | Images |
|---|---|---|
| Comparison with Poisson distribution Blue bars denote a histogram of data divided into 1 sec bins. Red curve is a Poisson curve with rate = median count rate of data. |
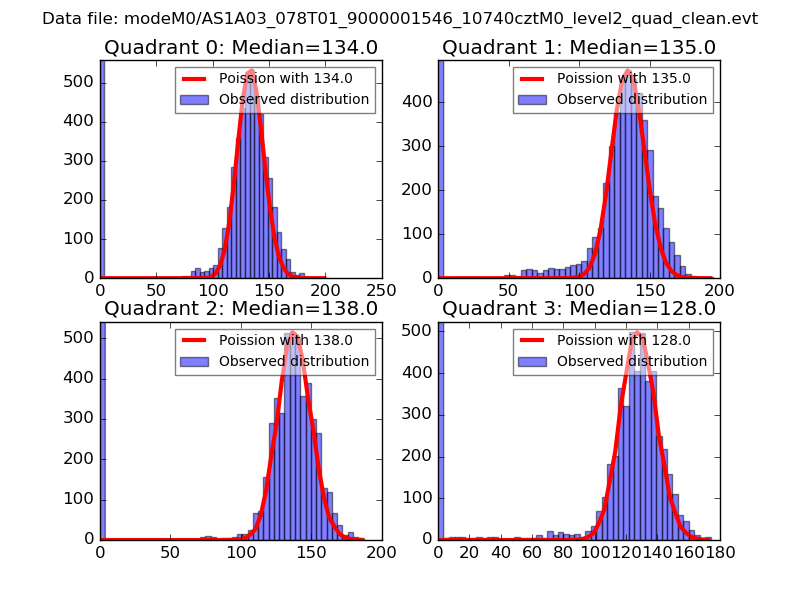 |
 |
| Quadrant-wise count rates Data is divided into 100 sec bins |
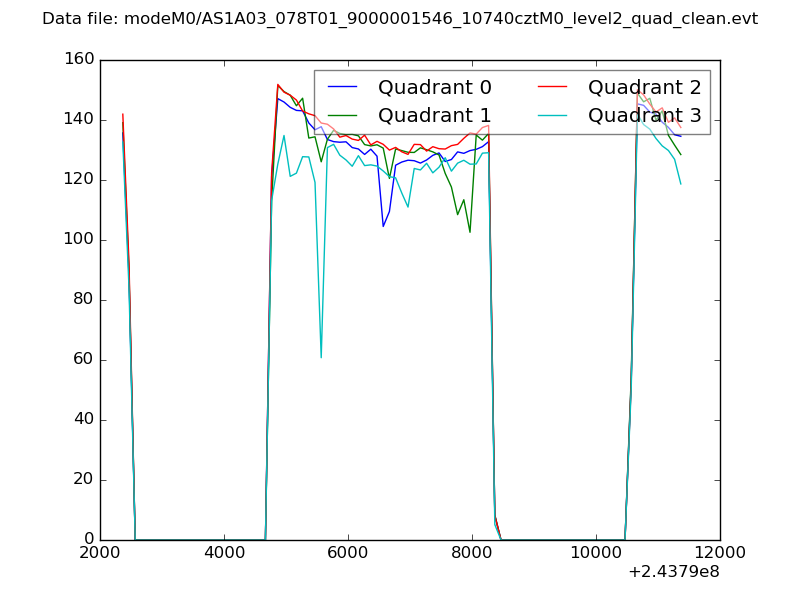 |
|
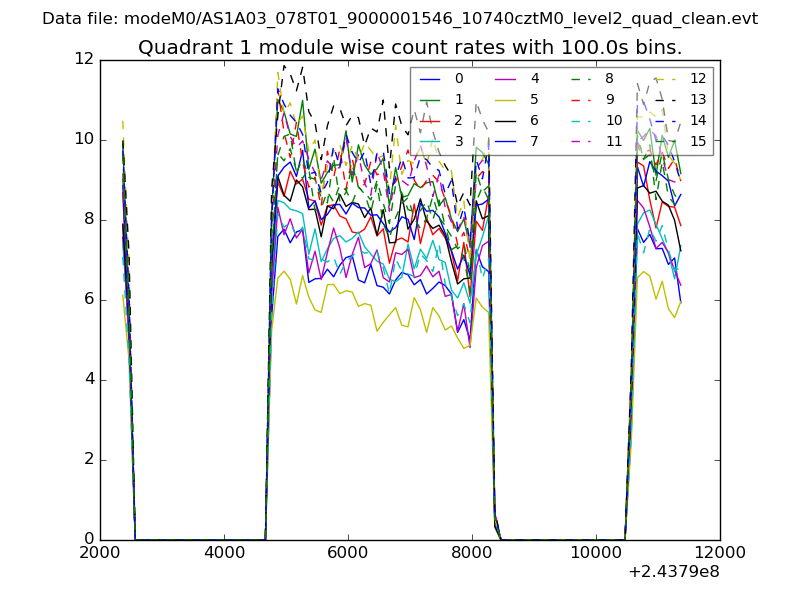
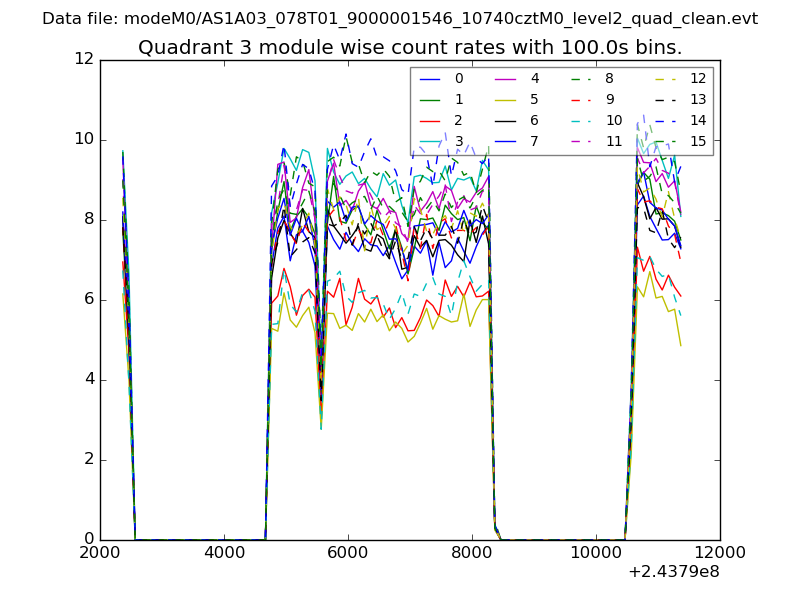
| Module-wise count rates for Quadrant A Data is divided into 100 sec bins |
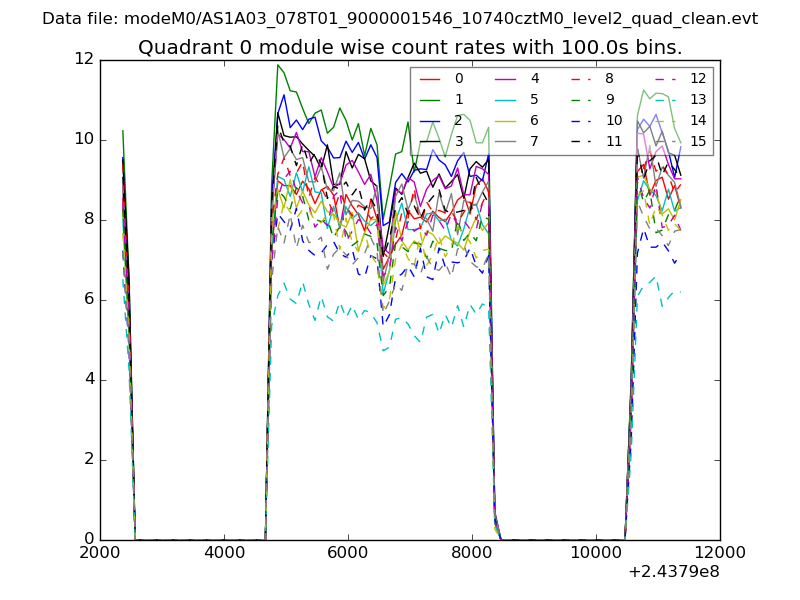 |
 |
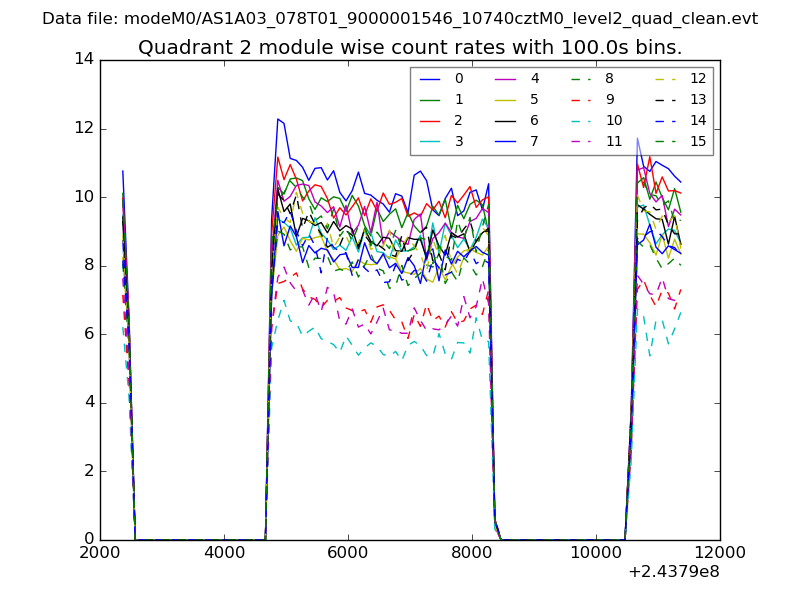
| Module-wise count rates for Quadrant B Data is divided into 100 sec bins |
 |
 |
| Module-wise count rates for Quadrant C Data is divided into 100 sec bins |
 |
 |
| Module-wise count rates for Quadrant D Data is divided into 100 sec bins |
 |
 |
| Parameter | Plot |
|---|---|
| CZT HV Monitor | 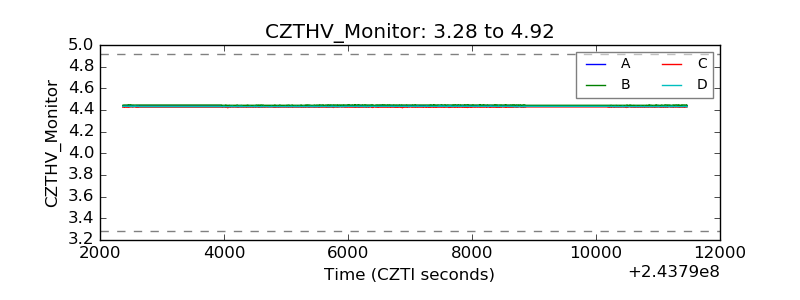 |
| D_VDD | 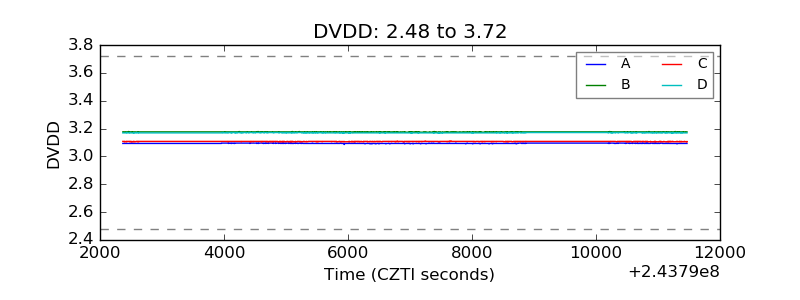 |
| Temperature 1 | 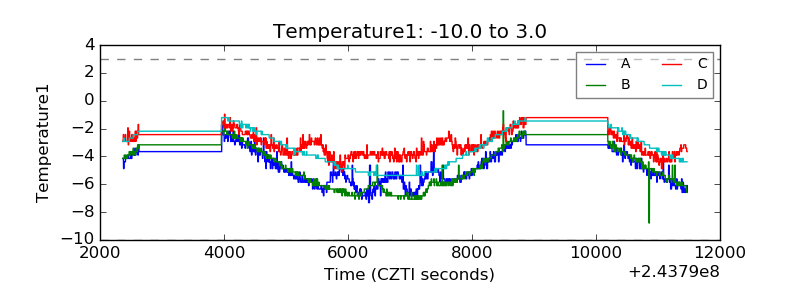 |
| Veto HV Monitor | 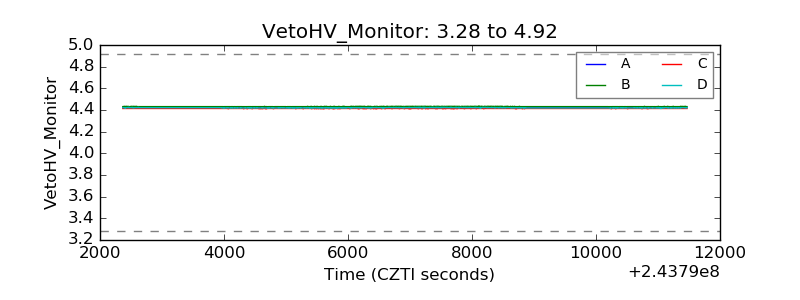 |
| Veto LLD |  |
| Alpha Counter | 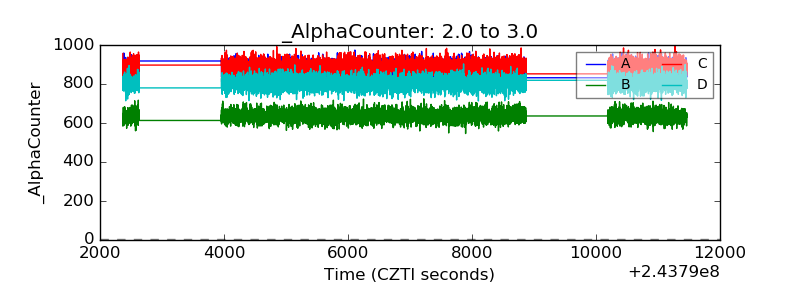 |
| _CPM_Rate | 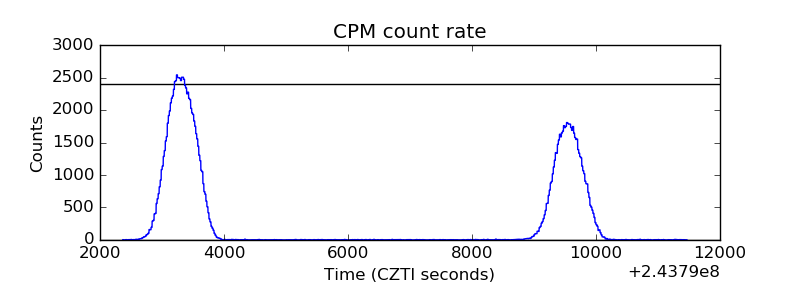 |
| CZT Counter | 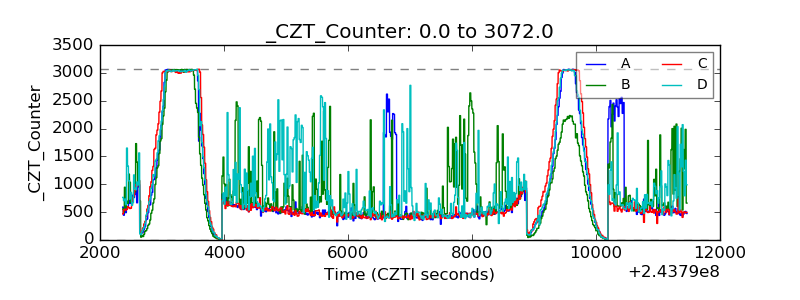 |
| +2.5 Volts monitor |  |
| +5 Volts monitor |  |
| _ROLL_ROT | 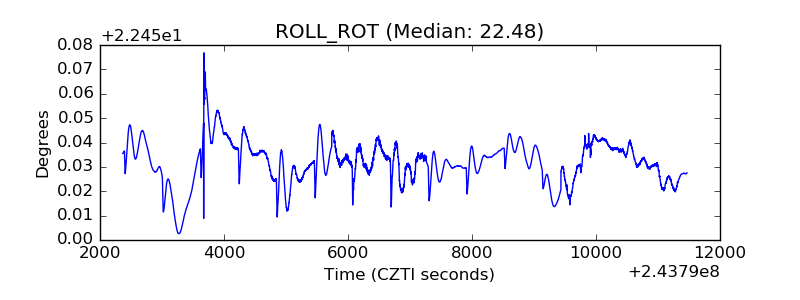 |
| _Roll_DEC | 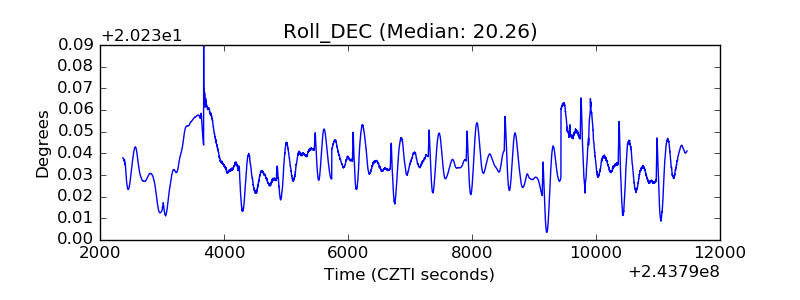 |
| _Roll_RA | 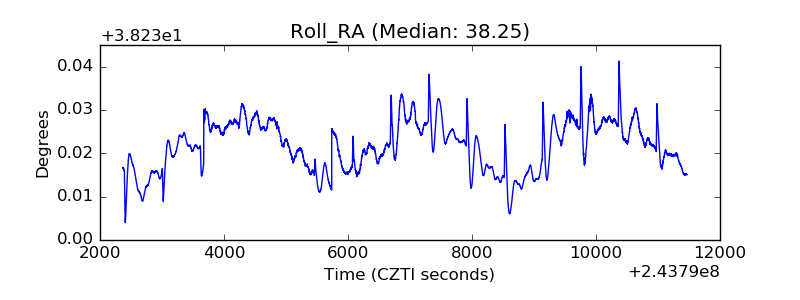 |
| Veto Counter | 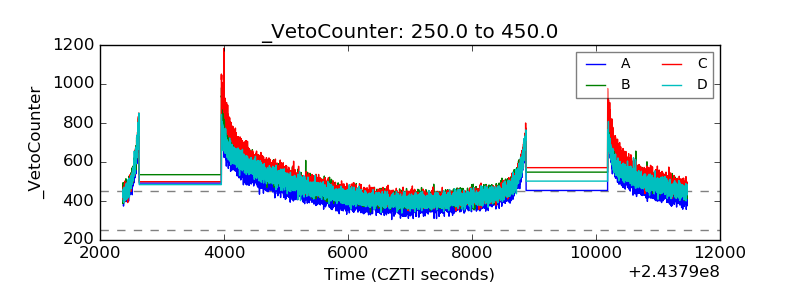 |