| Param | Original file | Final file |
|---|---|---|
| Filename | modeM0/AS1A03_078T01_9000001546_10741cztM0_level2.evt | modeM0/AS1A03_078T01_9000001546_10741cztM0_level2_quad_clean.evt |
| Size (bytes) | 595,296,000 | 97,035,840 |
| Size | 567.7 MB | 92.5 MB |
| Events in quadrant A | 4,659,058 | 623,634 |
| Events in quadrant B | 4,229,941 | 645,234 |
| Events in quadrant C | 3,050,579 | 651,368 |
| Events in quadrant D | 5,657,033 | 573,355 |
| Mode M0 | |||
|---|---|---|---|
| Quadrant | BADHDUFLAG | Total packets | Discarded packets |
| A | 0 | 17982 | 7 |
| B | 0 | 16941 | 8 |
| C | 0 | 13229 | 17 |
| D | 0 | 21313 | 4 |
| Mode SS | |||
|---|---|---|---|
| Quadrant | BADHDUFLAG | Total packets | Discarded packets |
| A | 0 | 132 | 0 |
| B | 0 | 132 | 0 |
| C | 0 | 132 | 0 |
| D | 0 | 132 | 0 |
| Mode M9 | |||
|---|---|---|---|
| Quadrant | BADHDUFLAG | Total packets | Discarded packets |
| A | 0 | 15 | 0 |
| B | 0 | 15 | 0 |
| C | 0 | 15 | 0 |
| D | 0 | 16 | 0 |
| Quadrant | Total seconds | Saturated seconds | Saturation percentage |
|---|---|---|---|
| A | 6365 | 597 | 9.379419% |
| B | 6365 | 357 | 5.608798% |
| C | 6360 | 25 | 0.393082% |
| D | 6366 | 811 | 12.739554% |
Noise dominated data is calculated using 1-second bins in cleaned event files. If a bin has >2000 counts, and if more than 50% of those come from <1% of pixels, then it is considered to be noise-dominated and hence unusable.
| Quadrant | # 1 sec bins | Bins with >0 counts | Bins with >2000 counts | High rate bins dominated by noise | Noise dominated (total time) | Noise dominated (detector-on time) | Marked lightcurve |
|---|---|---|---|---|---|---|---|
| A | 7627 | 6368 | 565 | 565 | 7.41% | 8.87% | 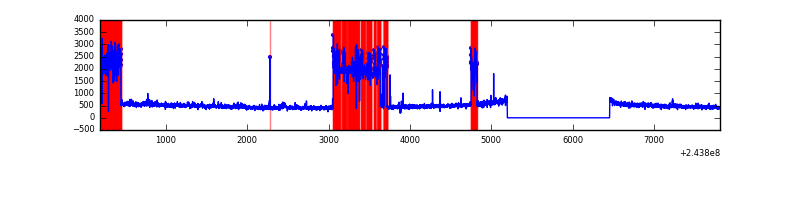 |
| B | 7627 | 6368 | 181 | 181 | 2.37% | 2.84% |  |
| C | 7627 | 6368 | 0 | 0 | 0.00% | 0.00% | 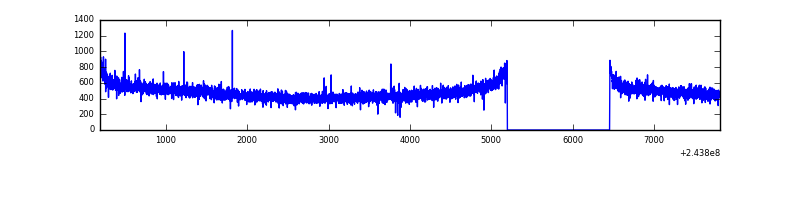 |
| D | 7627 | 6368 | 663 | 663 | 8.69% | 10.41% | 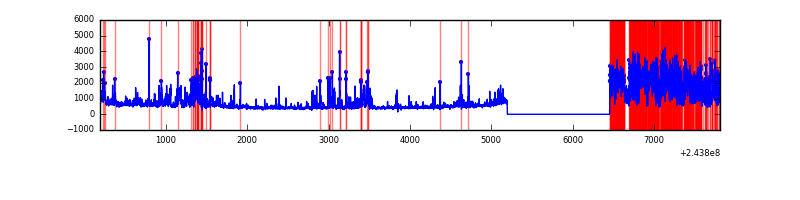 |
Top three noisy pixels from each quadrant. If the there are fewer than three noisy pixels in the level2.evt file, extra rows are filled as -1
| Pixel properties | Quadrant properties | ||||||
|---|---|---|---|---|---|---|---|
| Quadrant | DetID | PixID | Counts | Sigma | Mean | Median | Sigma |
| A | 15 | 239 | 1668284 | 10931.94 | 759 | 743 | 152.5 |
| A | 13 | 251 | 21972 | 139.17 | 759 | 743 | 152.5 |
| A | 14 | 254 | 13933 | 86.47 | 759 | 743 | 152.5 |
| B | 4 | 239 | 1001170 | 6754.92 | 782 | 764 | 148.1 |
| B | 0 | 214 | 71609 | 478.36 | 782 | 764 | 148.1 |
| B | 3 | 189 | 44001 | 291.94 | 782 | 764 | 148.1 |
| C | 13 | 61 | 5665 | 26.98 | 781 | 787 | 180.8 |
| C | 14 | 67 | 3485 | 14.92 | 781 | 787 | 180.8 |
| C | 8 | 222 | 2311 | 8.43 | 781 | 787 | 180.8 |
| D | 2 | 16 | 2145070 | 12103.63 | 735 | 717 | 177.2 |
| D | 10 | 172 | 251145 | 1413.52 | 735 | 717 | 177.2 |
| D | 13 | 249 | 227238 | 1278.58 | 735 | 717 | 177.2 |
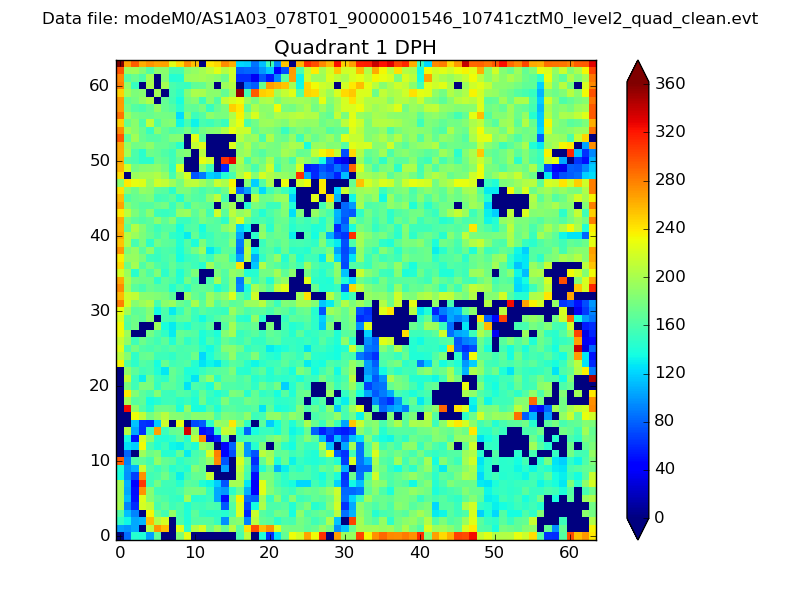
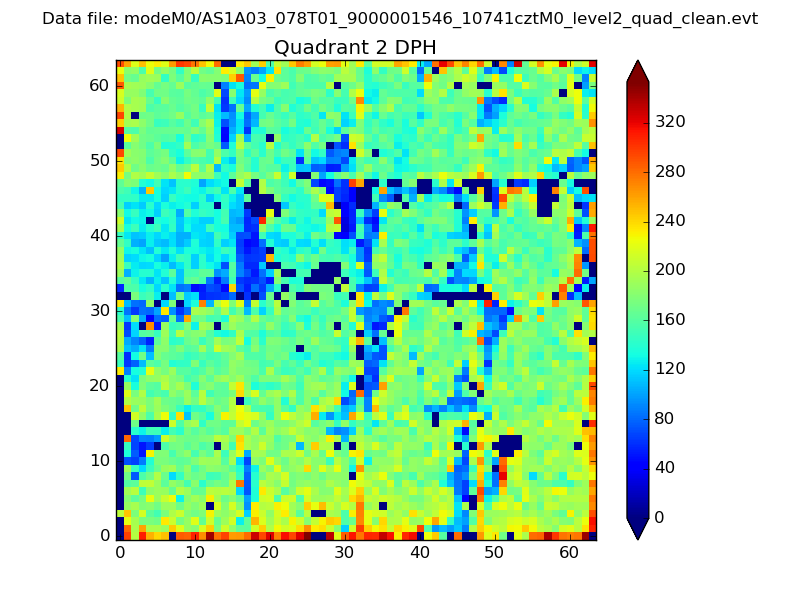
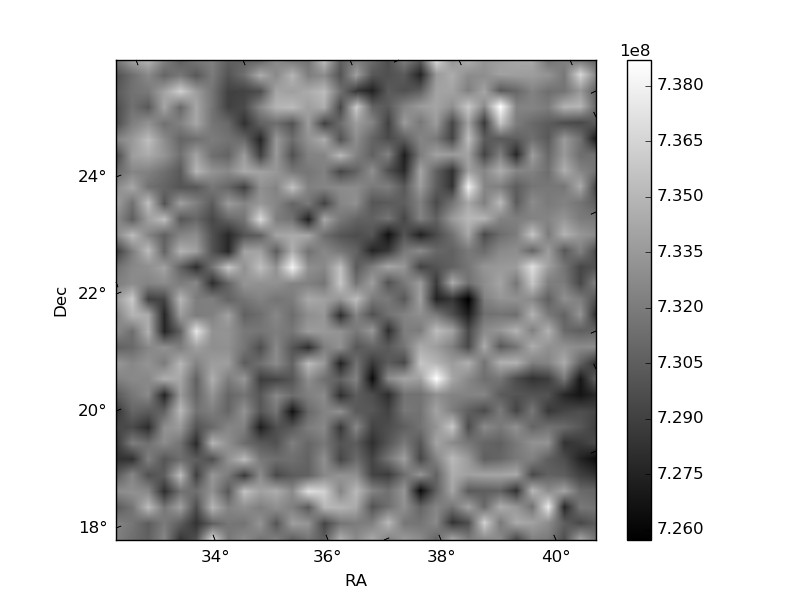
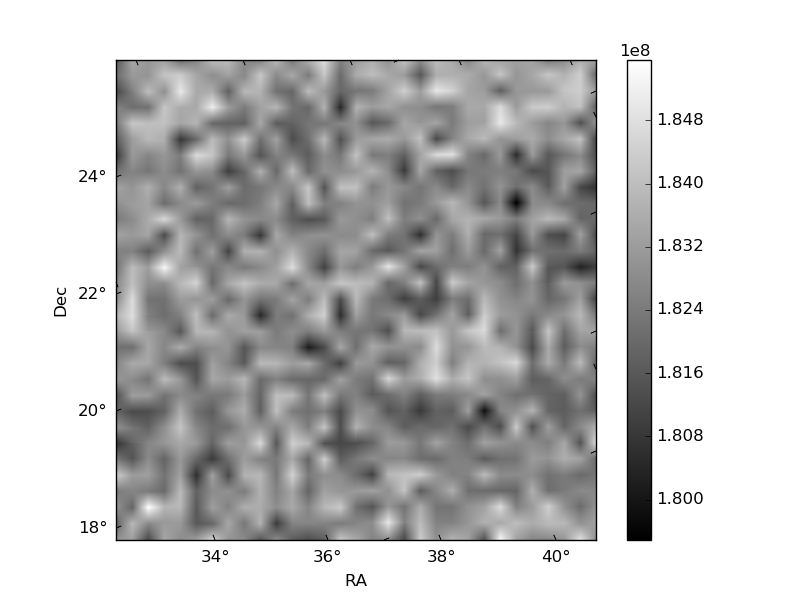
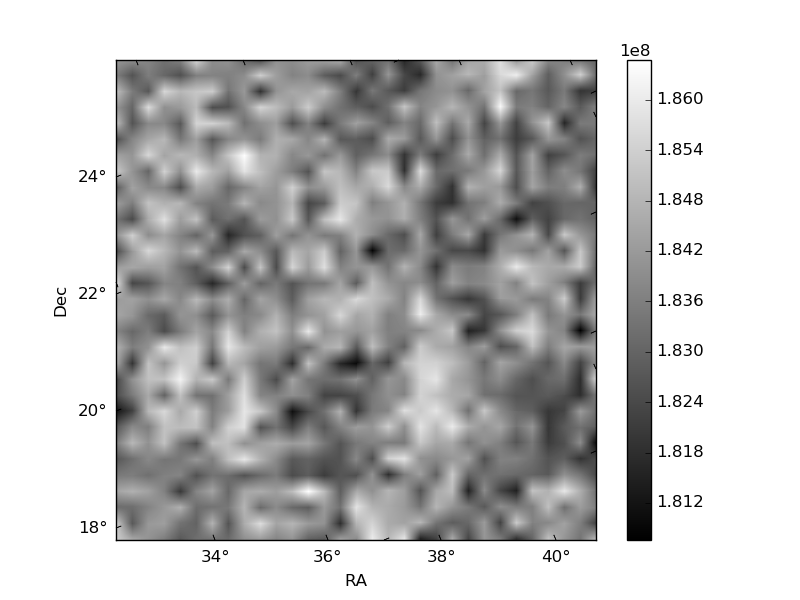
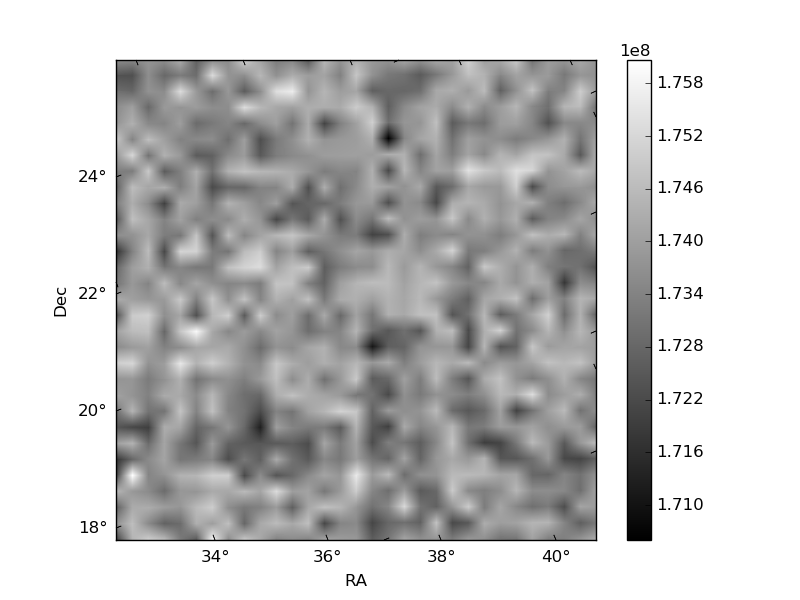
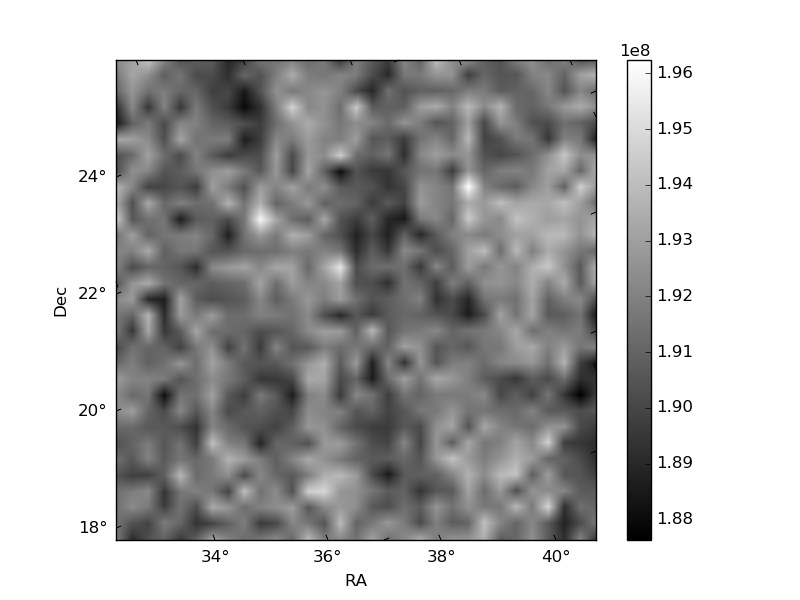
Histogram calculated using DETX and DETY for each event in the final _common_clean file
| Quadrant A | 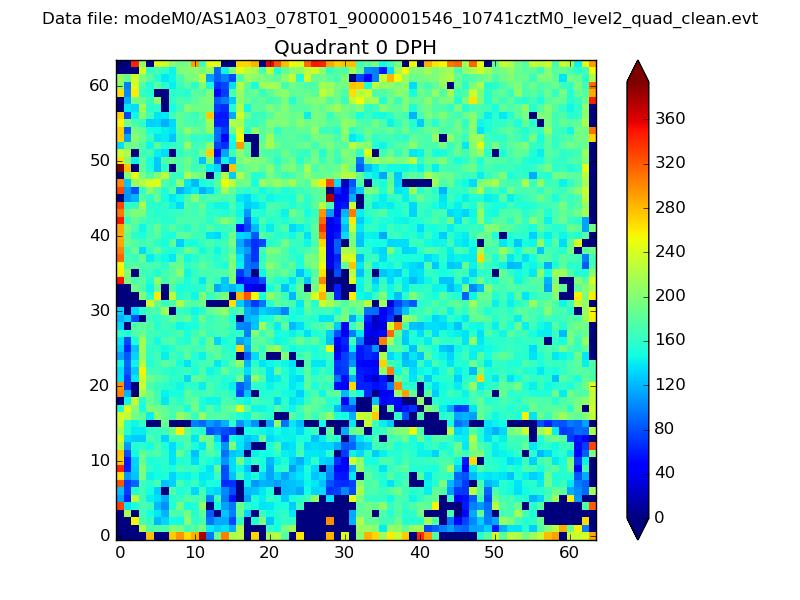 |
 |
Quadrant B |
|---|---|---|---|
| Quadrant D | 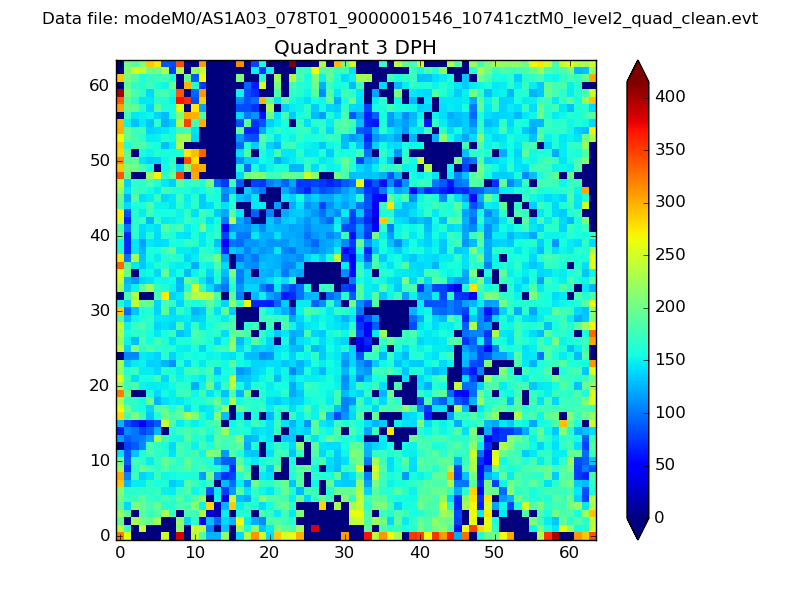 |
 |
Quadrant C |
| Plot type | Count rate plots | Images |
|---|---|---|
| Comparison with Poisson distribution Blue bars denote a histogram of data divided into 1 sec bins. Red curve is a Poisson curve with rate = median count rate of data. |
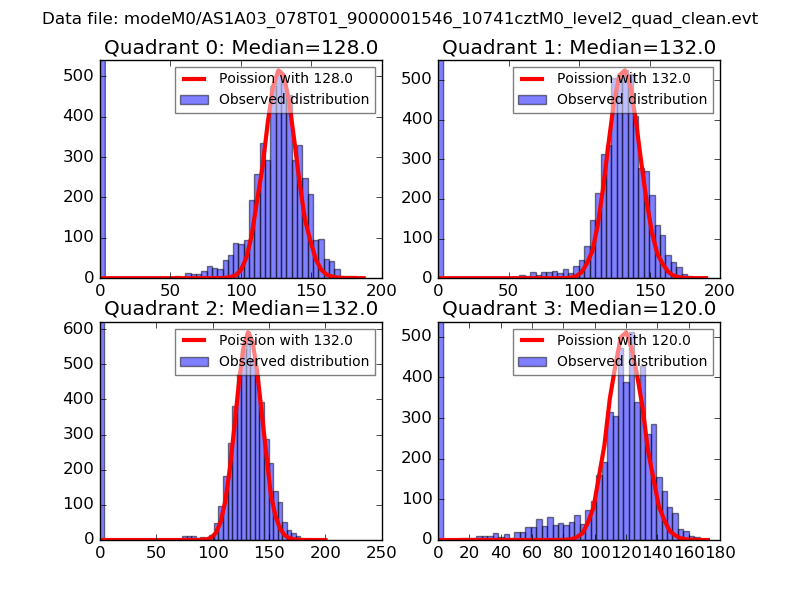 |
 |
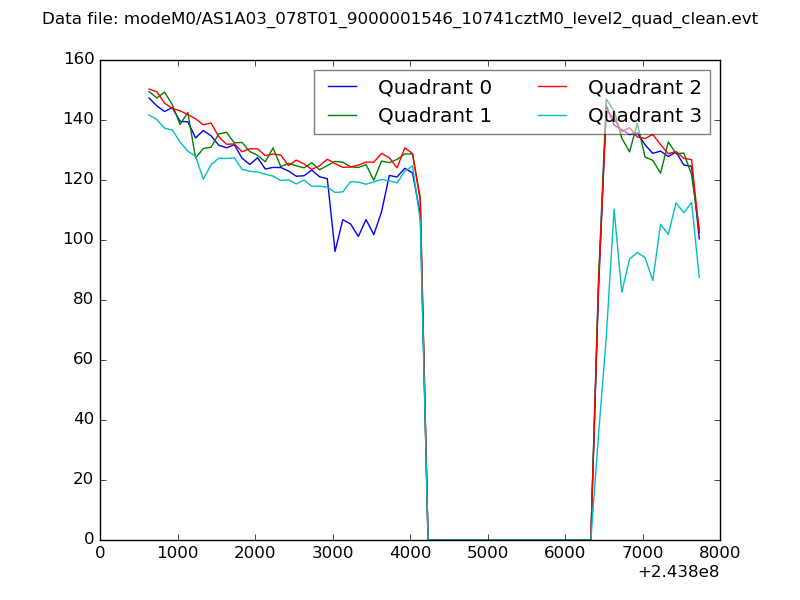
| Quadrant-wise count rates Data is divided into 100 sec bins |
 |
|
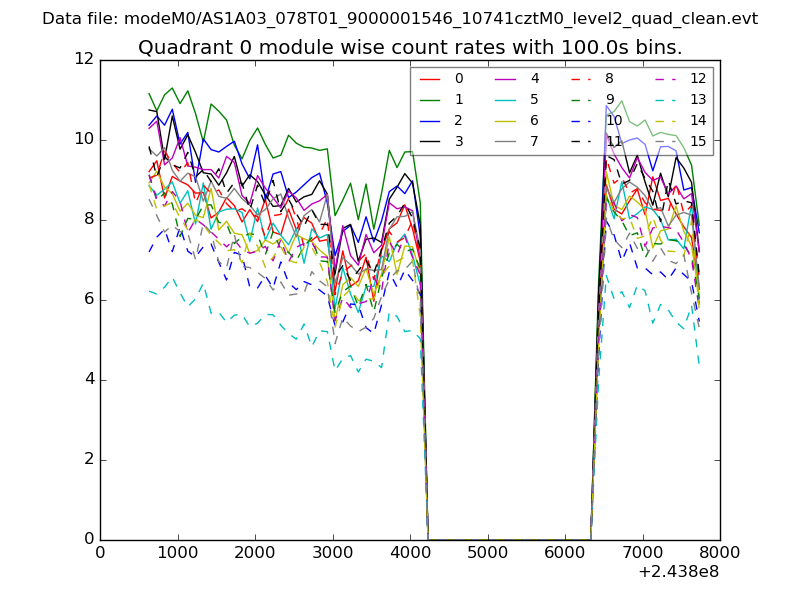
| Module-wise count rates for Quadrant A Data is divided into 100 sec bins |
 |
 |
| Module-wise count rates for Quadrant B Data is divided into 100 sec bins |
 |
 |
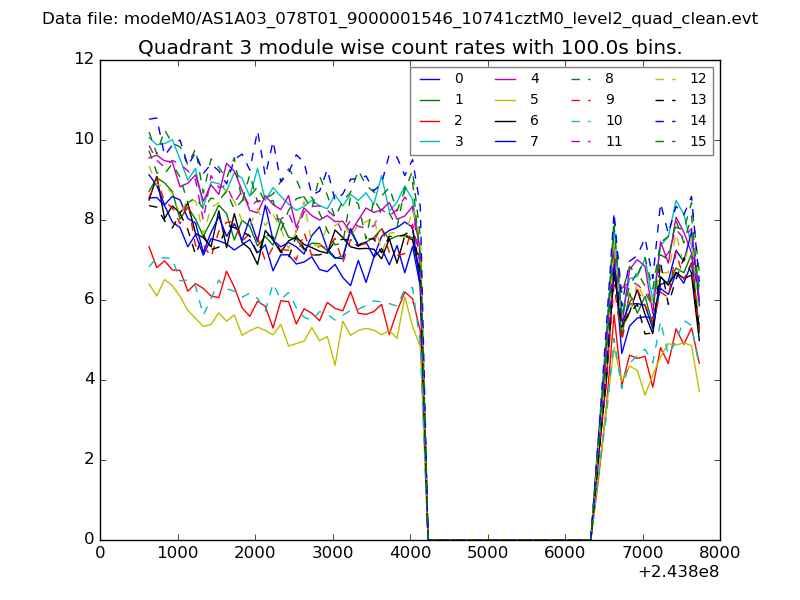
| Module-wise count rates for Quadrant C Data is divided into 100 sec bins |
 |
 |
| Module-wise count rates for Quadrant D Data is divided into 100 sec bins |
 |
 |
| Parameter | Plot |
|---|---|
| CZT HV Monitor | 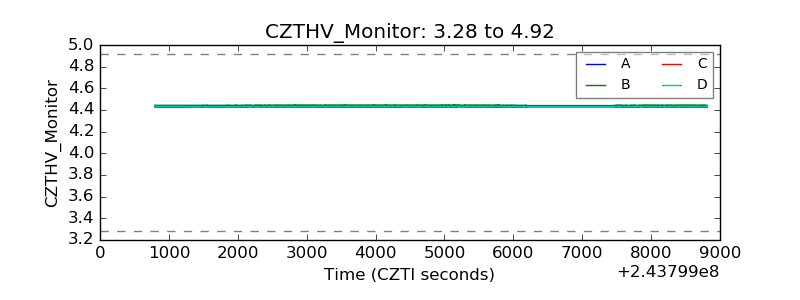 |
| D_VDD | 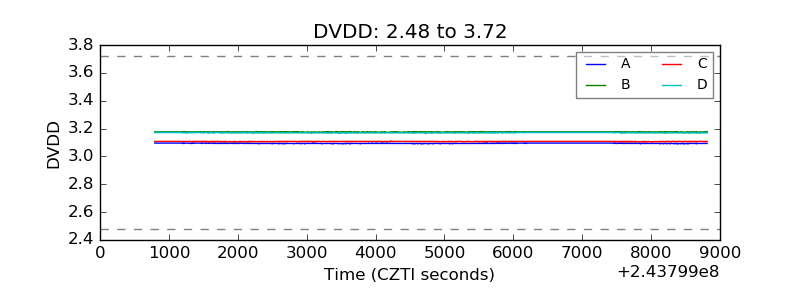 |
| Temperature 1 | 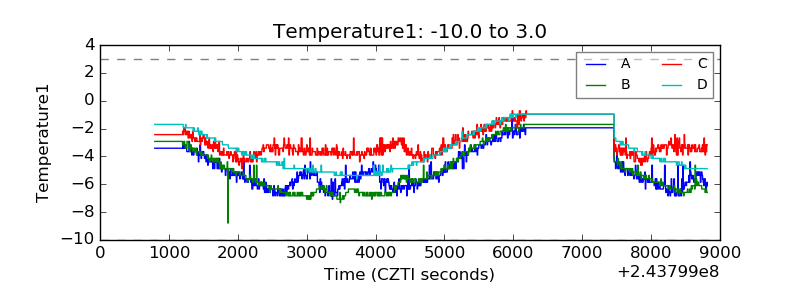 |
| Veto HV Monitor | 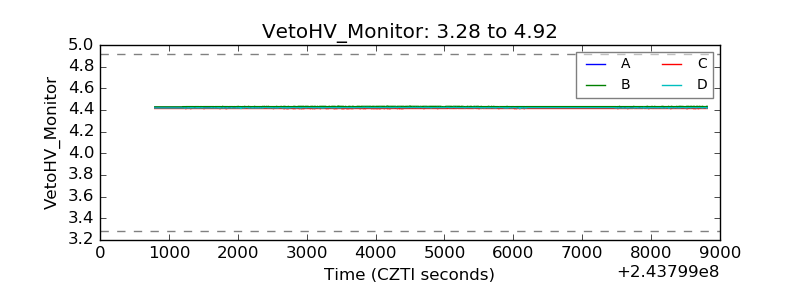 |
| Veto LLD | 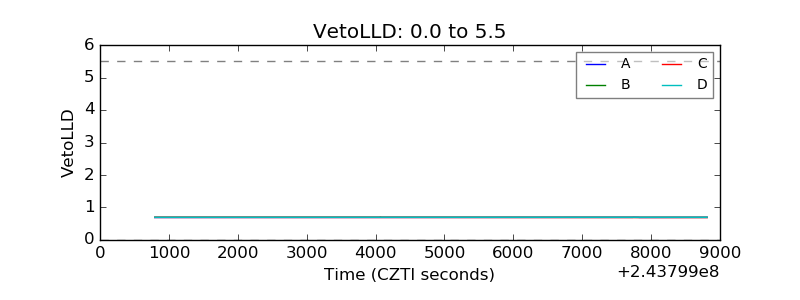 |
| Alpha Counter | 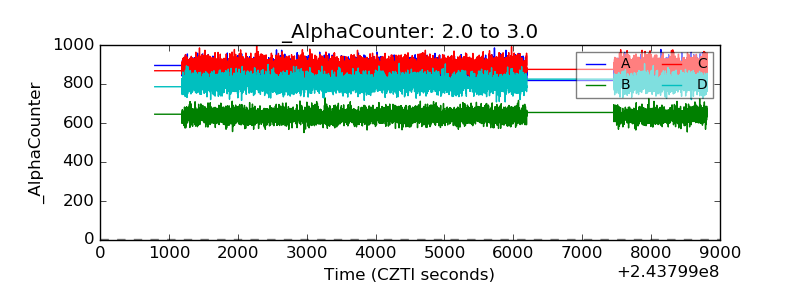 |
| _CPM_Rate | 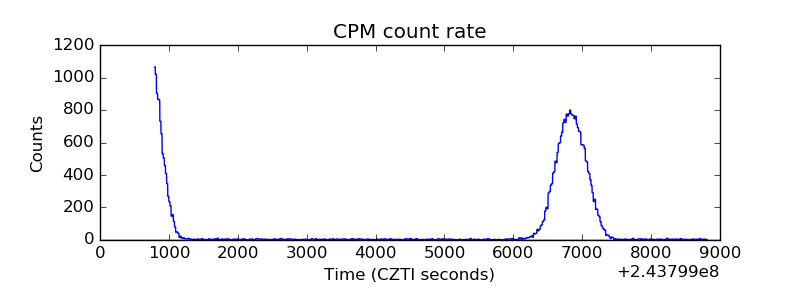 |
| CZT Counter | 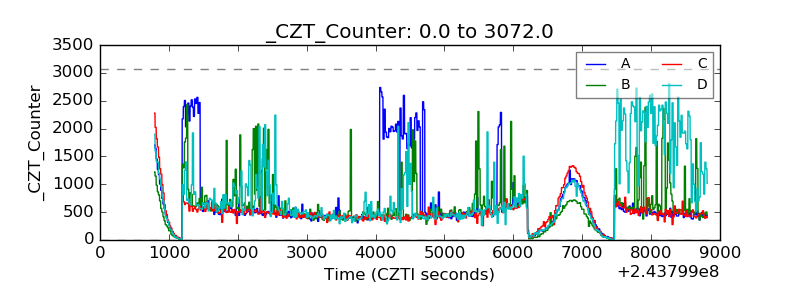 |
| +2.5 Volts monitor |  |
| +5 Volts monitor |  |
| _ROLL_ROT | 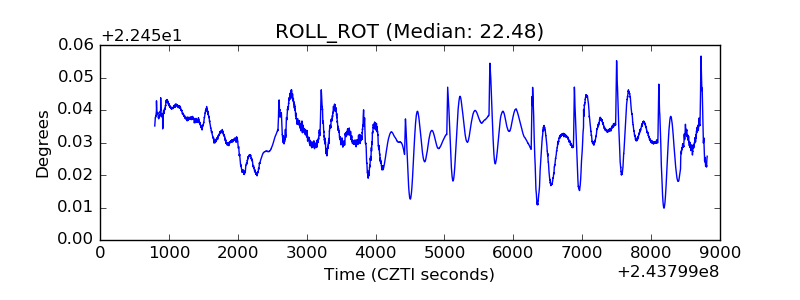 |
| _Roll_DEC | 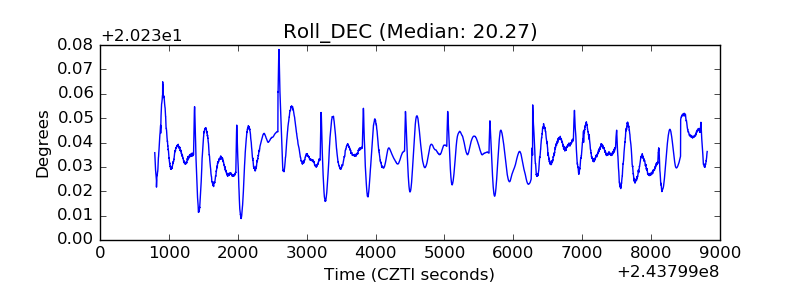 |
| _Roll_RA | 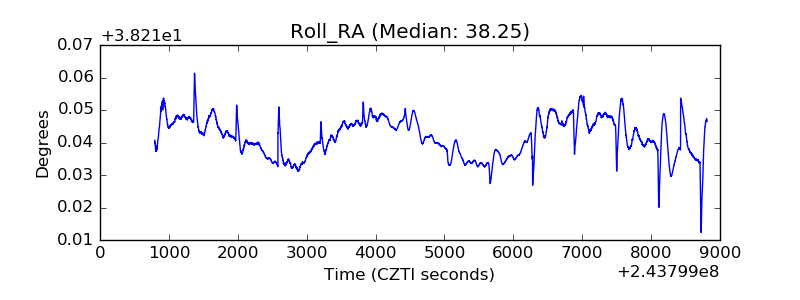 |
| Veto Counter | 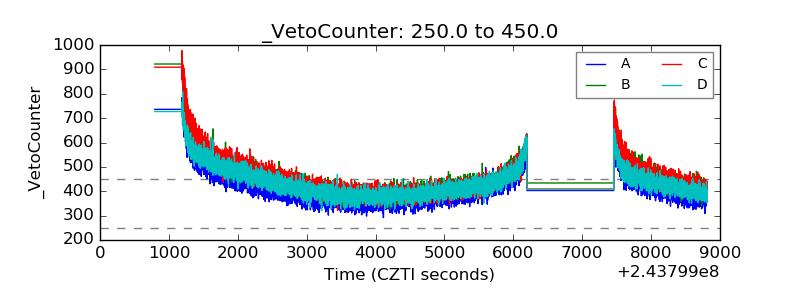 |