| Param | Original file | Final file |
|---|---|---|
| Filename | modeM0/AS1A03_078T01_9000001546_10745cztM0_level2.evt | modeM0/AS1A03_078T01_9000001546_10745cztM0_level2_quad_clean.evt |
| Size (bytes) | 742,245,120 | 105,854,400 |
| Size | 707.9 MB | 101.0 MB |
| Events in quadrant A | 5,002,465 | 676,039 |
| Events in quadrant B | 4,401,243 | 694,824 |
| Events in quadrant C | 3,630,959 | 699,437 |
| Events in quadrant D | 8,910,617 | 586,581 |
| Mode M0 | |||
|---|---|---|---|
| Quadrant | BADHDUFLAG | Total packets | Discarded packets |
| A | 0 | 21161 | 758 |
| B | 0 | 18859 | 389 |
| C | 0 | 16904 | 317 |
| D | 0 | 33859 | 2013 |
| Mode SS | |||
|---|---|---|---|
| Quadrant | BADHDUFLAG | Total packets | Discarded packets |
| A | 0 | 164 | 0 |
| B | 0 | 164 | 6 |
| C | 0 | 164 | 2 |
| D | 0 | 164 | 0 |
| Mode M9 | |||
|---|---|---|---|
| Quadrant | BADHDUFLAG | Total packets | Discarded packets |
| A | 0 | 2 | 0 |
| B | 0 | 2 | 0 |
| C | 0 | 2 | 0 |
| D | 0 | 2 | 0 |
| Quadrant | Total seconds | Saturated seconds | Saturation percentage |
|---|---|---|---|
| A | 7880 | 634 | 8.045685% |
| B | 7924 | 373 | 4.707219% |
| C | 7936 | 85 | 1.071069% |
| D | 7747 | 1819 | 23.480057% |
Noise dominated data is calculated using 1-second bins in cleaned event files. If a bin has >2000 counts, and if more than 50% of those come from <1% of pixels, then it is considered to be noise-dominated and hence unusable.
| Quadrant | # 1 sec bins | Bins with >0 counts | Bins with >2000 counts | High rate bins dominated by noise | Noise dominated (total time) | Noise dominated (detector-on time) | Marked lightcurve |
|---|---|---|---|---|---|---|---|
| A | 8377 | 8045 | 215 | 215 | 2.57% | 2.67% | 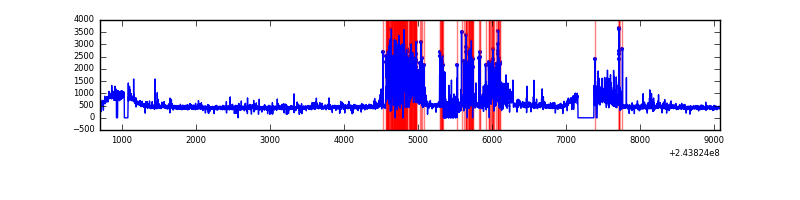 |
| B | 8377 | 8063 | 58 | 58 | 0.69% | 0.72% | 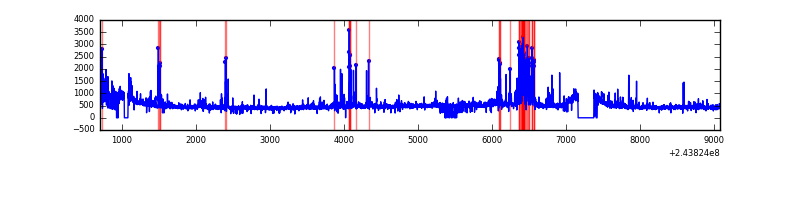 |
| C | 8377 | 8070 | 0 | 0 | 0.00% | 0.00% | 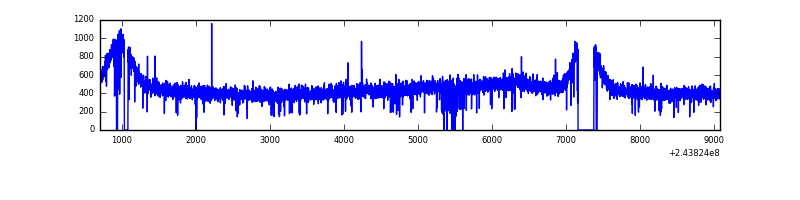 |
| D | 8377 | 7990 | 1260 | 1260 | 15.04% | 15.77% | 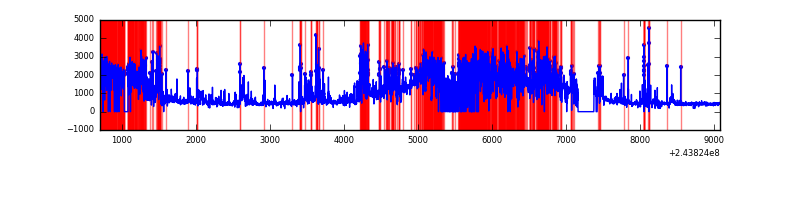 |
Top three noisy pixels from each quadrant. If the there are fewer than three noisy pixels in the level2.evt file, extra rows are filled as -1
| Pixel properties | Quadrant properties | ||||||
|---|---|---|---|---|---|---|---|
| Quadrant | DetID | PixID | Counts | Sigma | Mean | Median | Sigma |
| A | 15 | 239 | 1232267 | 6416.82 | 928 | 906 | 191.9 |
| A | 15 | 223 | 73968 | 380.74 | 928 | 906 | 191.9 |
| A | 14 | 254 | 44753 | 228.49 | 928 | 906 | 191.9 |
| B | 4 | 239 | 502629 | 2668.81 | 952 | 925 | 188.0 |
| B | 0 | 214 | 101717 | 536.16 | 952 | 925 | 188.0 |
| B | 15 | 204 | 39603 | 205.75 | 952 | 925 | 188.0 |
| C | 13 | 61 | 6919 | 27.3 | 930 | 935 | 219.2 |
| C | 8 | 222 | 3002 | 9.43 | 930 | 935 | 219.2 |
| C | 3 | 254 | 2816 | 8.58 | 930 | 935 | 219.2 |
| D | 2 | 16 | 3632473 | 18491.38 | 807 | 783 | 196.4 |
| D | 12 | 233 | 1443971 | 7348.24 | 807 | 783 | 196.4 |
| D | 1 | 52 | 351999 | 1788.28 | 807 | 783 | 196.4 |
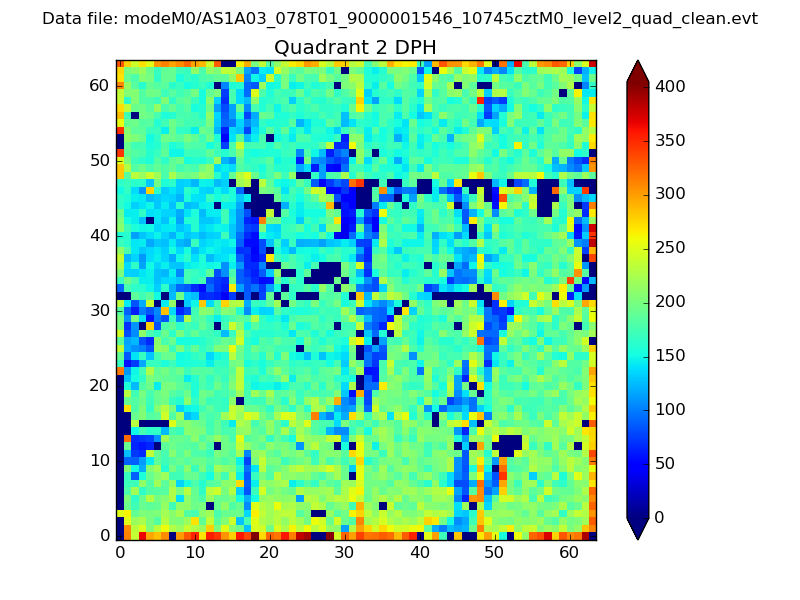
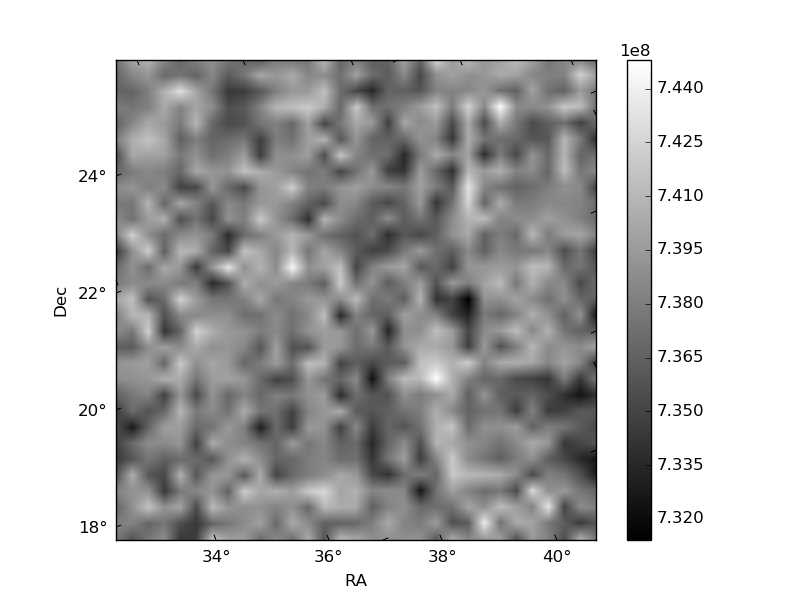
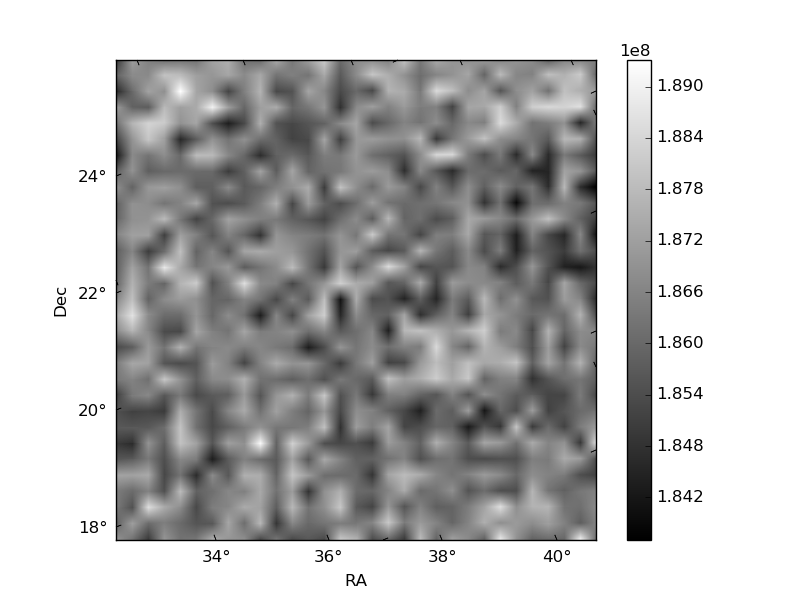
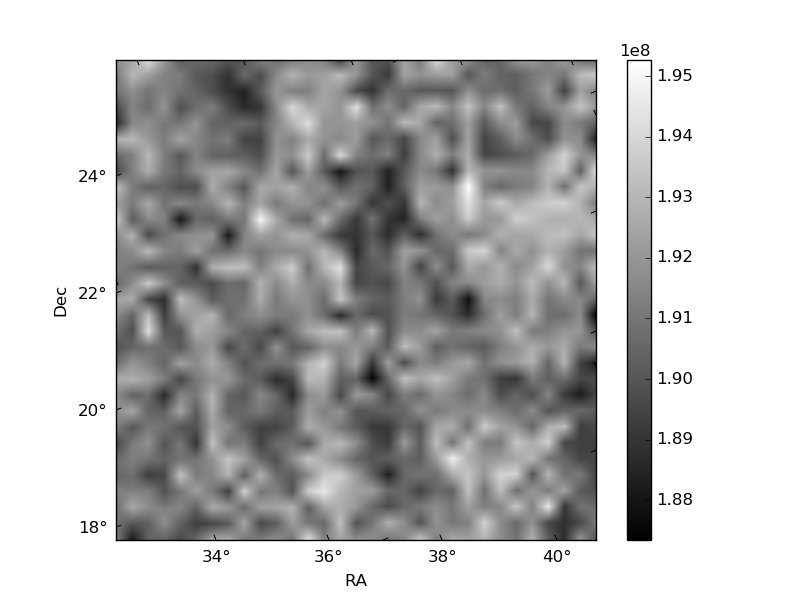
Histogram calculated using DETX and DETY for each event in the final _common_clean file
| Quadrant A | 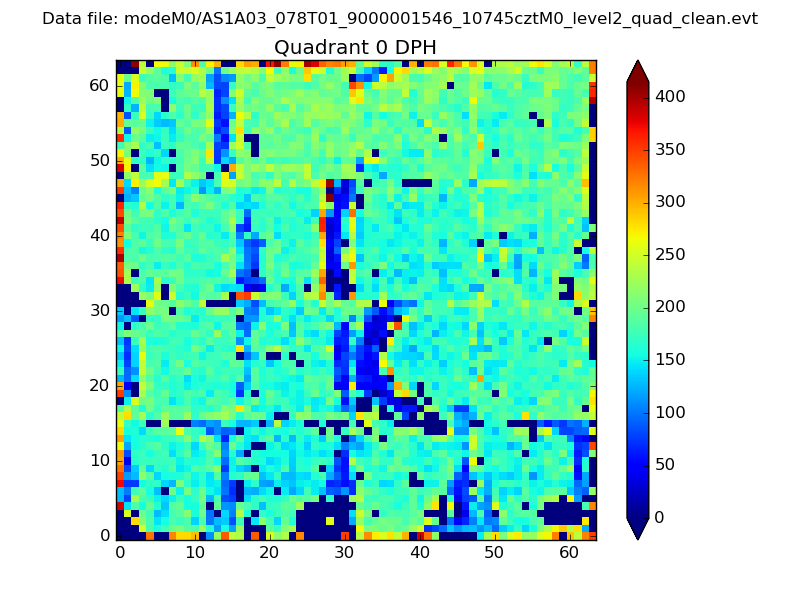 |
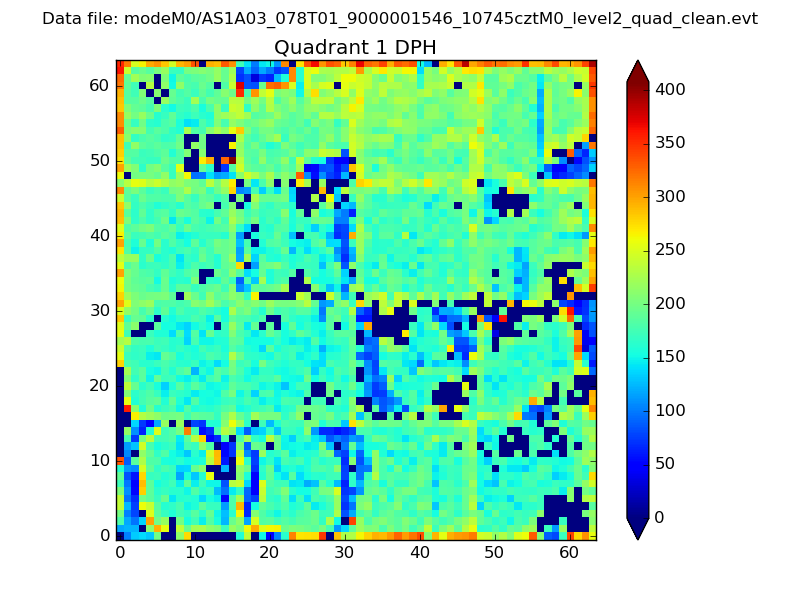 |
Quadrant B |
|---|---|---|---|
| Quadrant D | 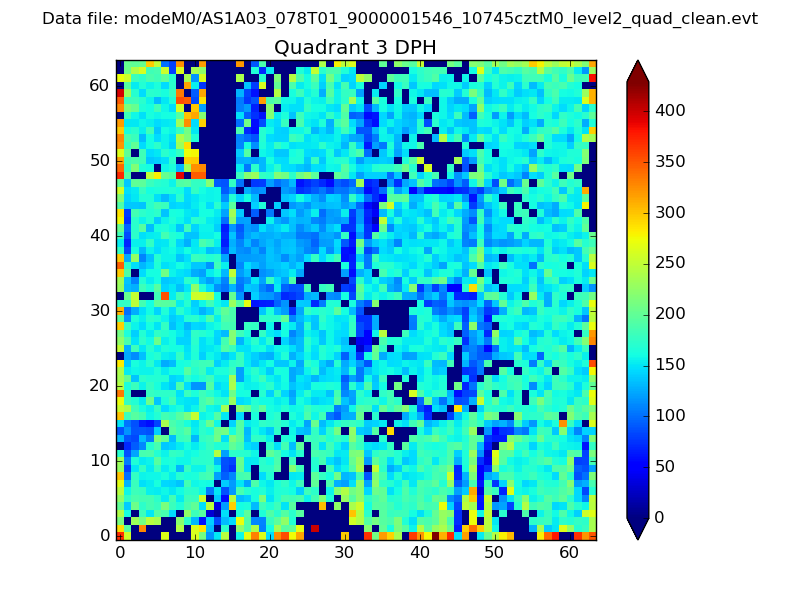 |
 |
Quadrant C |
| Plot type | Count rate plots | Images |
|---|---|---|
| Comparison with Poisson distribution Blue bars denote a histogram of data divided into 1 sec bins. Red curve is a Poisson curve with rate = median count rate of data. |
 |
 |
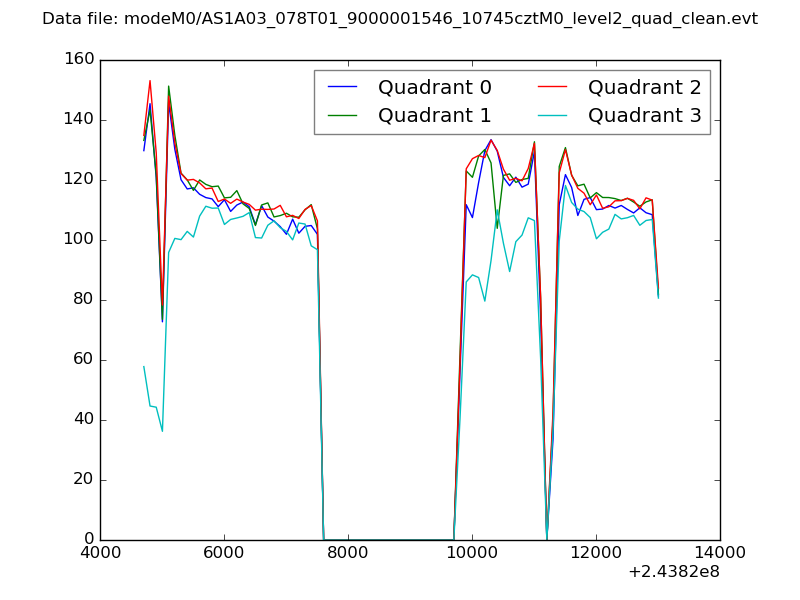
| Quadrant-wise count rates Data is divided into 100 sec bins |
 |
|
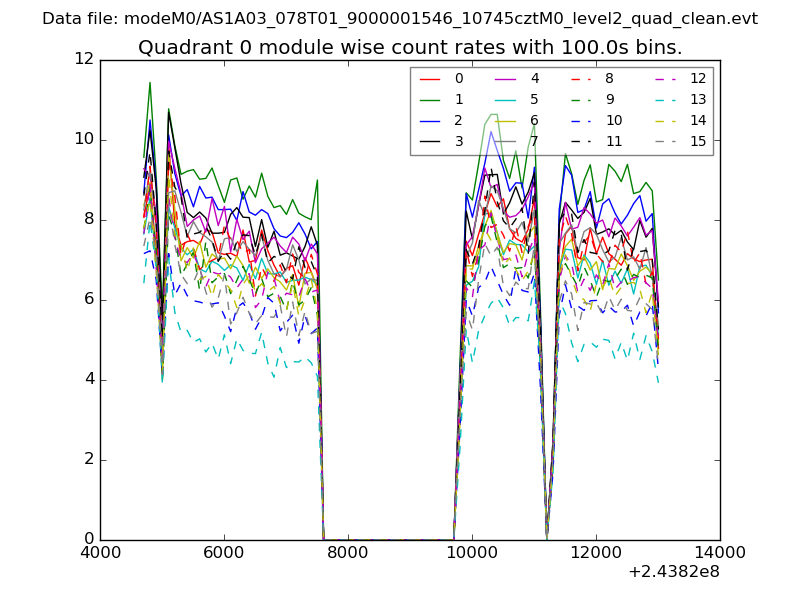
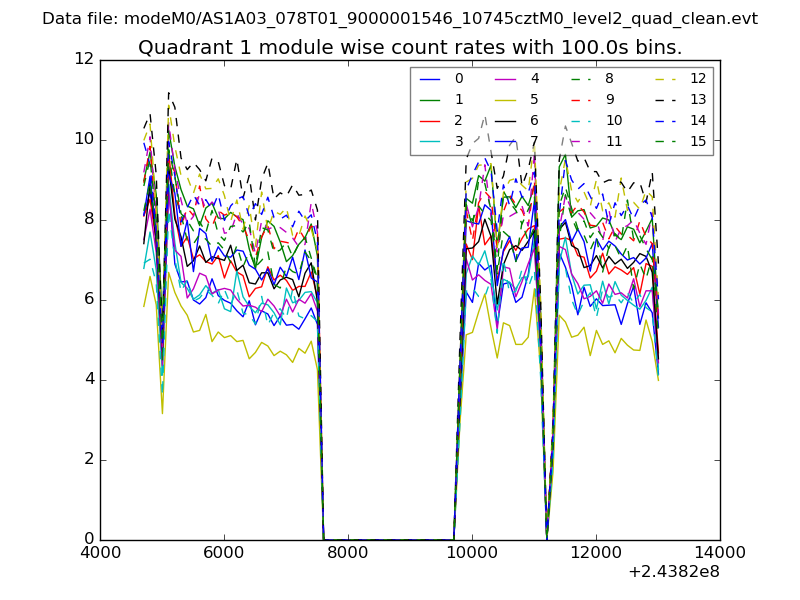
| Module-wise count rates for Quadrant A Data is divided into 100 sec bins |
 |
 |
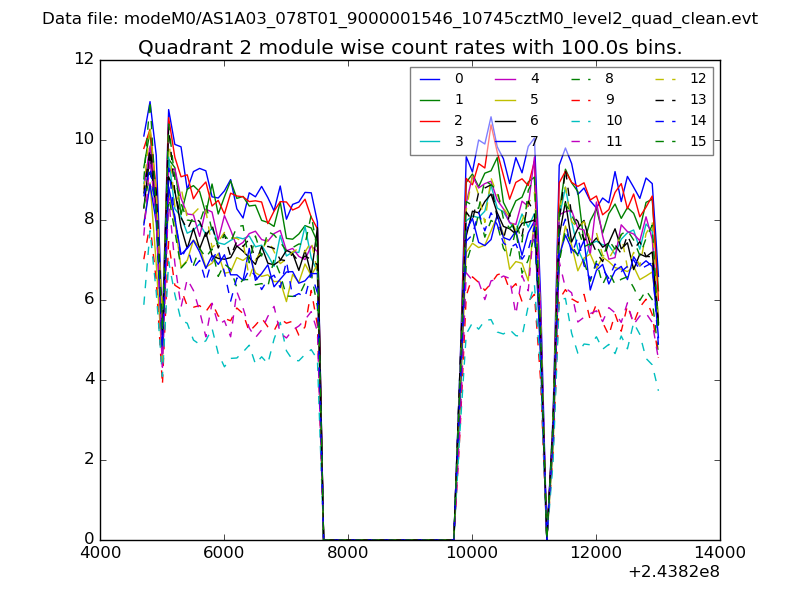
| Module-wise count rates for Quadrant B Data is divided into 100 sec bins |
 |
 |
| Module-wise count rates for Quadrant C Data is divided into 100 sec bins |
 |
 |
| Module-wise count rates for Quadrant D Data is divided into 100 sec bins |
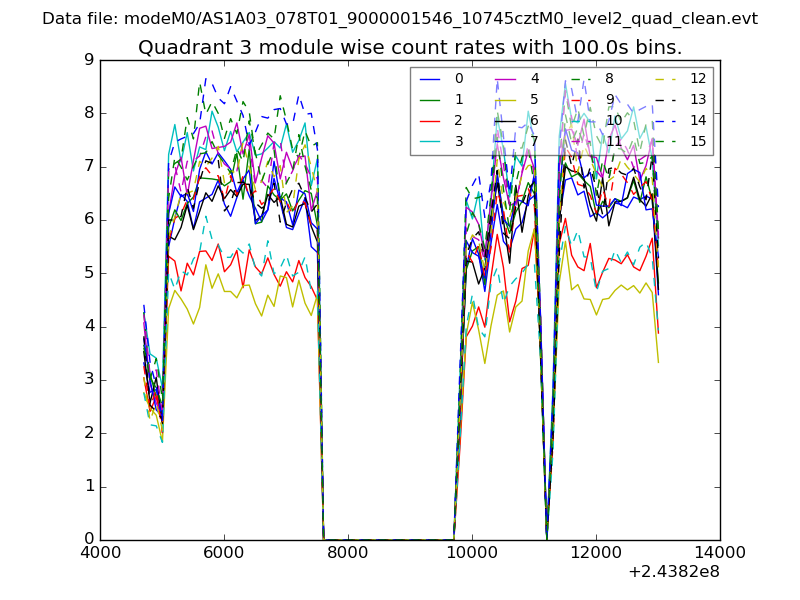 |
 |
| Parameter | Plot |
|---|---|
| CZT HV Monitor | 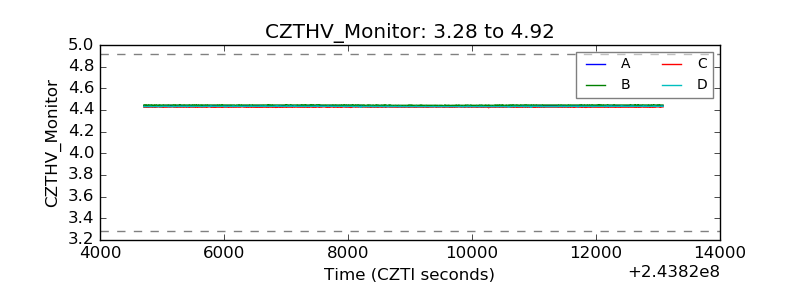 |
| D_VDD | 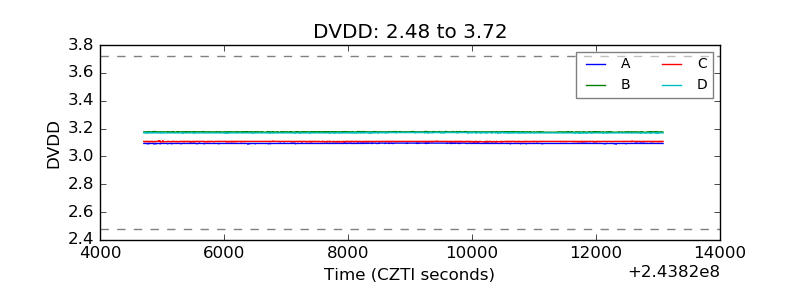 |
| Temperature 1 | 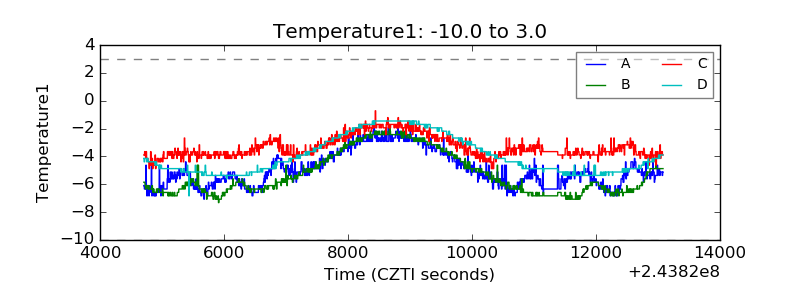 |
| Veto HV Monitor | 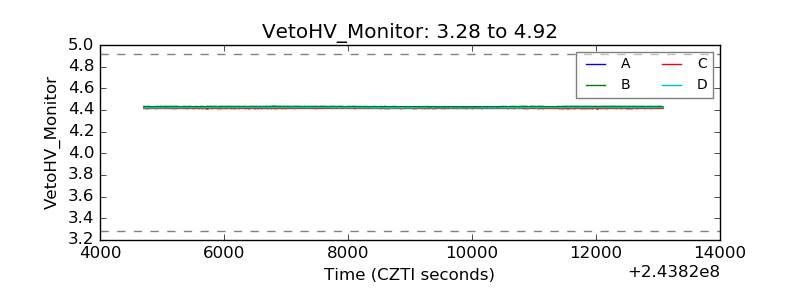 |
| Veto LLD | 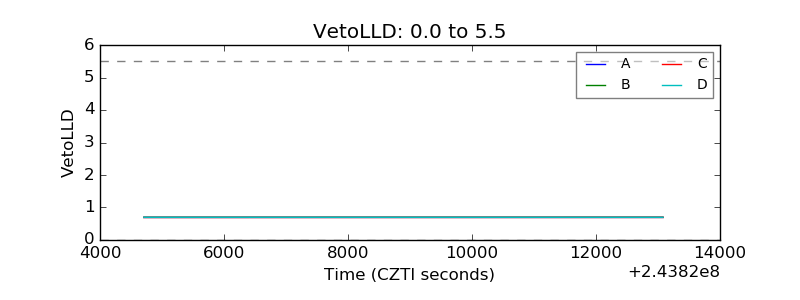 |
| Alpha Counter | 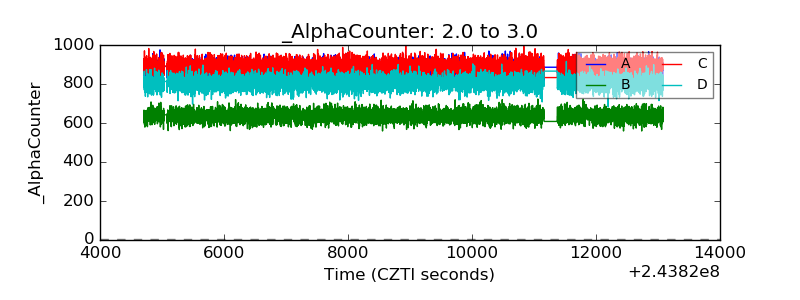 |
| _CPM_Rate | 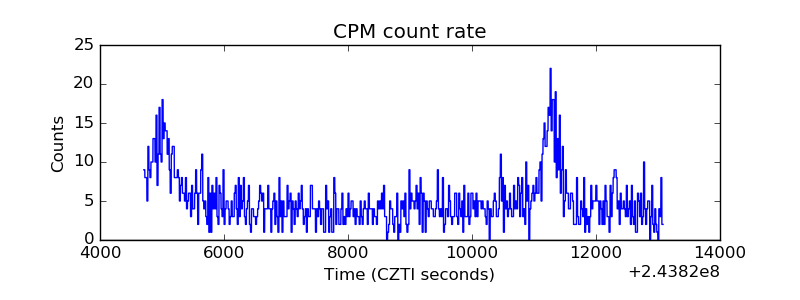 |
| CZT Counter | 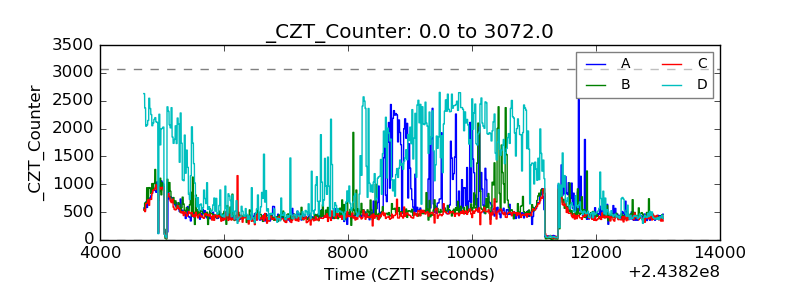 |
| +2.5 Volts monitor | 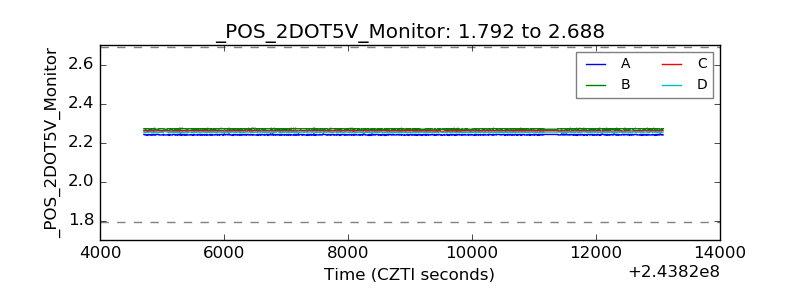 |
| +5 Volts monitor | 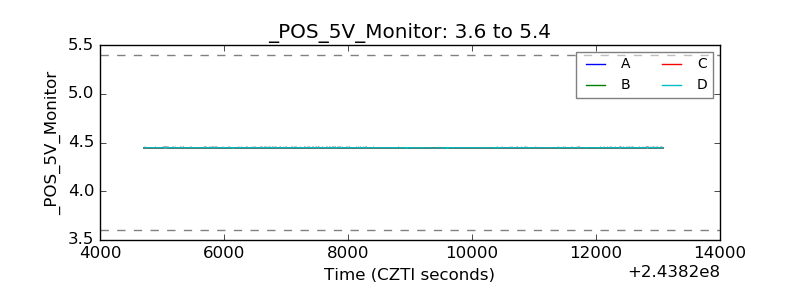 |
| _ROLL_ROT | 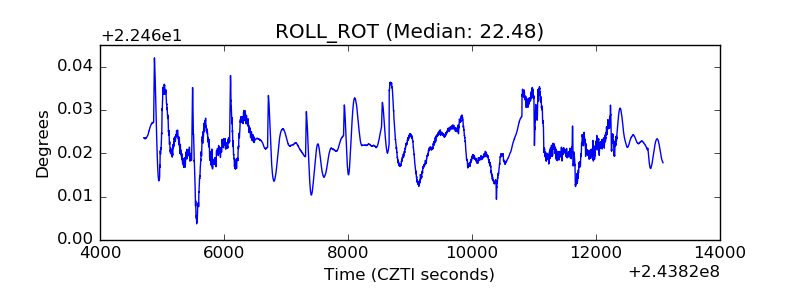 |
| _Roll_DEC | 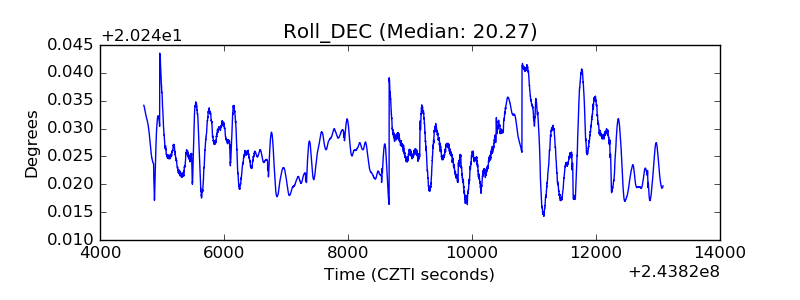 |
| _Roll_RA | 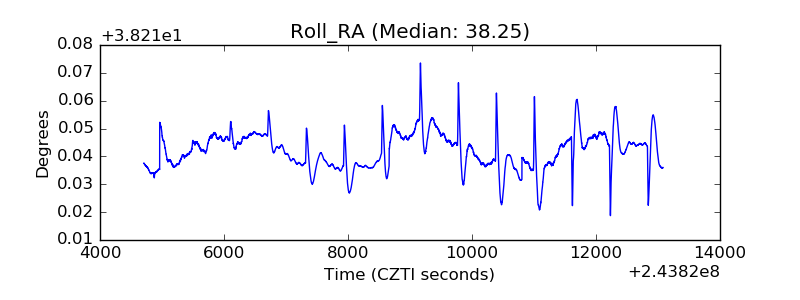 |
| Veto Counter | 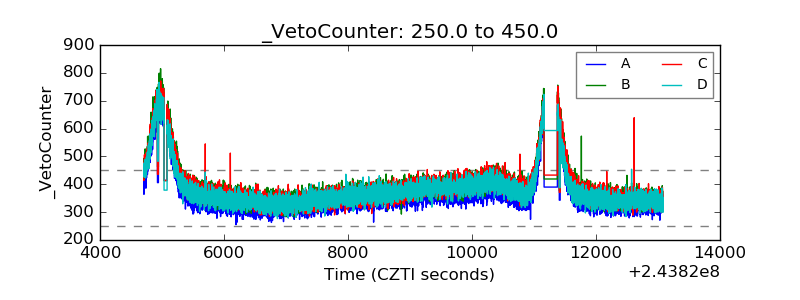 |