| Param | Original file | Final file |
|---|---|---|
| Filename | modeM0/AS1A03_078T01_9000001546_10748cztM0_level2.evt | modeM0/AS1A03_078T01_9000001546_10748cztM0_level2_quad_clean.evt |
| Size (bytes) | 1,549,022,400 | 221,538,240 |
| Size | 1.4 GB | 211.3 MB |
| Events in quadrant A | 10,353,039 | 1,336,609 |
| Events in quadrant B | 11,170,170 | 1,380,014 |
| Events in quadrant C | 8,569,471 | 1,384,617 |
| Events in quadrant D | 15,532,874 | 1,294,170 |
| Mode M0 | |||
|---|---|---|---|
| Quadrant | BADHDUFLAG | Total packets | Discarded packets |
| A | 0 | 43380 | 6 |
| B | 0 | 45425 | 5 |
| C | 0 | 38920 | 5 |
| D | 0 | 59196 | 5 |
| Mode SS | |||
|---|---|---|---|
| Quadrant | BADHDUFLAG | Total packets | Discarded packets |
| A | 0 | 388 | 0 |
| B | 0 | 388 | 0 |
| C | 0 | 388 | 0 |
| D | 0 | 388 | 0 |
| Mode M9 | |||
|---|---|---|---|
| Quadrant | BADHDUFLAG | Total packets | Discarded packets |
| A | 0 | 20 | 0 |
| B | 0 | 20 | 0 |
| C | 0 | 20 | 0 |
| D | 0 | 20 | 0 |
| Quadrant | Total seconds | Saturated seconds | Saturation percentage |
|---|---|---|---|
| A | 19069 | 769 | 4.032723% |
| B | 19069 | 742 | 3.891132% |
| C | 19069 | 187 | 0.980649% |
| D | 19069 | 1569 | 8.228014% |
Noise dominated data is calculated using 1-second bins in cleaned event files. If a bin has >2000 counts, and if more than 50% of those come from <1% of pixels, then it is considered to be noise-dominated and hence unusable.
| Quadrant | # 1 sec bins | Bins with >0 counts | Bins with >2000 counts | High rate bins dominated by noise | Noise dominated (total time) | Noise dominated (detector-on time) | Marked lightcurve |
|---|---|---|---|---|---|---|---|
| A | 21054 | 19072 | 276 | 276 | 1.31% | 1.45% | 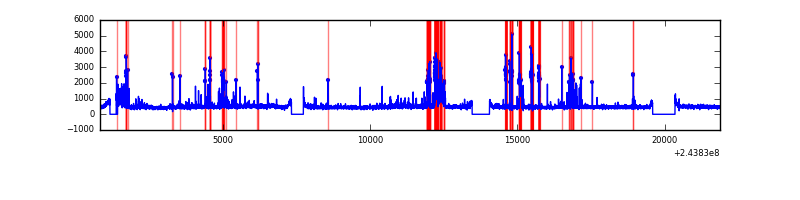 |
| B | 21054 | 19071 | 276 | 276 | 1.31% | 1.45% | 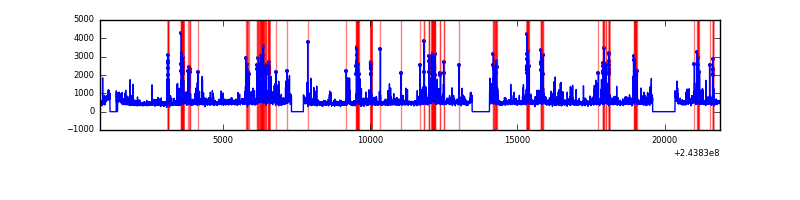 |
| C | 21054 | 19074 | 4 | 4 | 0.02% | 0.02% | 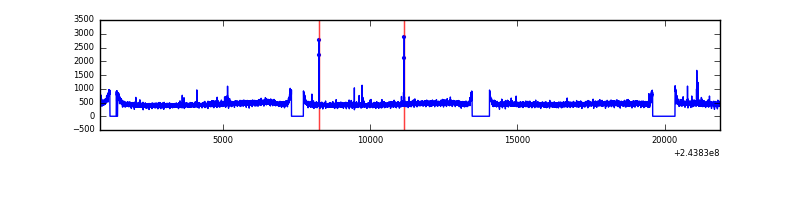 |
| D | 21054 | 19072 | 1103 | 1103 | 5.24% | 5.78% | 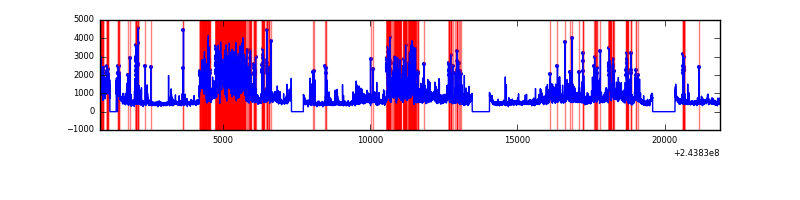 |
Top three noisy pixels from each quadrant. If the there are fewer than three noisy pixels in the level2.evt file, extra rows are filled as -1
| Pixel properties | Quadrant properties | ||||||
|---|---|---|---|---|---|---|---|
| Quadrant | DetID | PixID | Counts | Sigma | Mean | Median | Sigma |
| A | 15 | 239 | 1394415 | 3106.07 | 2215 | 2165 | 448.2 |
| A | 15 | 223 | 177950 | 392.17 | 2215 | 2165 | 448.2 |
| A | 14 | 254 | 69775 | 150.84 | 2215 | 2165 | 448.2 |
| B | 4 | 239 | 1774549 | 4112.58 | 2234 | 2178 | 431.0 |
| B | 0 | 214 | 249803 | 574.58 | 2234 | 2178 | 431.0 |
| B | 4 | 81 | 136826 | 312.43 | 2234 | 2178 | 431.0 |
| C | 14 | 234 | 35427 | 65.68 | 2186 | 2195 | 506.0 |
| C | 13 | 61 | 16221 | 27.72 | 2186 | 2195 | 506.0 |
| C | 14 | 225 | 10149 | 15.72 | 2186 | 2195 | 506.0 |
| D | 2 | 16 | 4367411 | 8504.48 | 2127 | 2064 | 513.3 |
| D | 1 | 52 | 946373 | 1839.68 | 2127 | 2064 | 513.3 |
| D | 12 | 233 | 717802 | 1394.38 | 2127 | 2064 | 513.3 |
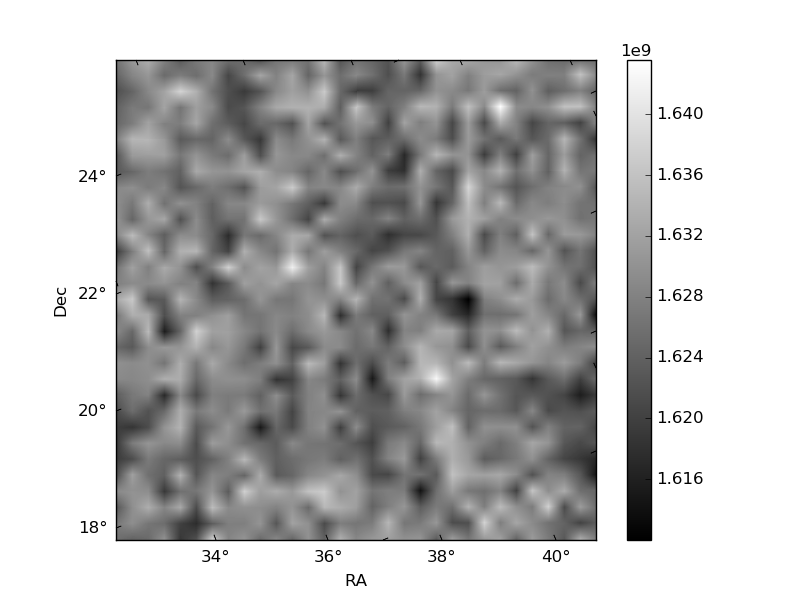
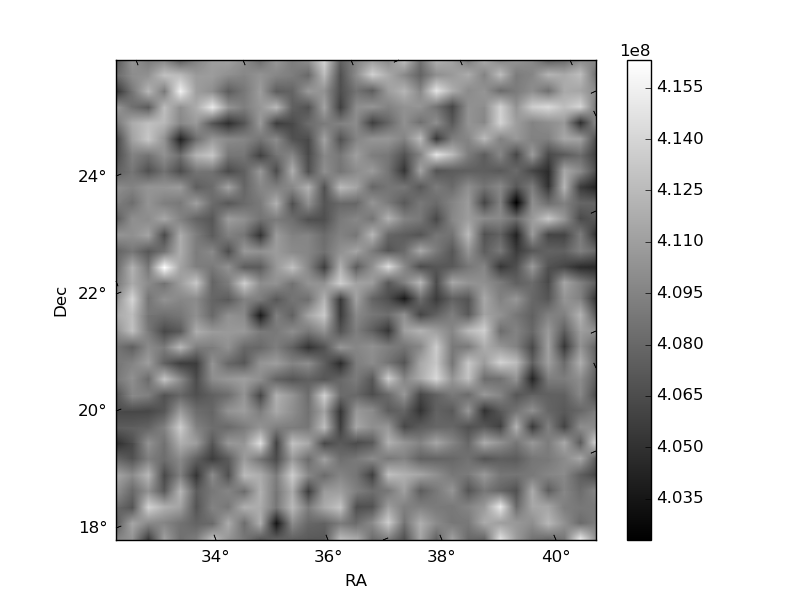
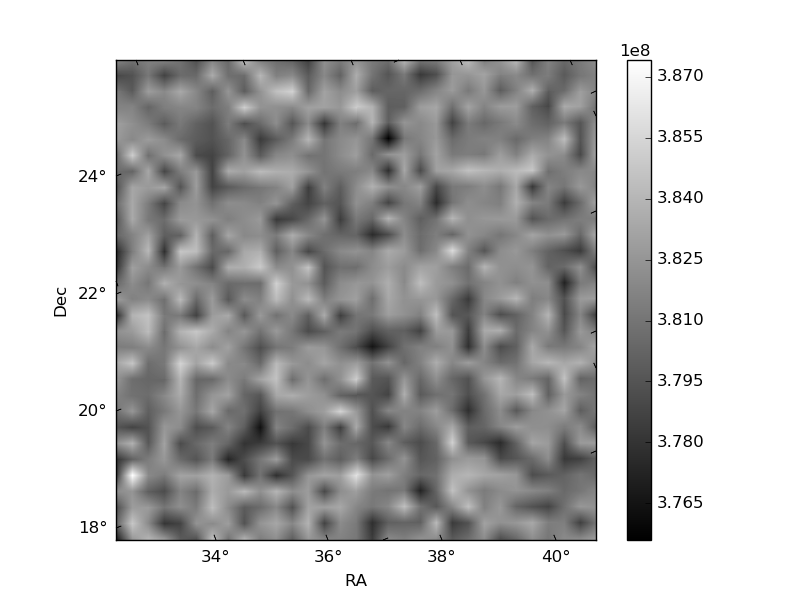
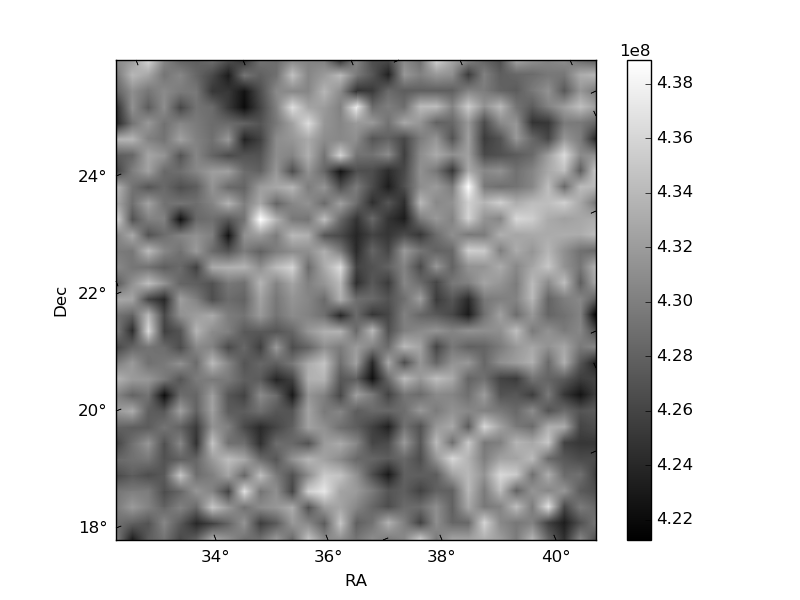
Histogram calculated using DETX and DETY for each event in the final _common_clean file
| Quadrant A | 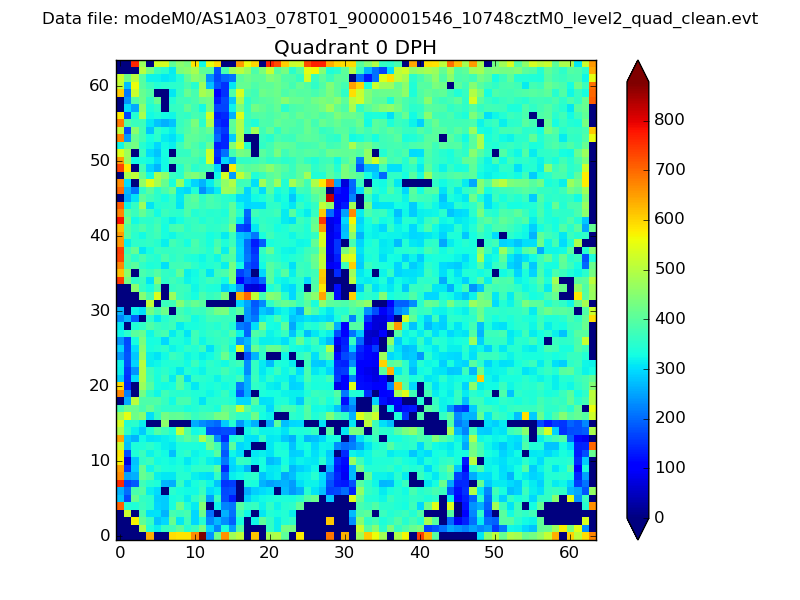 |
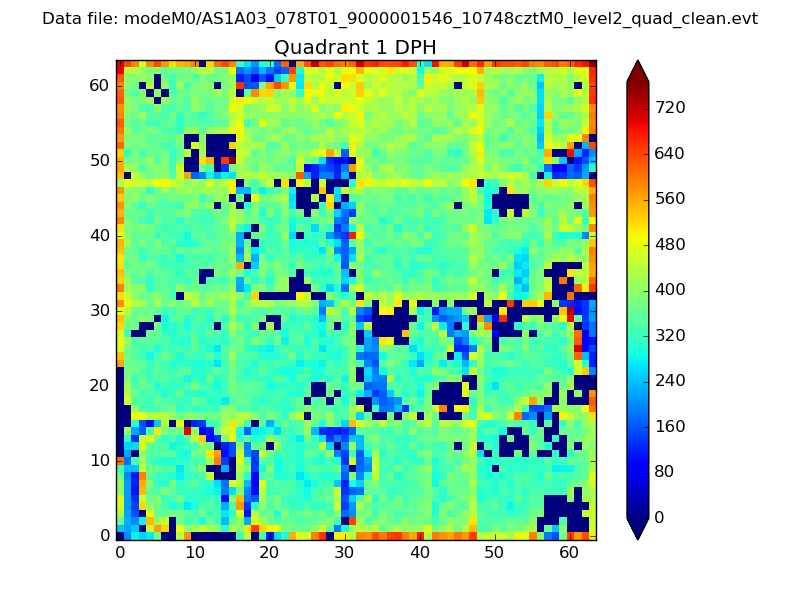 |
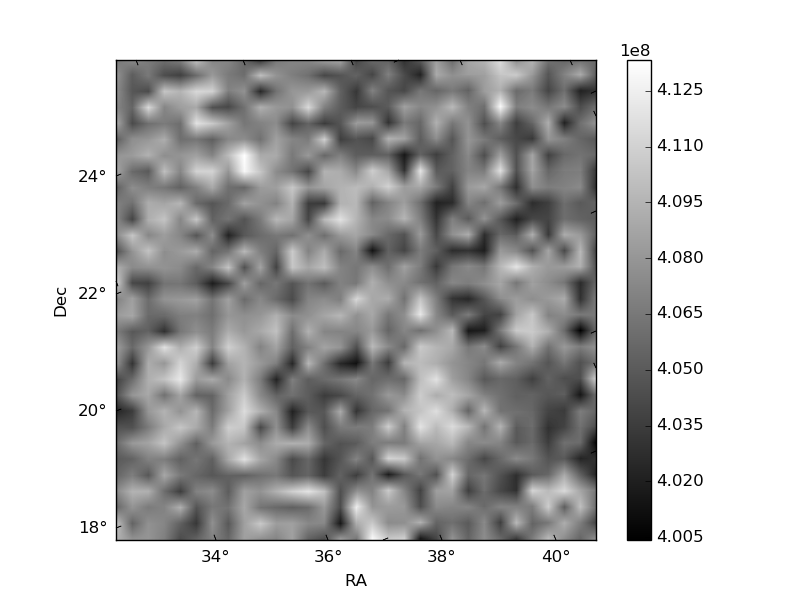
Quadrant B |
|---|---|---|---|
| Quadrant D | 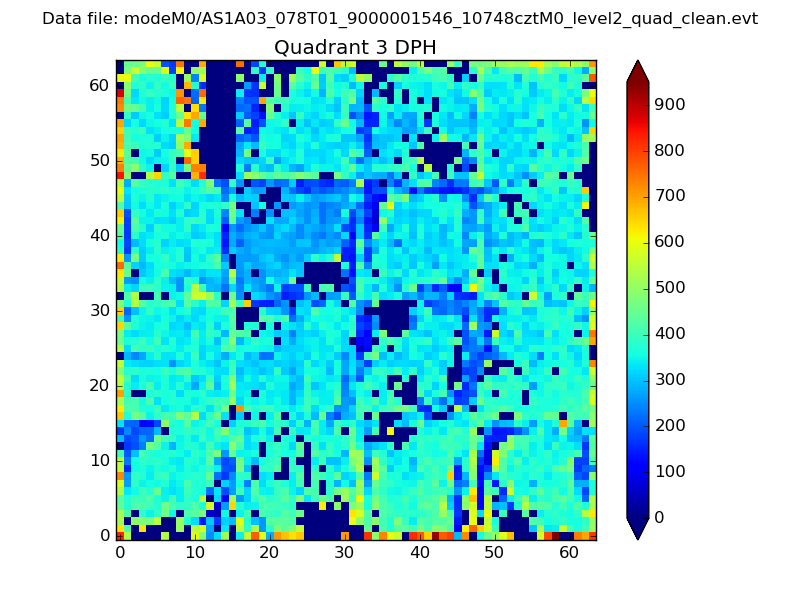 |
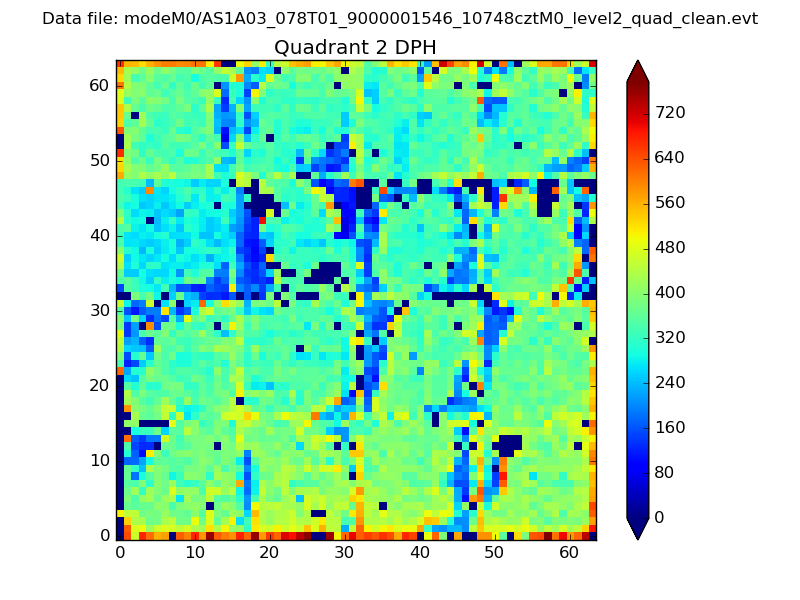 |
Quadrant C |
| Plot type | Count rate plots | Images |
|---|---|---|
| Comparison with Poisson distribution Blue bars denote a histogram of data divided into 1 sec bins. Red curve is a Poisson curve with rate = median count rate of data. |
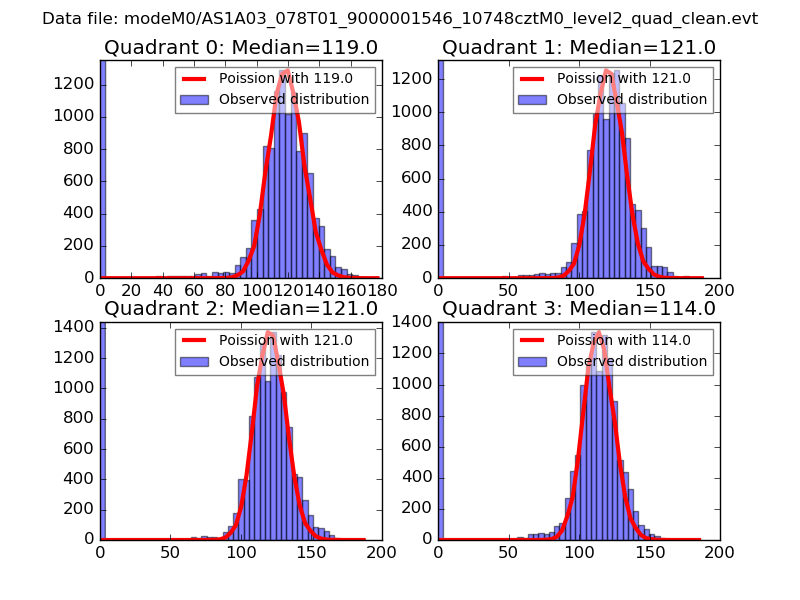 |
 |
| Quadrant-wise count rates Data is divided into 100 sec bins |
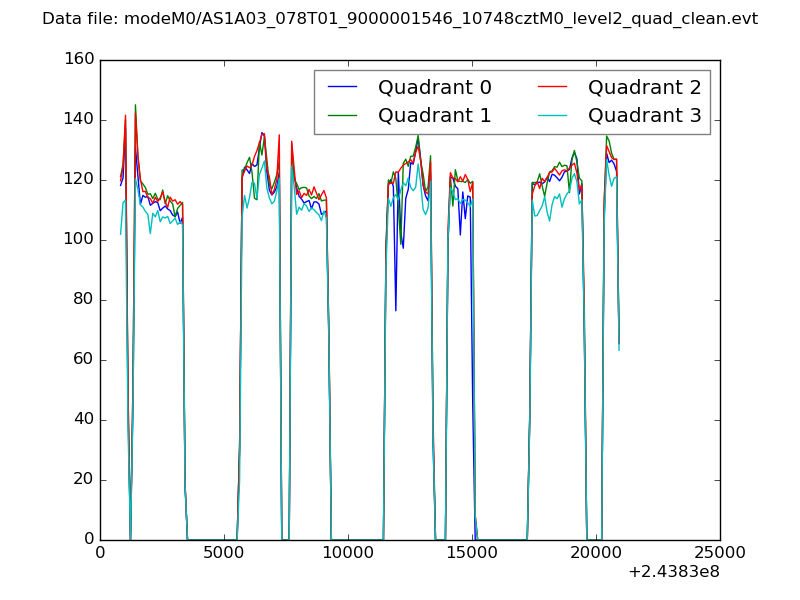 |
|
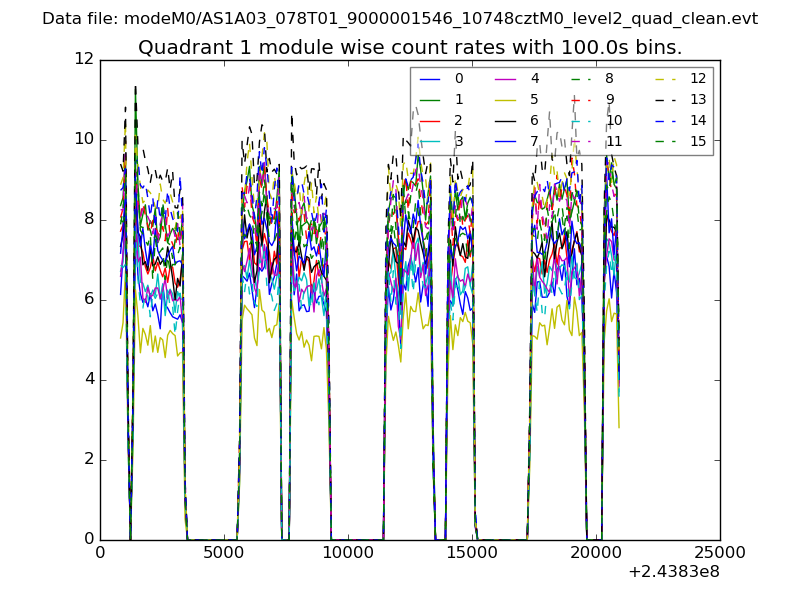
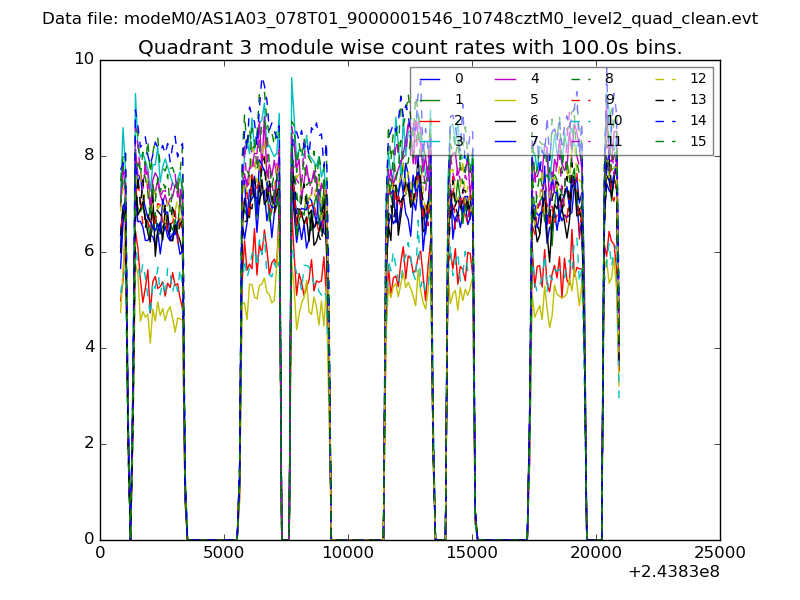
| Module-wise count rates for Quadrant A Data is divided into 100 sec bins |
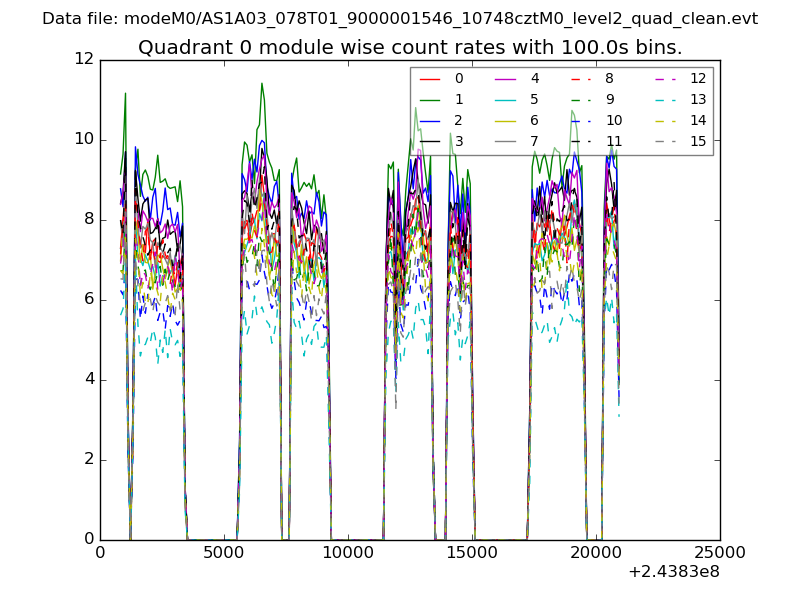 |
 |
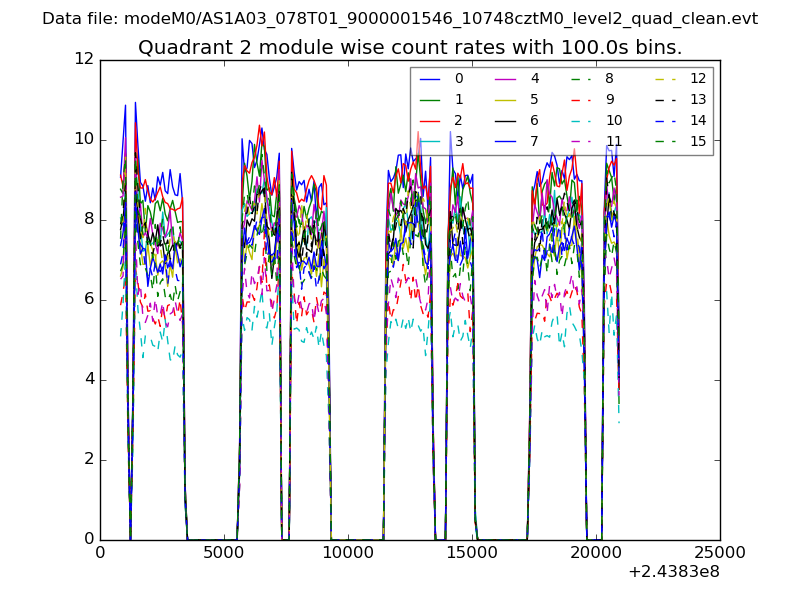
| Module-wise count rates for Quadrant B Data is divided into 100 sec bins |
 |
 |
| Module-wise count rates for Quadrant C Data is divided into 100 sec bins |
 |
 |
| Module-wise count rates for Quadrant D Data is divided into 100 sec bins |
 |
 |
| Parameter | Plot |
|---|---|
| CZT HV Monitor | 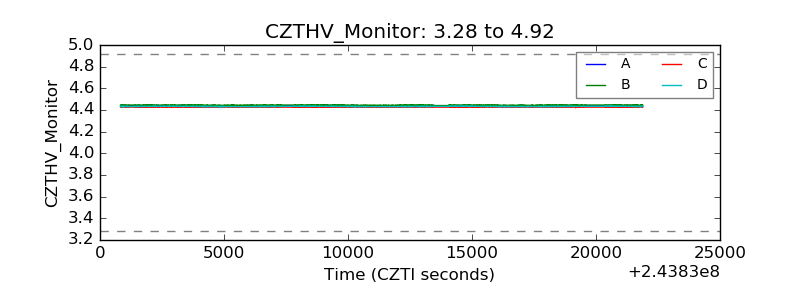 |
| D_VDD | 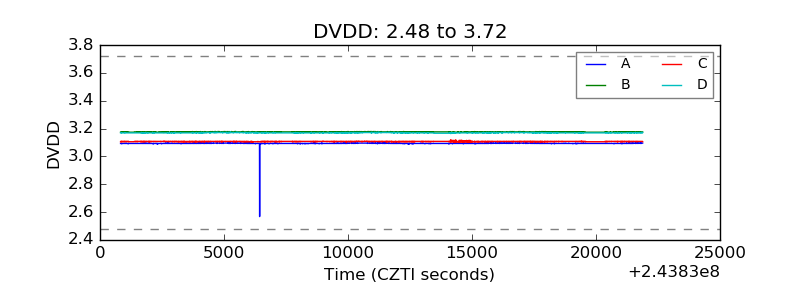 |
| Temperature 1 | 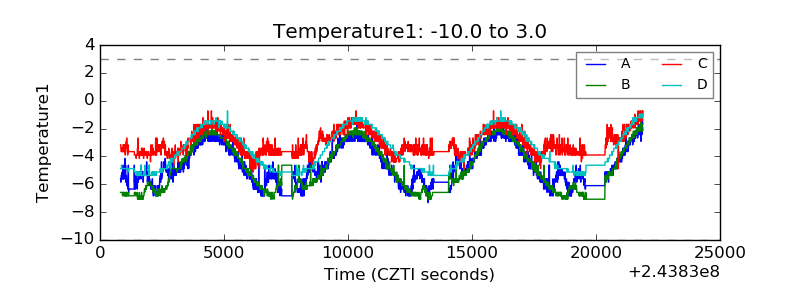 |
| Veto HV Monitor | 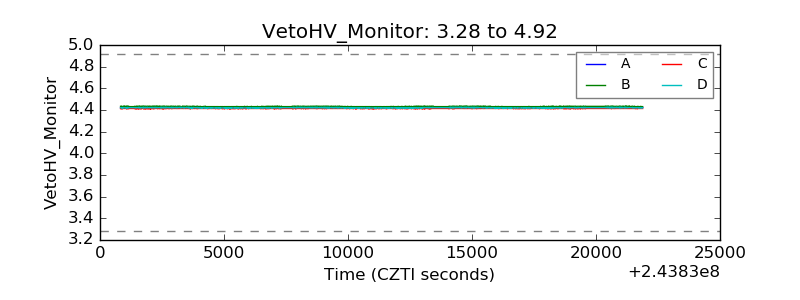 |
| Veto LLD | 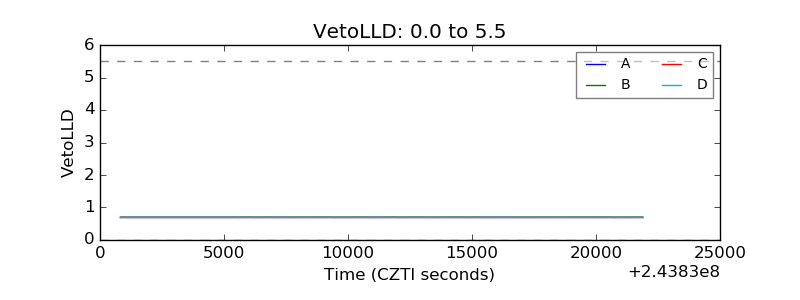 |
| Alpha Counter | 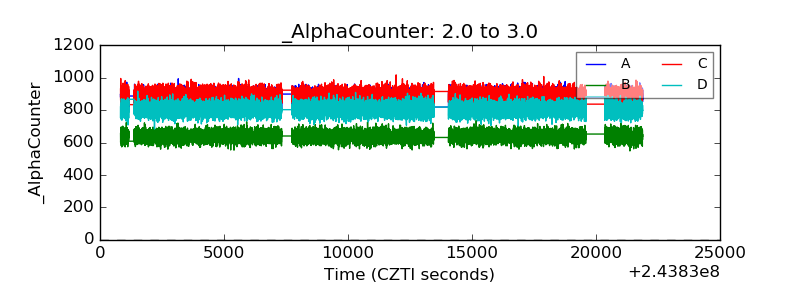 |
| _CPM_Rate | 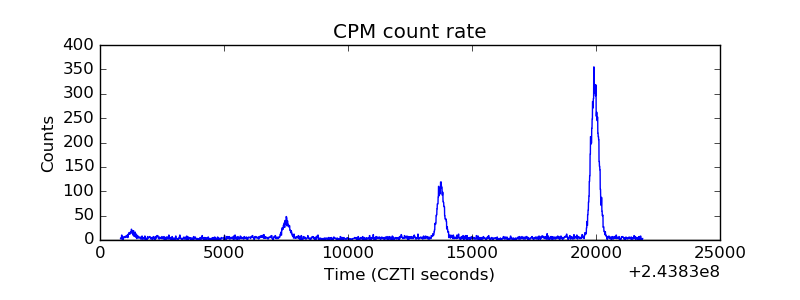 |
| CZT Counter | 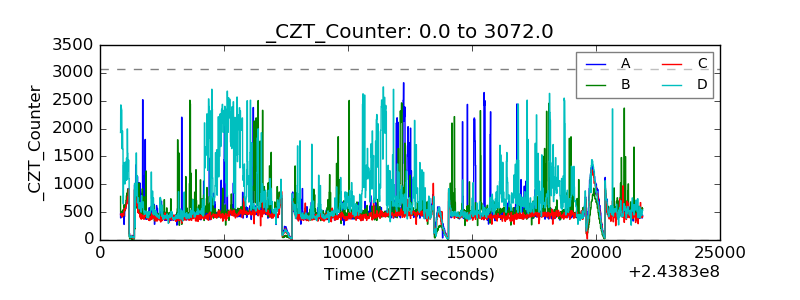 |
| +2.5 Volts monitor |  |
| +5 Volts monitor |  |
| _ROLL_ROT | 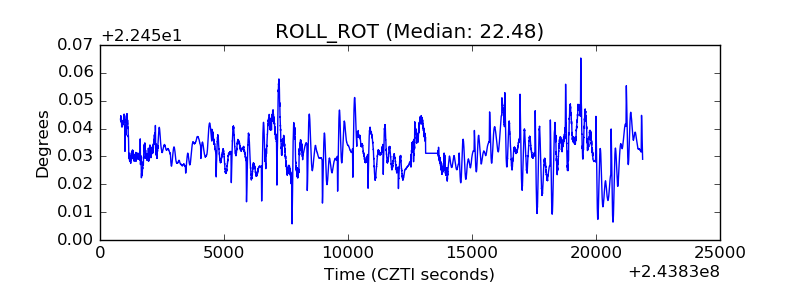 |
| _Roll_DEC | 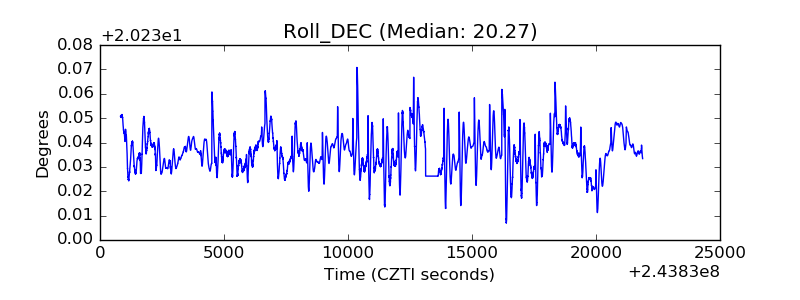 |
| _Roll_RA | 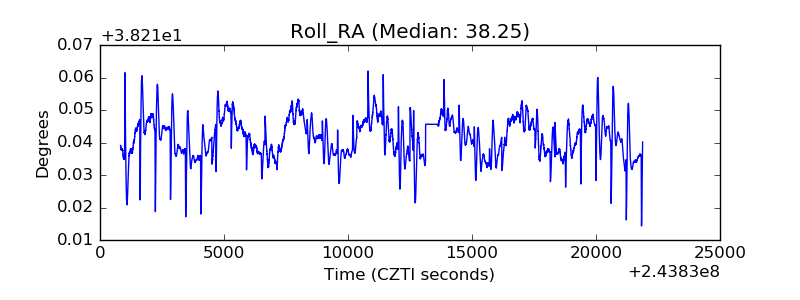 |
| Veto Counter | 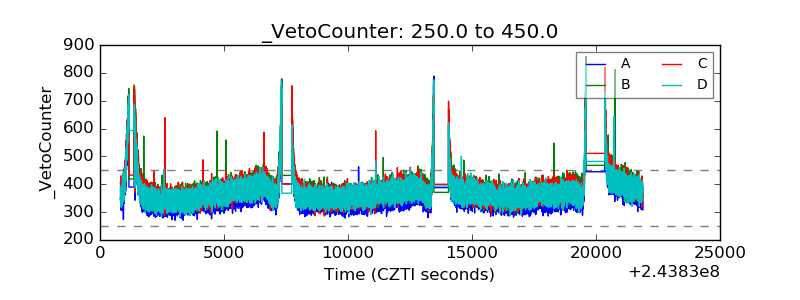 |