| Param | Original file | Final file |
|---|---|---|
| Filename | modeM0/AS1A03_078T01_9000001546_10749cztM0_level2.evt | modeM0/AS1A03_078T01_9000001546_10749cztM0_level2_quad_clean.evt |
| Size (bytes) | 278,904,960 | 25,093,440 |
| Size | 266.0 MB | 23.9 MB |
| Events in quadrant A | 1,579,791 | 132,260 |
| Events in quadrant B | 1,815,074 | 134,855 |
| Events in quadrant C | 1,497,652 | 132,608 |
| Events in quadrant D | 3,326,975 | 123,416 |
| Mode M0 | |||
|---|---|---|---|
| Quadrant | BADHDUFLAG | Total packets | Discarded packets |
| A | 0 | 6775 | 1 |
| B | 0 | 7459 | 1 |
| C | 0 | 6784 | 1 |
| D | 0 | 12041 | 1 |
| Mode SS | |||
|---|---|---|---|
| Quadrant | BADHDUFLAG | Total packets | Discarded packets |
| A | 0 | 66 | 0 |
| B | 0 | 66 | 0 |
| C | 0 | 66 | 0 |
| D | 0 | 66 | 0 |
| Mode M9 | |||
|---|---|---|---|
| Quadrant | BADHDUFLAG | Total packets | Discarded packets |
| A | 0 | 2 | 0 |
| B | 0 | 2 | 0 |
| C | 0 | 2 | 0 |
| D | 0 | 3 | 0 |
| Quadrant | Total seconds | Saturated seconds | Saturation percentage |
|---|---|---|---|
| A | 3324 | 26 | 0.782190% |
| B | 3324 | 52 | 1.564380% |
| C | 3324 | 14 | 0.421179% |
| D | 3324 | 484 | 14.560770% |
Noise dominated data is calculated using 1-second bins in cleaned event files. If a bin has >2000 counts, and if more than 50% of those come from <1% of pixels, then it is considered to be noise-dominated and hence unusable.
| Quadrant | # 1 sec bins | Bins with >0 counts | Bins with >2000 counts | High rate bins dominated by noise | Noise dominated (total time) | Noise dominated (detector-on time) | Marked lightcurve |
|---|---|---|---|---|---|---|---|
| A | 3324 | 3324 | 0 | 0 | 0.00% | 0.00% | 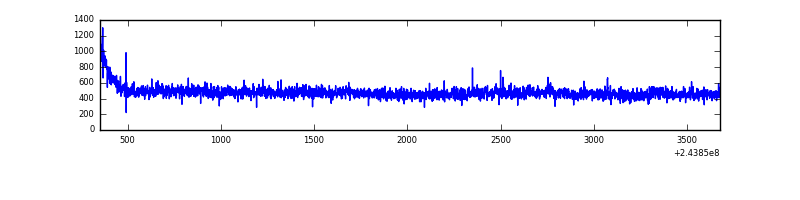 |
| B | 3324 | 3324 | 17 | 17 | 0.51% | 0.51% | 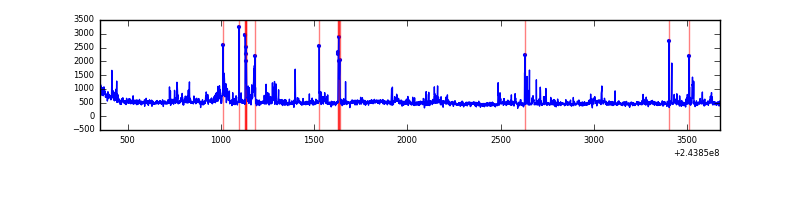 |
| C | 3324 | 3324 | 0 | 0 | 0.00% | 0.00% | 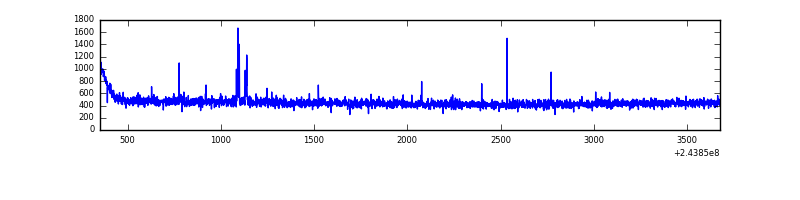 |
| D | 3324 | 3324 | 392 | 392 | 11.79% | 11.79% | 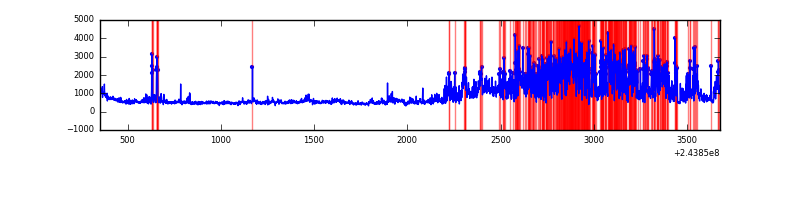 |
Top three noisy pixels from each quadrant. If the there are fewer than three noisy pixels in the level2.evt file, extra rows are filled as -1
| Pixel properties | Quadrant properties | ||||||
|---|---|---|---|---|---|---|---|
| Quadrant | DetID | PixID | Counts | Sigma | Mean | Median | Sigma |
| A | 8 | 15 | 35150 | 421.2 | 396 | 387 | 82.5 |
| A | 11 | 29 | 6111 | 69.35 | 396 | 387 | 82.5 |
| A | 13 | 251 | 4084 | 44.79 | 396 | 387 | 82.5 |
| B | 4 | 239 | 145008 | 1848.89 | 392 | 382 | 78.2 |
| B | 4 | 81 | 57301 | 727.65 | 392 | 382 | 78.2 |
| B | 0 | 219 | 22640 | 284.54 | 392 | 382 | 78.2 |
| C | 14 | 234 | 16813 | 182.37 | 379 | 381 | 90.1 |
| C | 13 | 61 | 2830 | 27.18 | 379 | 381 | 90.1 |
| C | 3 | 202 | 1040 | 7.31 | 379 | 381 | 90.1 |
| D | 2 | 16 | 1521414 | 16914.2 | 366 | 355 | 89.9 |
| D | 8 | 195 | 145029 | 1608.78 | 366 | 355 | 89.9 |
| D | 1 | 52 | 130983 | 1452.59 | 366 | 355 | 89.9 |
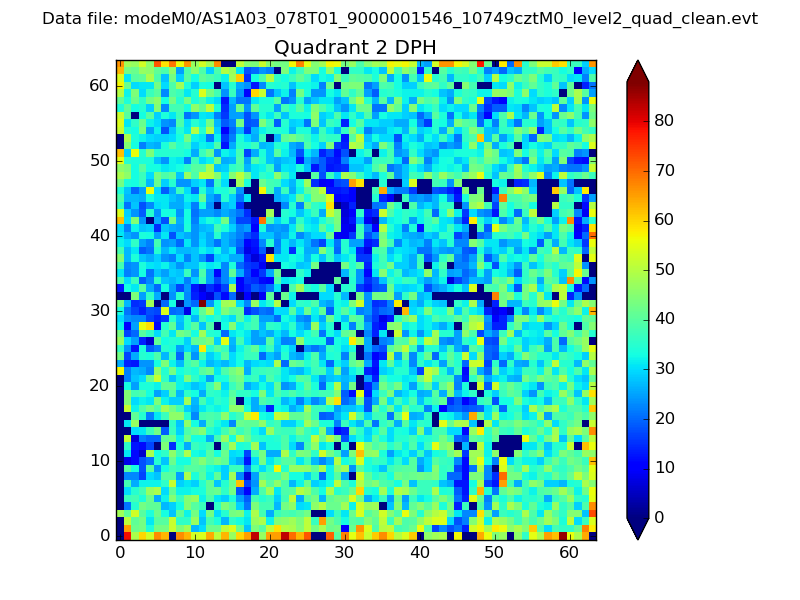
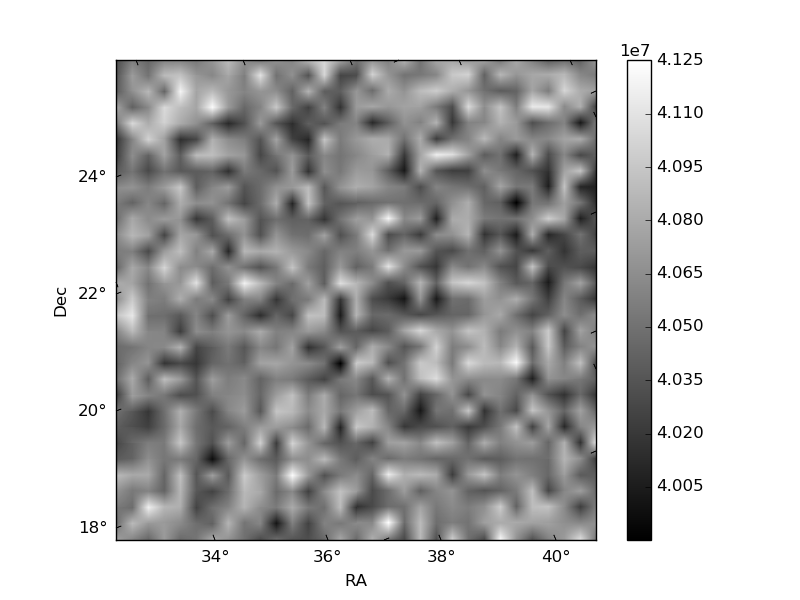
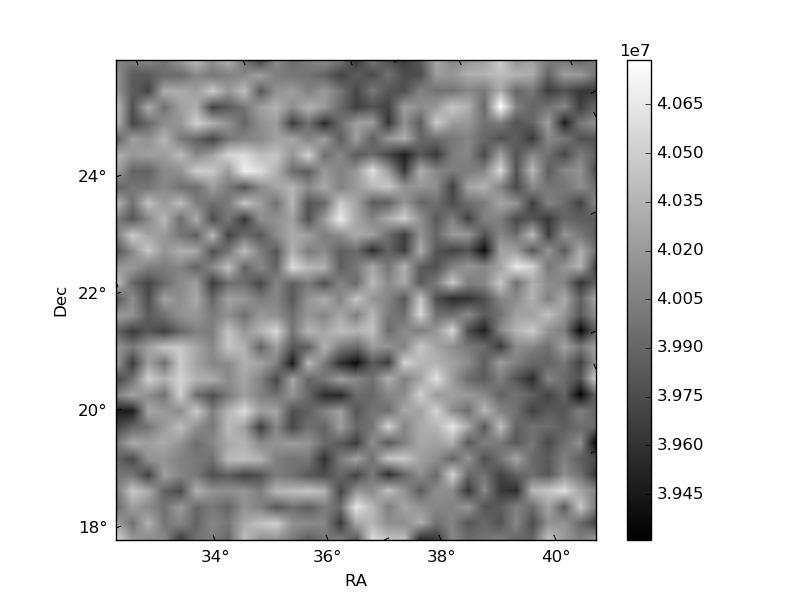
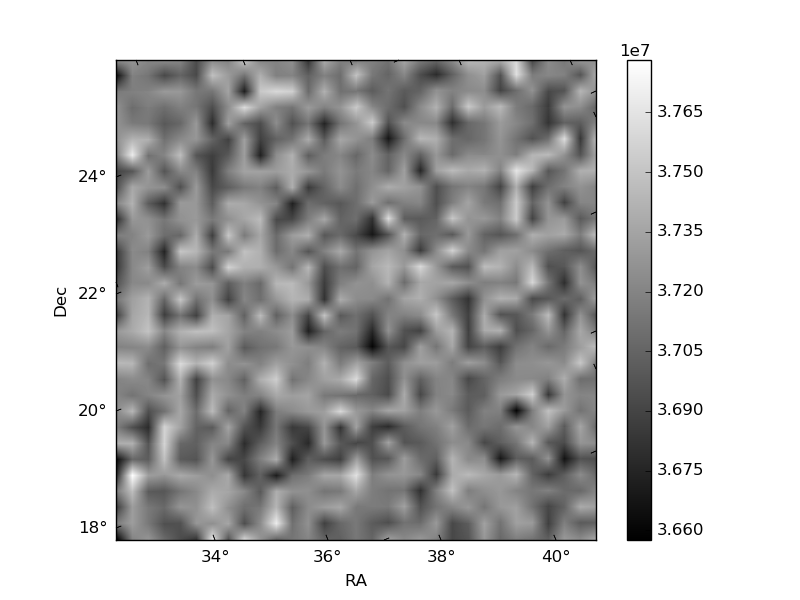
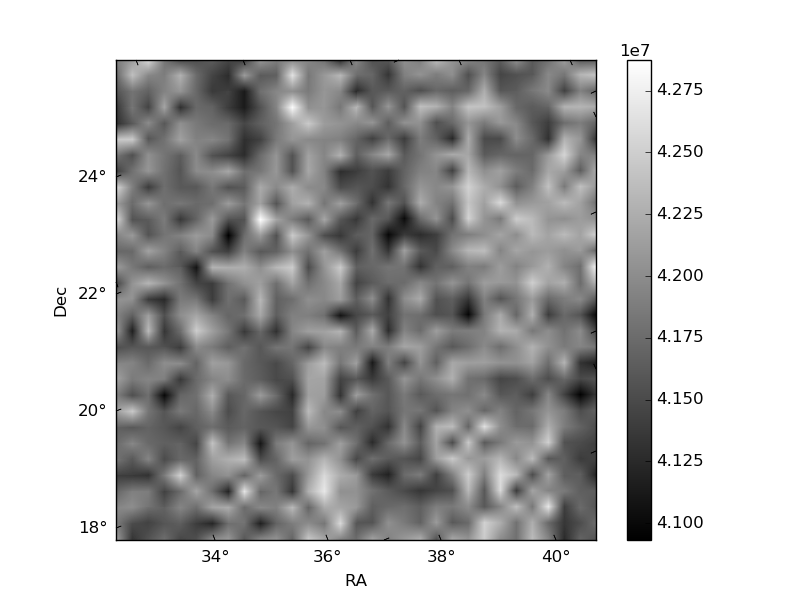
Histogram calculated using DETX and DETY for each event in the final _common_clean file
| Quadrant A | 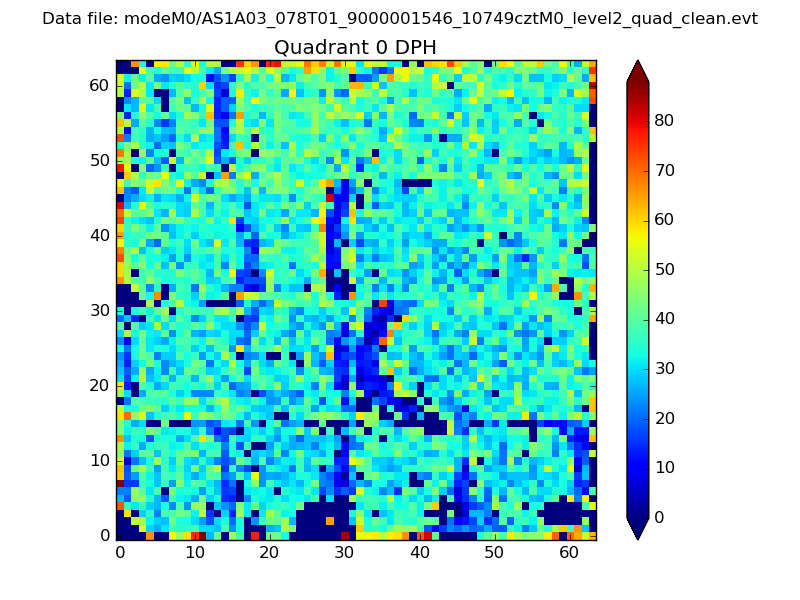 |
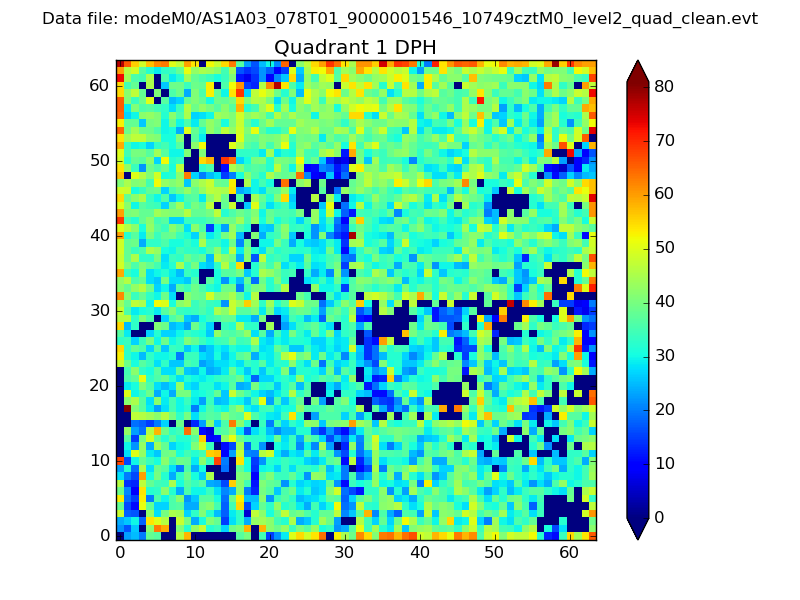 |
Quadrant B |
|---|---|---|---|
| Quadrant D | 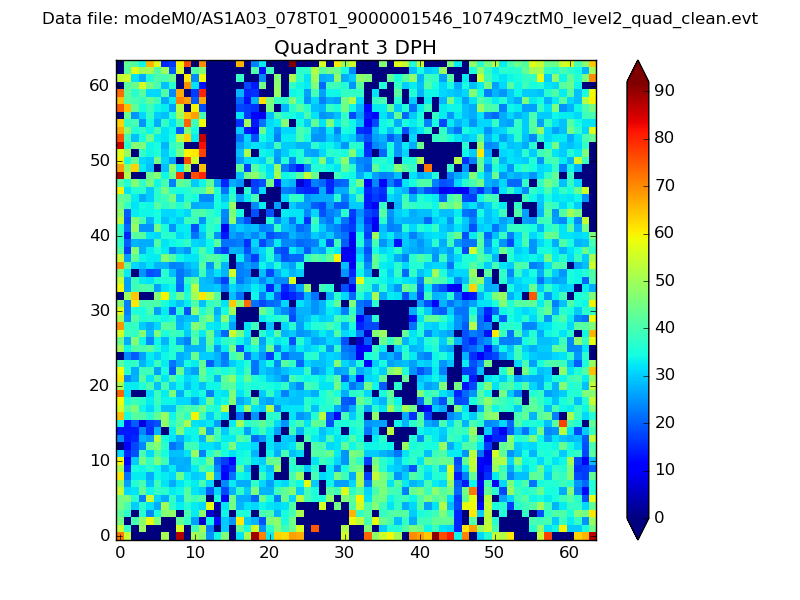 |
 |
Quadrant C |
| Plot type | Count rate plots | Images |
|---|---|---|
| Comparison with Poisson distribution Blue bars denote a histogram of data divided into 1 sec bins. Red curve is a Poisson curve with rate = median count rate of data. |
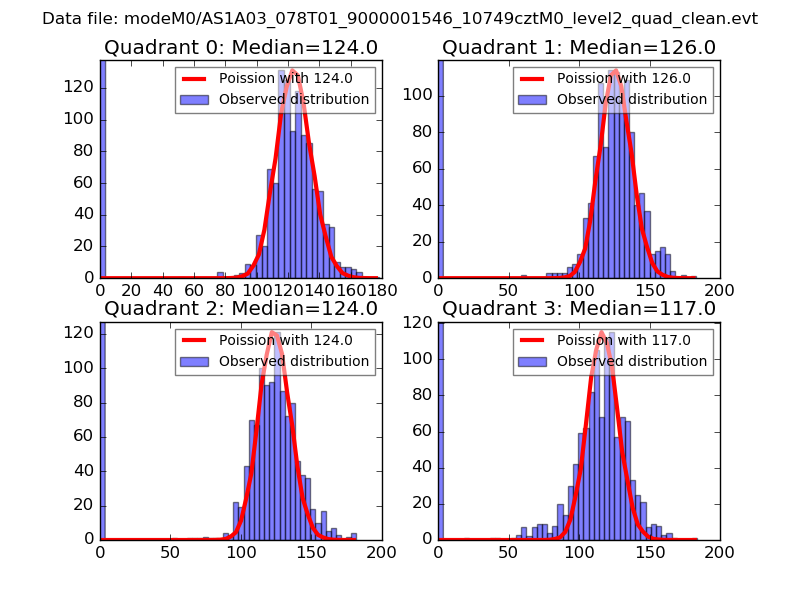 |
 |
| Quadrant-wise count rates Data is divided into 100 sec bins |
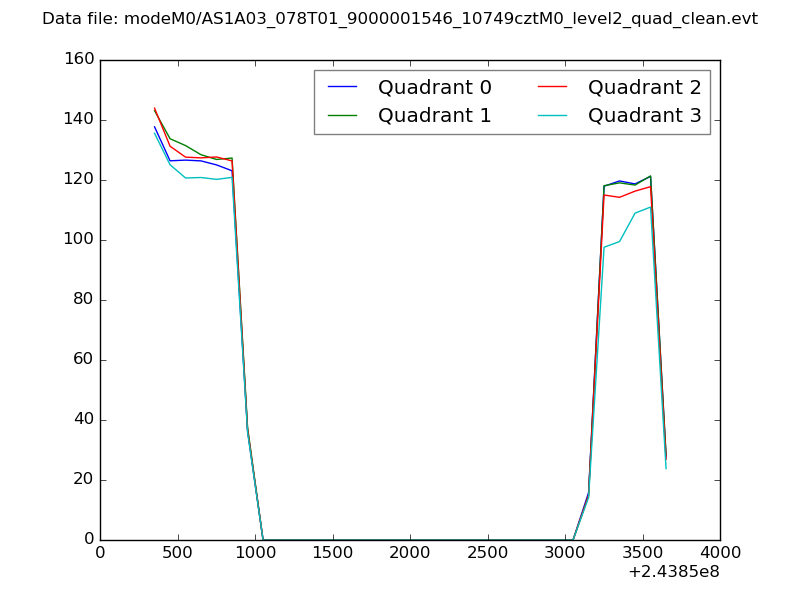 |
|
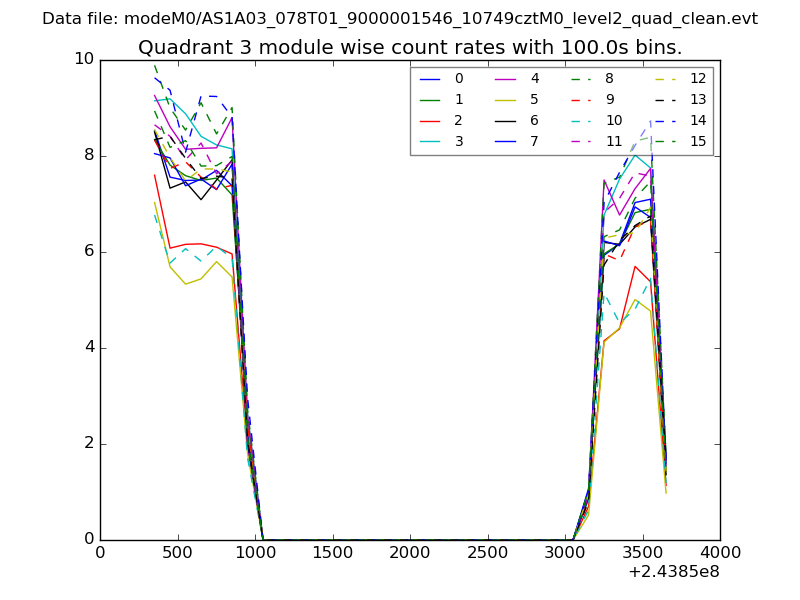
| Module-wise count rates for Quadrant A Data is divided into 100 sec bins |
 |
 |
| Module-wise count rates for Quadrant B Data is divided into 100 sec bins |
 |
 |
| Module-wise count rates for Quadrant C Data is divided into 100 sec bins |
 |
 |
| Module-wise count rates for Quadrant D Data is divided into 100 sec bins |
 |
 |
| Parameter | Plot |
|---|---|
| CZT HV Monitor |  |
| D_VDD | 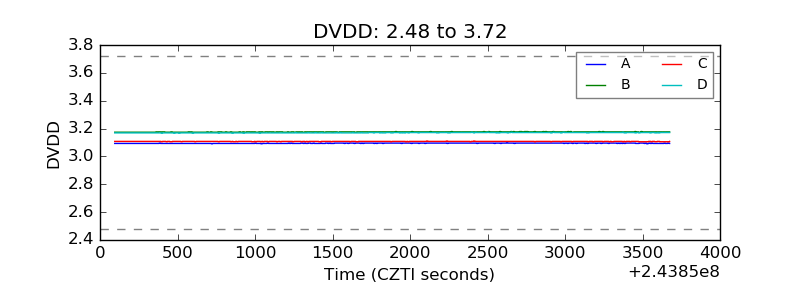 |
| Temperature 1 | 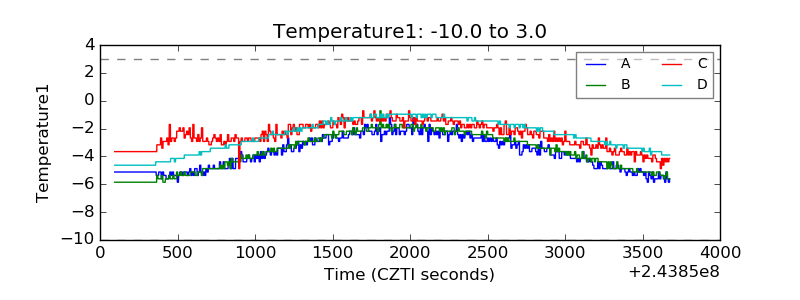 |
| Veto HV Monitor | 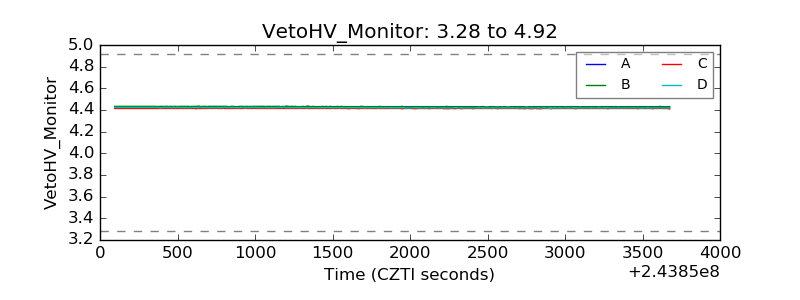 |
| Veto LLD | 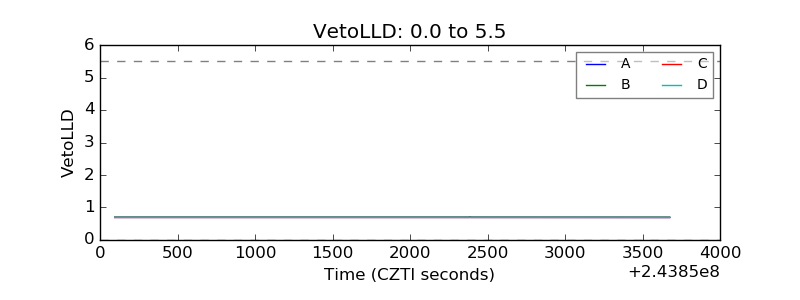 |
| Alpha Counter | 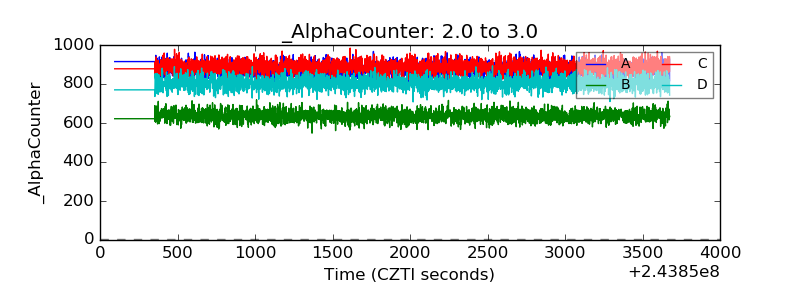 |
| _CPM_Rate | 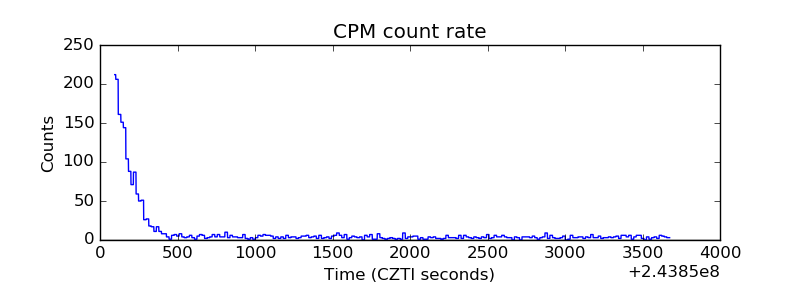 |
| CZT Counter | 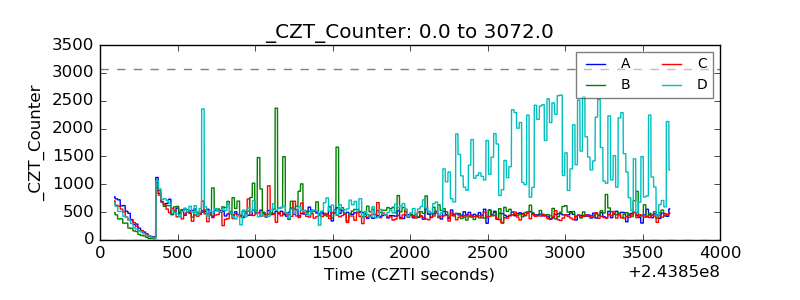 |
| +2.5 Volts monitor |  |
| +5 Volts monitor |  |
| _ROLL_ROT |  |
| _Roll_DEC | 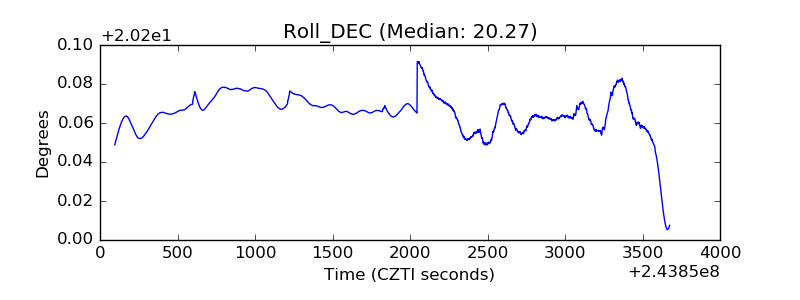 |
| _Roll_RA |  |
| Veto Counter | 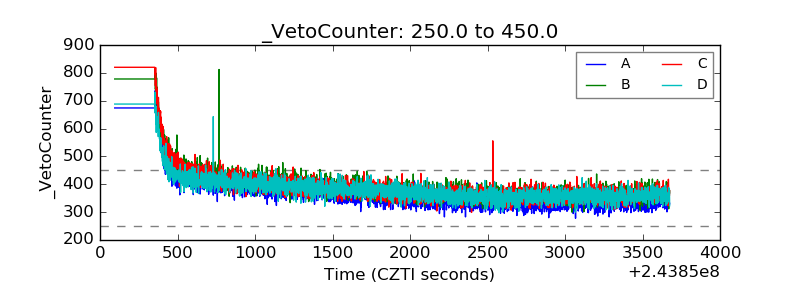 |