| Param | Original file | Final file |
|---|---|---|
| Filename | modeM0/AS1A03_084T01_9000001544cztM0_level2.fits | modeM0/AS1A03_084T01_9000001544cztM0_level2_quad_clean.evt |
| Size (bytes) | 213,287,040 | 173,194,560 |
| Size | 203.4 MB | 165.2 MB |
| Events in quadrant A | 1,311,978 | 998,956 |
| Events in quadrant B | 1,223,886 | 928,625 |
| Events in quadrant C | 1,278,768 | 939,814 |
| Events in quadrant D | 1,085,864 | 818,317 |
| Mode SS | |||
|---|---|---|---|
| Quadrant | BADHDUFLAG | Total packets | Discarded packets |
| A | 0 | 462 | 0 |
| B | 0 | 462 | 0 |
| C | 0 | 462 | 0 |
| D | 0 | 462 | 0 |
| Mode M0 | |||
|---|---|---|---|
| Quadrant | BADHDUFLAG | Total packets | Discarded packets |
| A | 0 | 47630 | 0 |
| B | 0 | 64676 | 0 |
| C | 0 | 46502 | 0 |
| D | 0 | 62146 | 0 |
| Mode M9 | |||
|---|---|---|---|
| Quadrant | BADHDUFLAG | Total packets | Discarded packets |
| A | 0 | 53 | 0 |
| B | 0 | 53 | 0 |
| C | 0 | 53 | 0 |
| D | 0 | 53 | 0 |
| Quadrant | Total seconds | Saturated seconds | Saturation percentage |
|---|---|---|---|
| A | 22641 | 265 | 1.170443% |
| B | 22642 | 1497 | 6.611607% |
| C | 22642 | 144 | 0.635986% |
| D | 22642 | 893 | 3.943998% |
Noise dominated data is calculated using 1-second bins in cleaned event files. If a bin has >2000 counts, and if more than 50% of those come from <1% of pixels, then it is considered to be noise-dominated and hence unusable.
| Quadrant | # 1 sec bins | Bins with >0 counts | Bins with >2000 counts | High rate bins dominated by noise | Noise dominated (total time) | Noise dominated (detector-on time) | Marked lightcurve |
|---|---|---|---|---|---|---|---|
| A | 27962 | 22640 | 0 | 0 | 0.00% | 0.00% |  |
| B | 27963 | 22639 | 0 | 0 | 0.00% | 0.00% |  |
| C | 27963 | 22643 | 0 | 0 | 0.00% | 0.00% |  |
| D | 27963 | 22638 | 0 | 0 | 0.00% | 0.00% |  |
Top three noisy pixels from each quadrant. If the there are fewer than three noisy pixels in the level2.evt file, extra rows are filled as -1
| Pixel properties | Quadrant properties | ||||||
|---|---|---|---|---|---|---|---|
| Quadrant | DetID | PixID | Counts | Sigma | Mean | Median | Sigma |
| A | 0 | 29 | 1257 | 10.72 | 341 | 319 | 87.5 |
| A | 7 | 110 | 1080 | 8.7 | 341 | 319 | 87.5 |
| A | 9 | 19 | 998 | 7.76 | 341 | 319 | 87.5 |
| B | 2 | 9 | 1050 | 11.19 | 323 | 308 | 66.3 |
| B | 14 | 254 | 836 | 7.96 | 323 | 308 | 66.3 |
| B | 5 | 225 | 815 | 7.65 | 323 | 308 | 66.3 |
| C | 1 | 80 | 1002 | 7.57 | 337 | 313 | 91.1 |
| C | 1 | 81 | 968 | 7.19 | 337 | 313 | 91.1 |
| C | 12 | 241 | 881 | 6.24 | 337 | 313 | 91.1 |
| D | 3 | 14 | 785 | 5.92 | 309 | 281 | 85.1 |
| D | 4 | 160 | 784 | 5.91 | 309 | 281 | 85.1 |
| D | 3 | 30 | 783 | 5.9 | 309 | 281 | 85.1 |
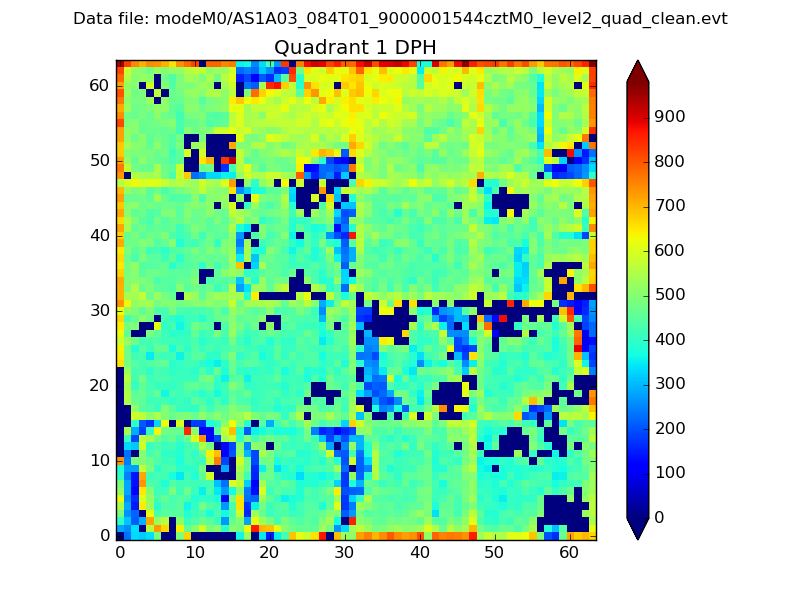
Histogram calculated using DETX and DETY for each event in the final _common_clean file
| Quadrant A |  |
 |
Quadrant B |
|---|---|---|---|
| Quadrant D |  |
 |
Quadrant C |
| Plot type | Count rate plots | Images |
|---|---|---|
| Comparison with Poisson distribution Blue bars denote a histogram of data divided into 1 sec bins. Red curve is a Poisson curve with rate = median count rate of data. |
 |
 |
| Quadrant-wise count rates Data is divided into 100 sec bins |
 |
|
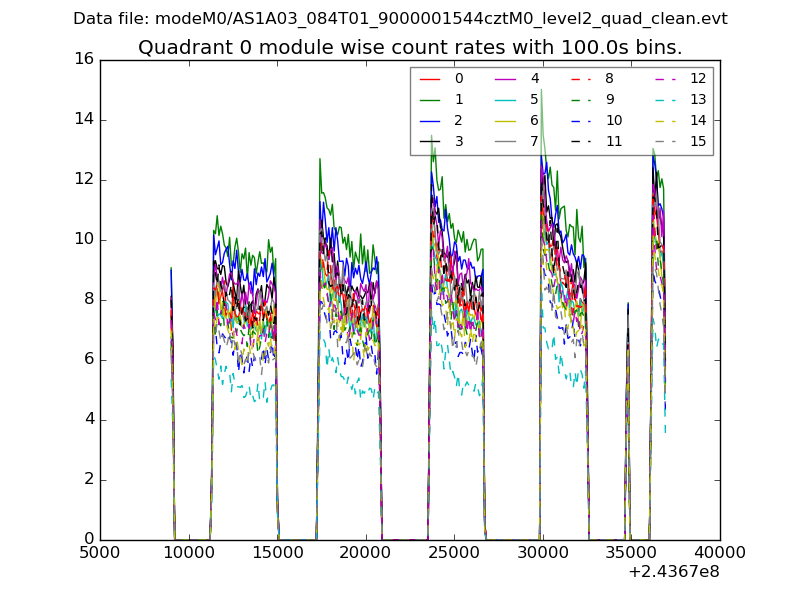
| Module-wise count rates for Quadrant A Data is divided into 100 sec bins |
 |
 |
| Module-wise count rates for Quadrant B Data is divided into 100 sec bins |
 |
 |
| Module-wise count rates for Quadrant C Data is divided into 100 sec bins |
 |
 |
| Module-wise count rates for Quadrant D Data is divided into 100 sec bins |
 |
 |
| Parameter | Plot |
|---|---|
| CZT HV Monitor |  |
| D_VDD | 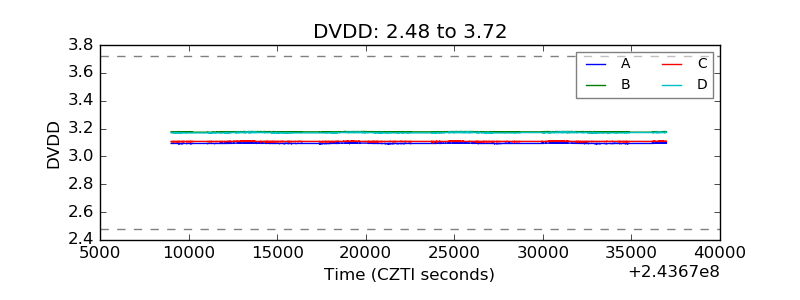 |
| Temperature 1 |  |
| Veto HV Monitor |  |
| Veto LLD |  |
| Alpha Counter |  |
| _CPM_Rate |  |
| CZT Counter | 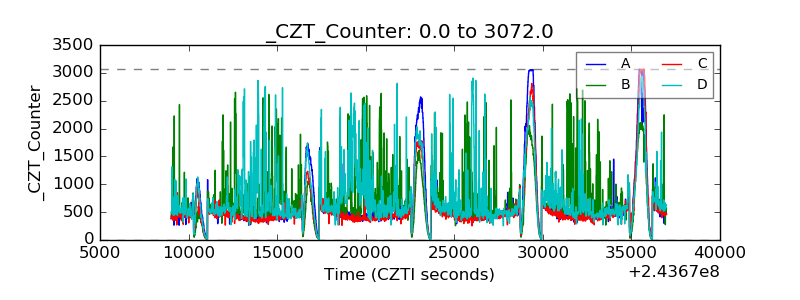 |
| +2.5 Volts monitor |  |
| +5 Volts monitor |  |
| _ROLL_ROT |  |
| _Roll_DEC |  |
| _Roll_RA |  |
| Veto Counter |  |