| Param | Original file | Final file |
|---|---|---|
| Filename | modeM0/AS1A03_084T01_9000001544_10719cztM0_level2.evt | modeM0/AS1A03_084T01_9000001544_10719cztM0_level2_quad_clean.evt |
| Size (bytes) | 206,236,800 | 27,550,080 |
| Size | 196.7 MB | 26.3 MB |
| Events in quadrant A | 1,360,317 | 162,551 |
| Events in quadrant B | 1,856,001 | 163,185 |
| Events in quadrant C | 1,318,151 | 160,613 |
| Events in quadrant D | 1,525,088 | 153,101 |
| Mode SS | |||
|---|---|---|---|
| Quadrant | BADHDUFLAG | Total packets | Discarded packets |
| A | 0 | 56 | 0 |
| B | 0 | 56 | 0 |
| C | 0 | 56 | 0 |
| D | 0 | 56 | 0 |
| Mode M0 | |||
|---|---|---|---|
| Quadrant | BADHDUFLAG | Total packets | Discarded packets |
| A | 0 | 5687 | 4 |
| B | 0 | 7225 | 1 |
| C | 0 | 5608 | 1 |
| D | 0 | 6177 | 1 |
| Mode M9 | |||
|---|---|---|---|
| Quadrant | BADHDUFLAG | Total packets | Discarded packets |
| A | 0 | 8 | 0 |
| B | 0 | 8 | 0 |
| C | 0 | 8 | 0 |
| D | 0 | 8 | 0 |
| Quadrant | Total seconds | Saturated seconds | Saturation percentage |
|---|---|---|---|
| A | 2713 | 45 | 1.658680% |
| B | 2714 | 164 | 6.042741% |
| C | 2714 | 28 | 1.031688% |
| D | 2714 | 44 | 1.621223% |
Noise dominated data is calculated using 1-second bins in cleaned event files. If a bin has >2000 counts, and if more than 50% of those come from <1% of pixels, then it is considered to be noise-dominated and hence unusable.
| Quadrant | # 1 sec bins | Bins with >0 counts | Bins with >2000 counts | High rate bins dominated by noise | Noise dominated (total time) | Noise dominated (detector-on time) | Marked lightcurve |
|---|---|---|---|---|---|---|---|
| A | 3499 | 2715 | 2 | 2 | 0.06% | 0.07% | 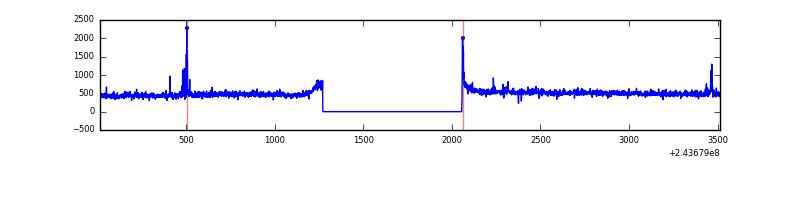 |
| B | 3500 | 2716 | 58 | 58 | 1.66% | 2.14% | 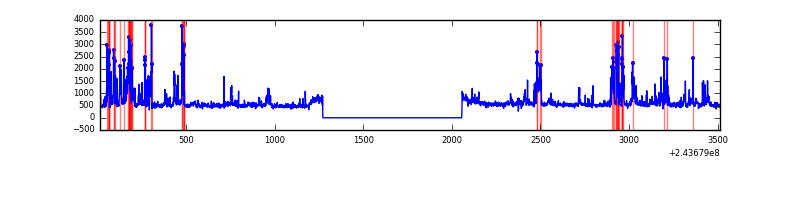 |
| C | 3500 | 2716 | 0 | 0 | 0.00% | 0.00% | 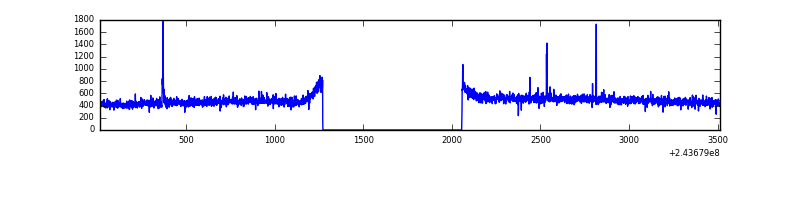 |
| D | 3500 | 2716 | 7 | 7 | 0.20% | 0.26% | 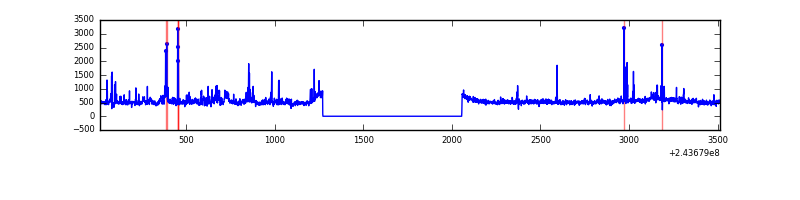 |
Top three noisy pixels from each quadrant. If the there are fewer than three noisy pixels in the level2.evt file, extra rows are filled as -1
| Pixel properties | Quadrant properties | ||||||
|---|---|---|---|---|---|---|---|
| Quadrant | DetID | PixID | Counts | Sigma | Mean | Median | Sigma |
| A | 15 | 174 | 15559 | 211.79 | 342 | 334 | 71.9 |
| A | 14 | 254 | 14847 | 201.89 | 342 | 334 | 71.9 |
| A | 1 | 162 | 4795 | 62.06 | 342 | 334 | 71.9 |
| B | 4 | 239 | 348753 | 5196.39 | 340 | 333 | 67.1 |
| B | 4 | 81 | 106951 | 1590.12 | 340 | 333 | 67.1 |
| B | 0 | 219 | 35706 | 527.56 | 340 | 333 | 67.1 |
| C | 14 | 234 | 9001 | 110.35 | 333 | 334 | 78.5 |
| C | 15 | 48 | 6852 | 82.99 | 333 | 334 | 78.5 |
| C | 13 | 61 | 2521 | 27.84 | 333 | 334 | 78.5 |
| D | 2 | 16 | 106463 | 1303.12 | 331 | 321 | 81.5 |
| D | 2 | 14 | 44137 | 537.94 | 331 | 321 | 81.5 |
| D | 1 | 52 | 35510 | 432.02 | 331 | 321 | 81.5 |
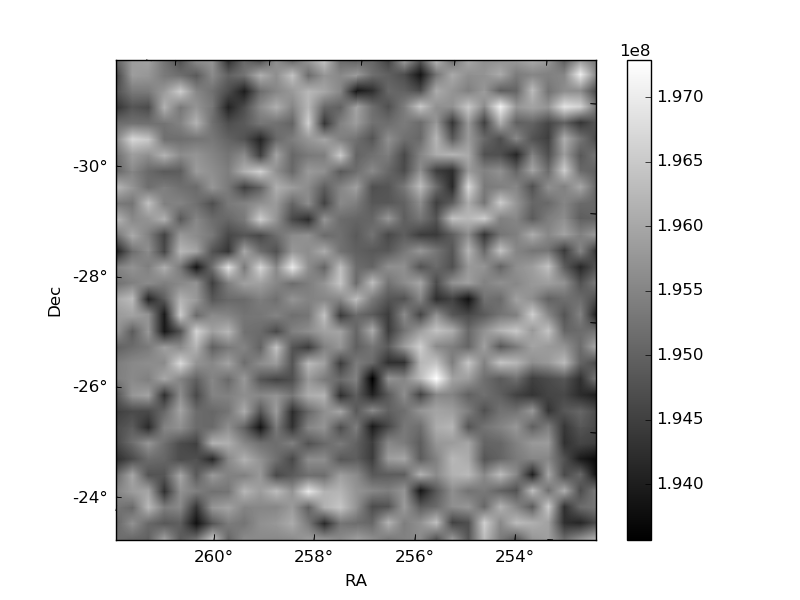
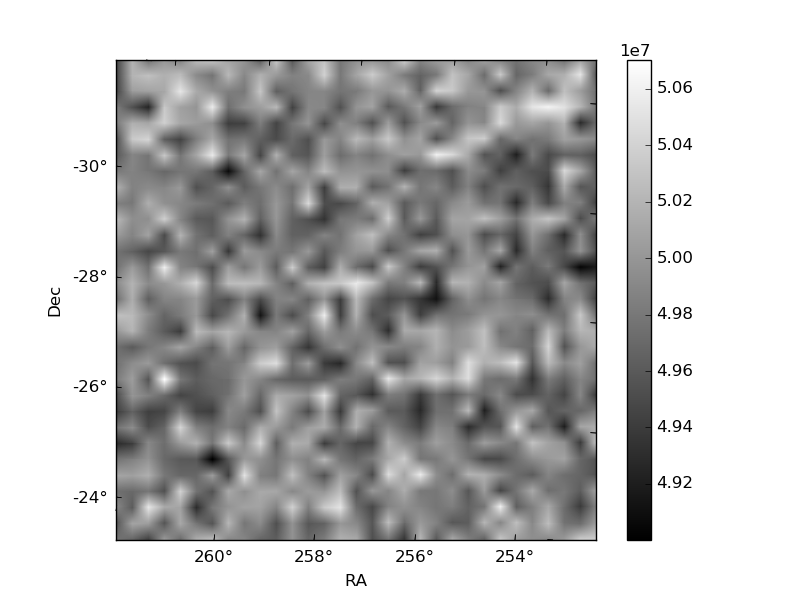
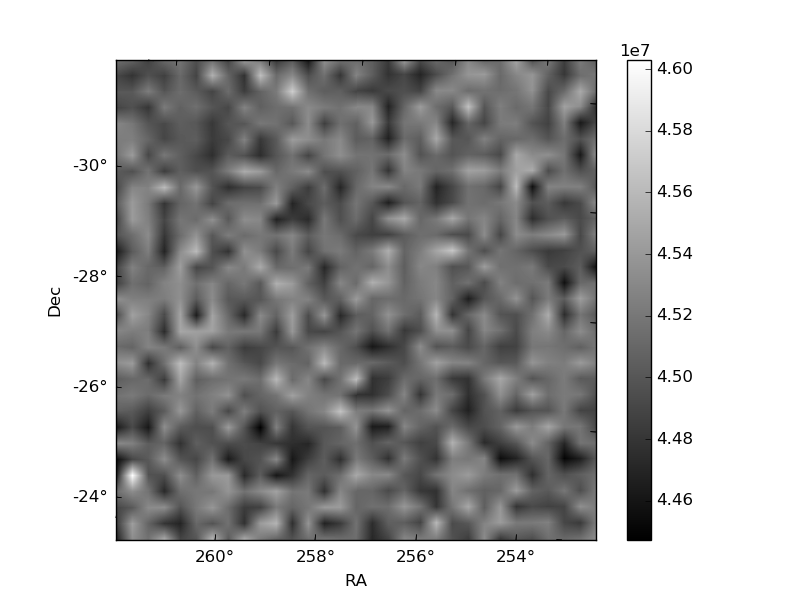
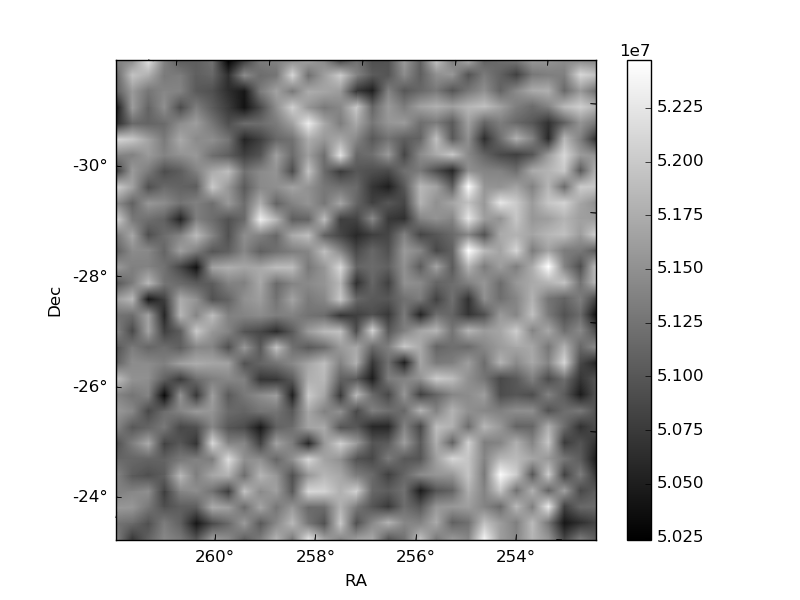
Histogram calculated using DETX and DETY for each event in the final _common_clean file
| Quadrant A | 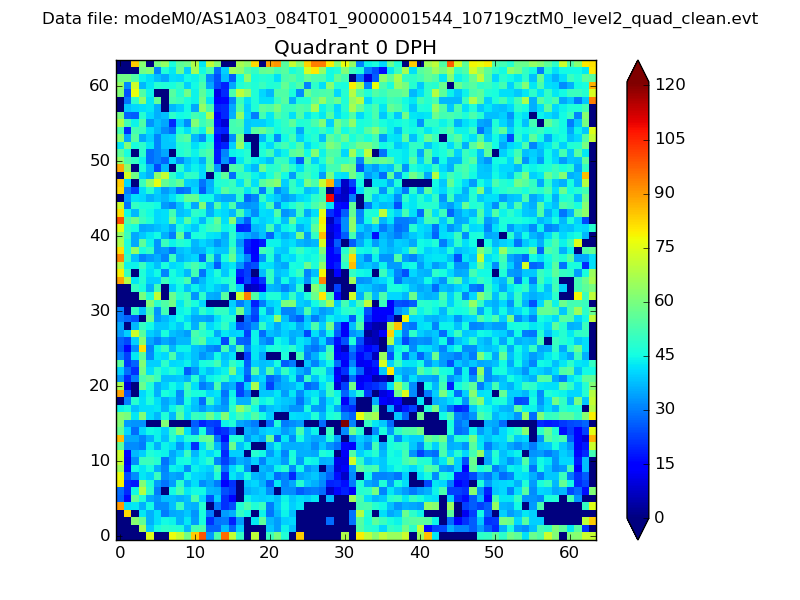 |
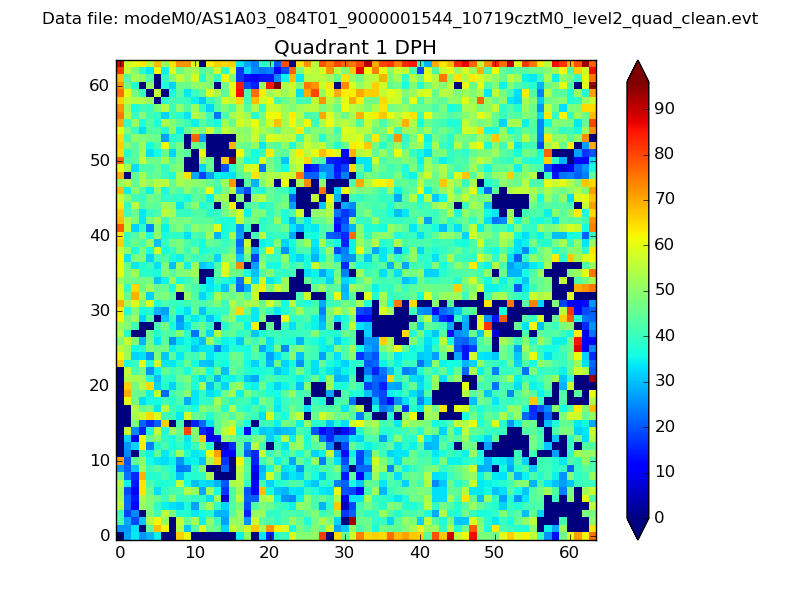 |
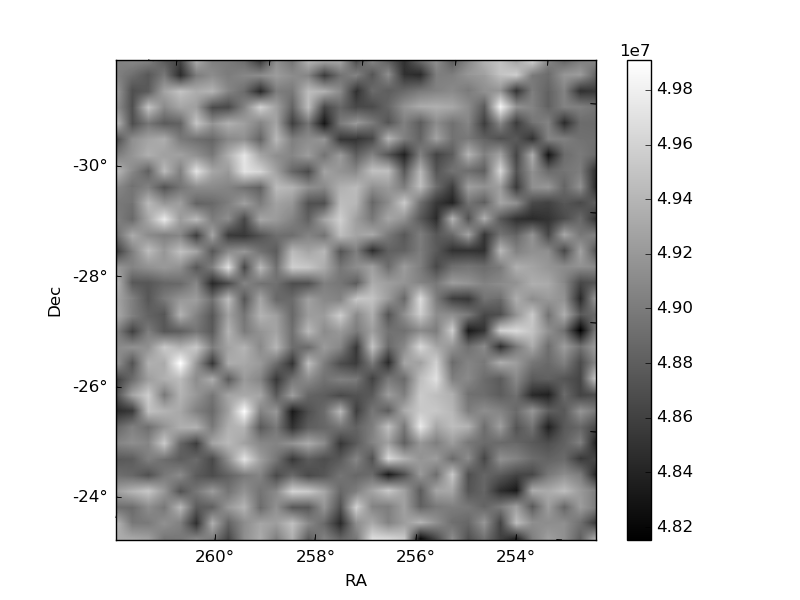
Quadrant B |
|---|---|---|---|
| Quadrant D | 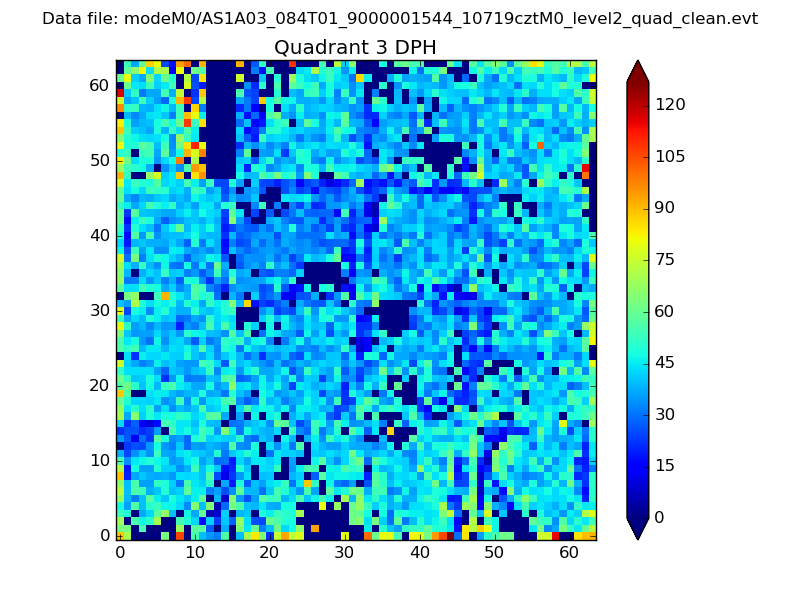 |
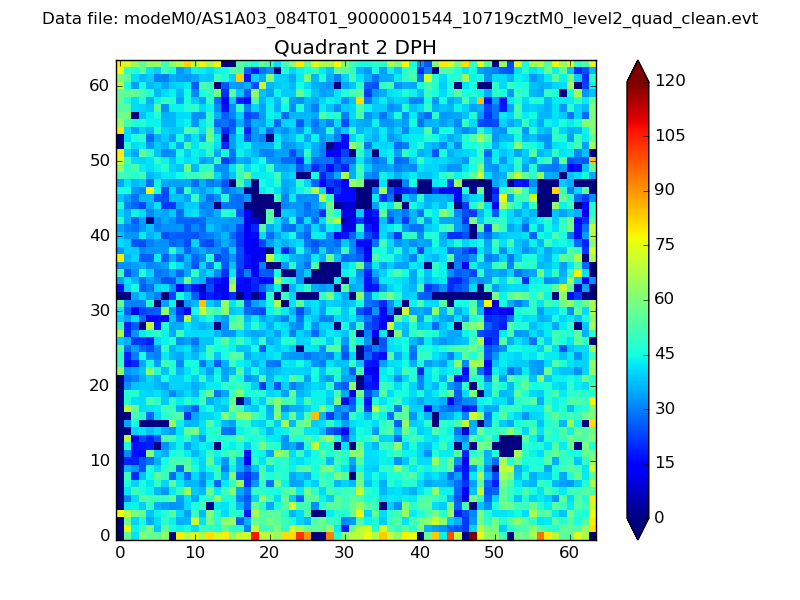 |
Quadrant C |
| Plot type | Count rate plots | Images |
|---|---|---|
| Comparison with Poisson distribution Blue bars denote a histogram of data divided into 1 sec bins. Red curve is a Poisson curve with rate = median count rate of data. |
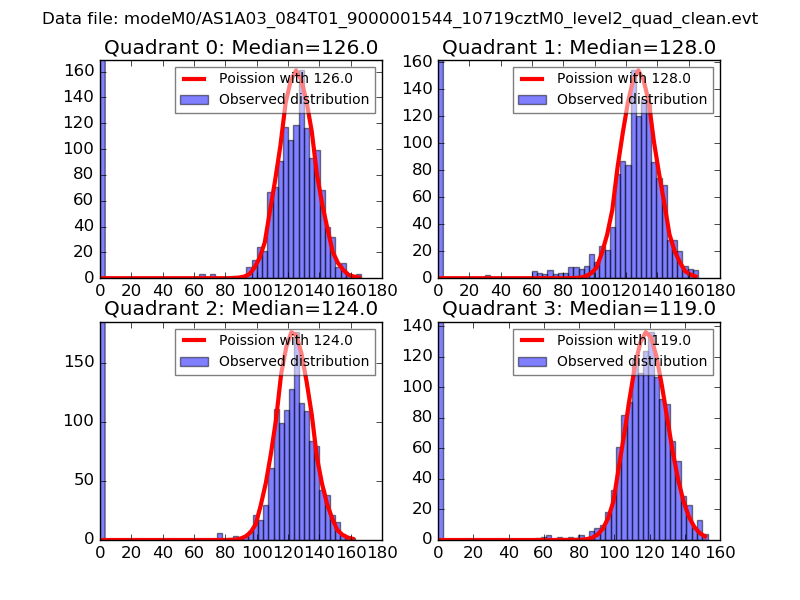 |
 |
| Quadrant-wise count rates Data is divided into 100 sec bins |
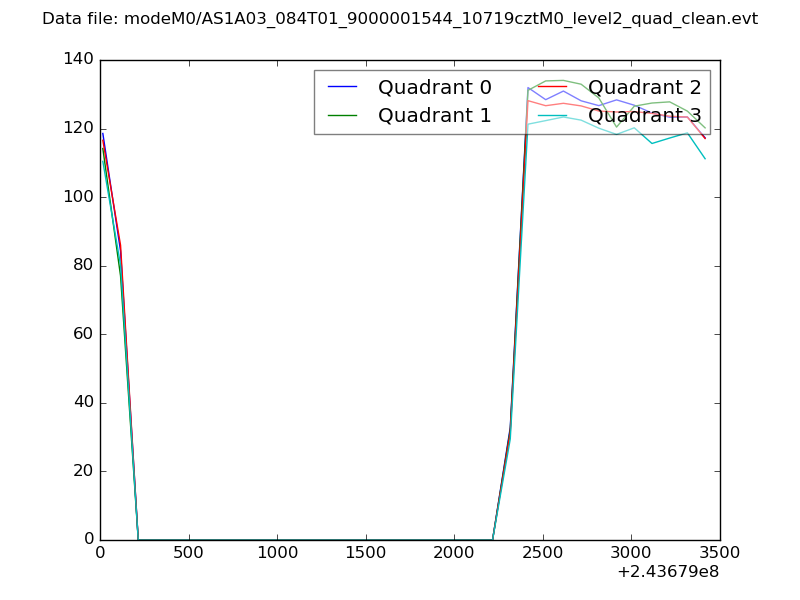 |
|
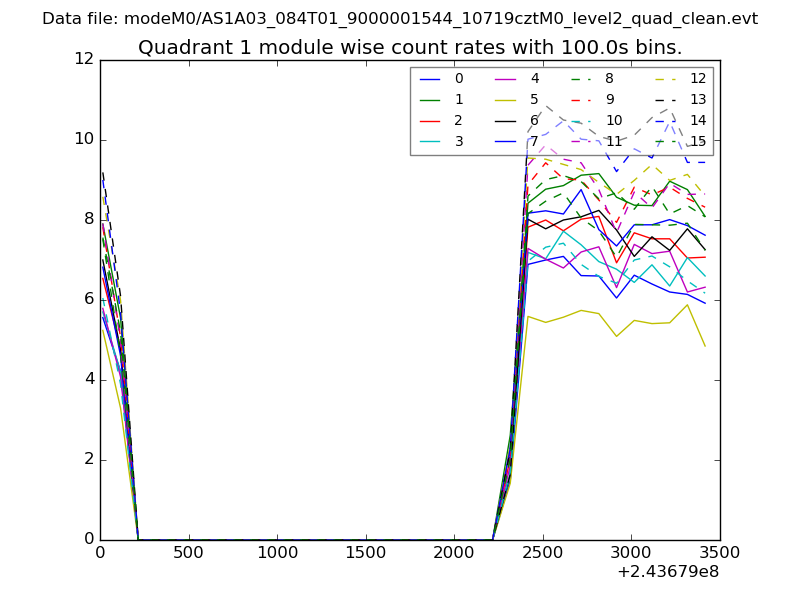
| Module-wise count rates for Quadrant A Data is divided into 100 sec bins |
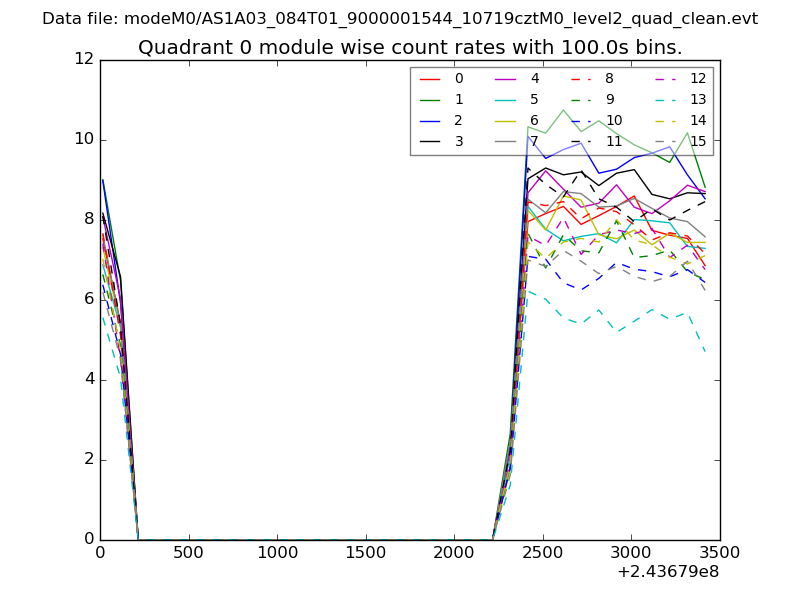 |
 |
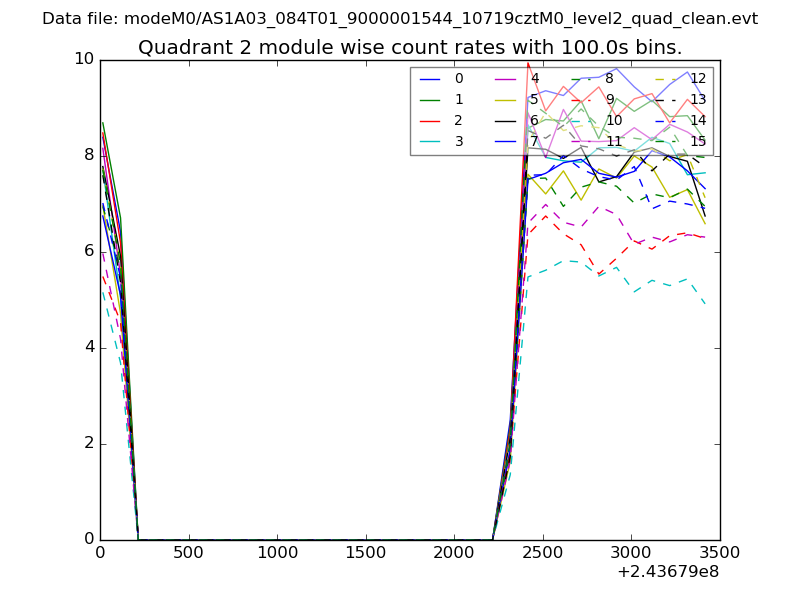
| Module-wise count rates for Quadrant B Data is divided into 100 sec bins |
 |
 |
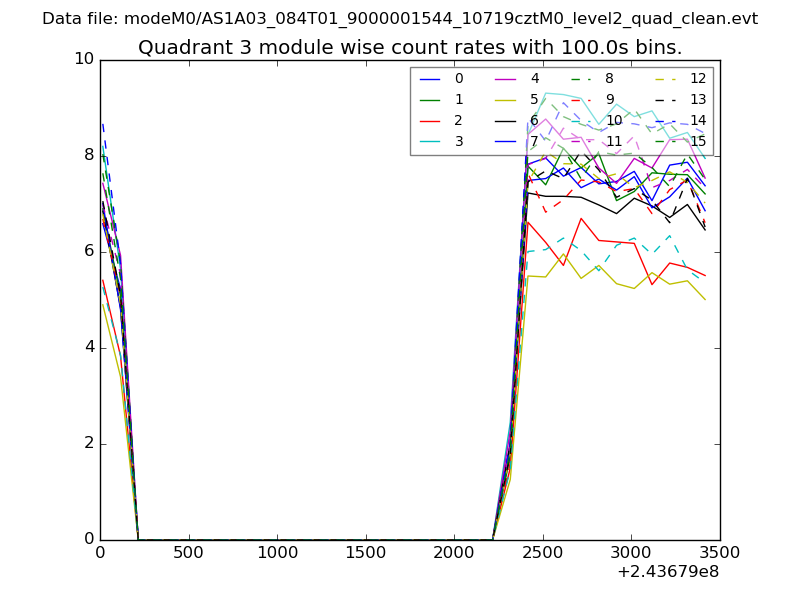
| Module-wise count rates for Quadrant C Data is divided into 100 sec bins |
 |
 |
| Module-wise count rates for Quadrant D Data is divided into 100 sec bins |
 |
 |
| Parameter | Plot |
|---|---|
| CZT HV Monitor | 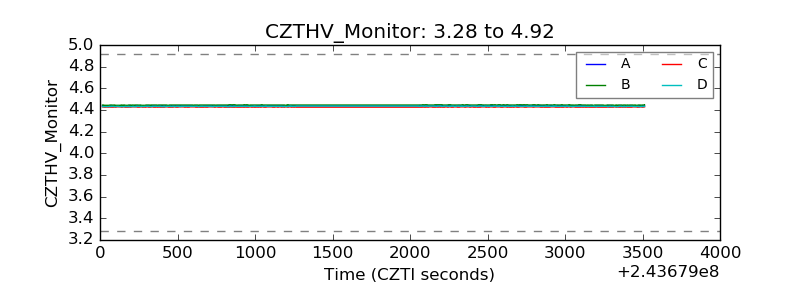 |
| D_VDD | 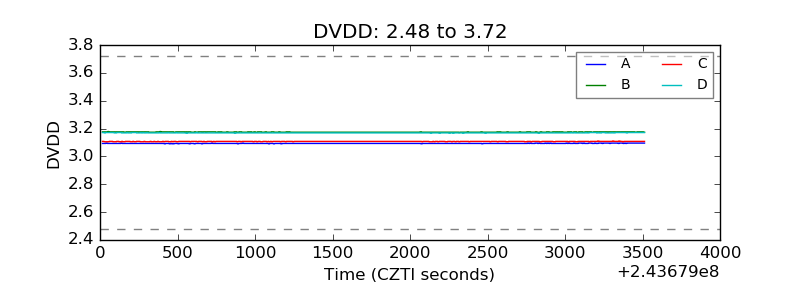 |
| Temperature 1 | 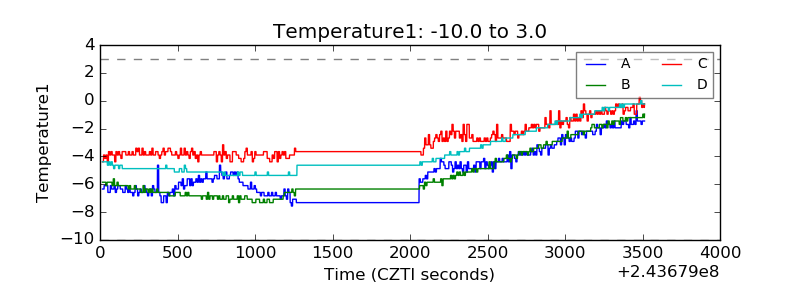 |
| Veto HV Monitor | 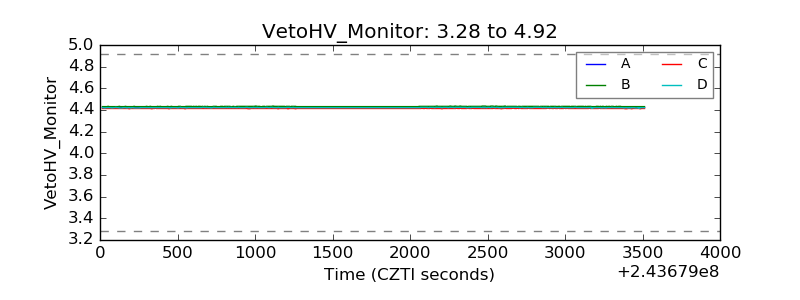 |
| Veto LLD | 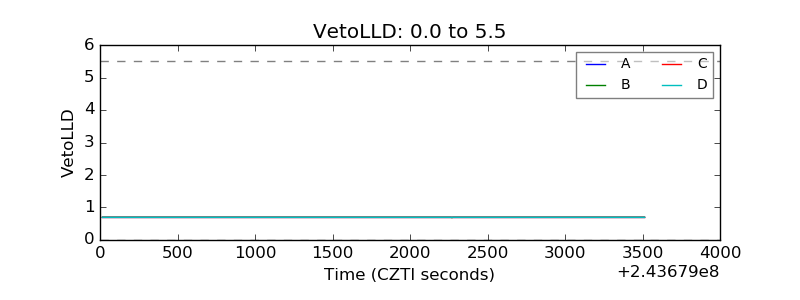 |
| Alpha Counter | 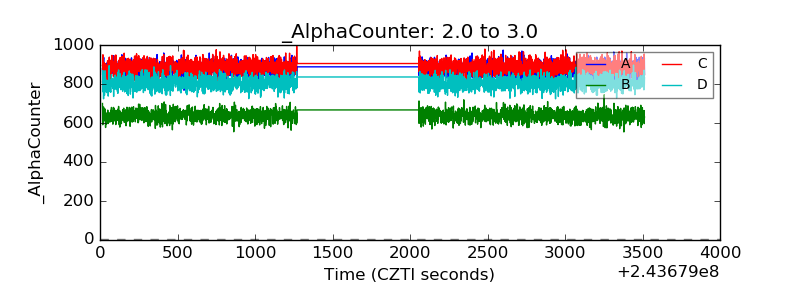 |
| _CPM_Rate | 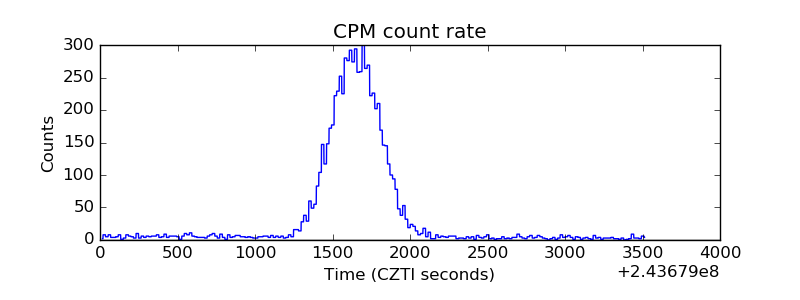 |
| CZT Counter | 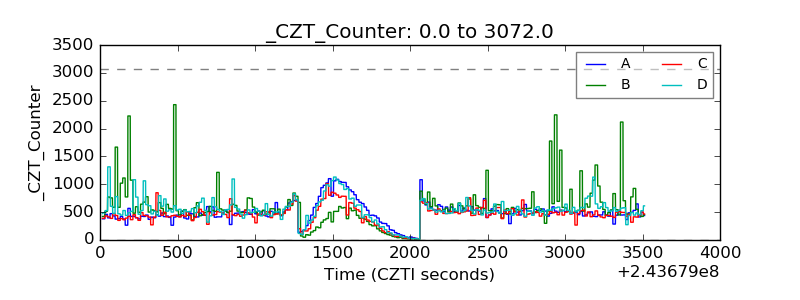 |
| +2.5 Volts monitor |  |
| +5 Volts monitor |  |
| _ROLL_ROT |  |
| _Roll_DEC | 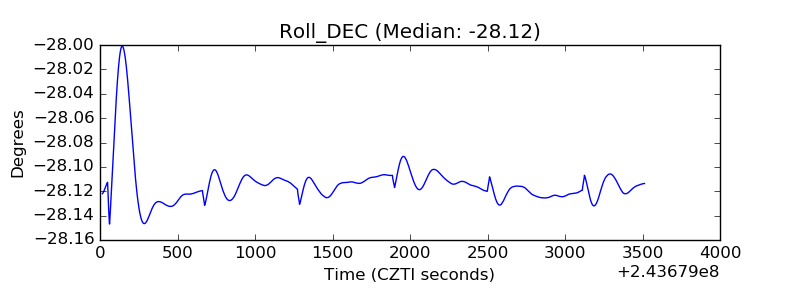 |
| _Roll_RA | 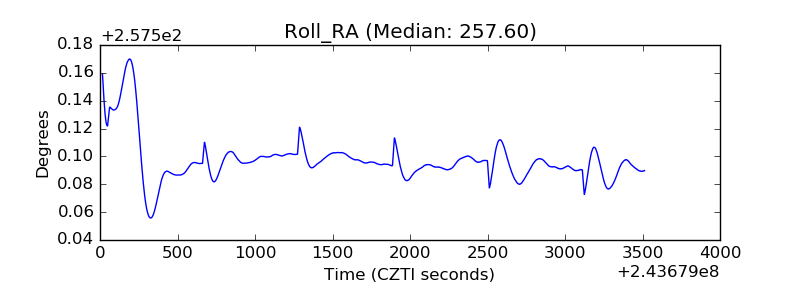 |
| Veto Counter |  |