| Param | Original file | Final file |
|---|---|---|
| Filename | modeM0/AS1A03_084T01_9000001544_10723cztM0_level2.evt | modeM0/AS1A03_084T01_9000001544_10723cztM0_level2_quad_clean.evt |
| Size (bytes) | 474,235,200 | 84,078,720 |
| Size | 452.3 MB | 80.2 MB |
| Events in quadrant A | 2,976,839 | 549,986 |
| Events in quadrant B | 4,040,946 | 543,674 |
| Events in quadrant C | 2,756,386 | 534,769 |
| Events in quadrant D | 4,177,145 | 494,886 |
| Mode SS | |||
|---|---|---|---|
| Quadrant | BADHDUFLAG | Total packets | Discarded packets |
| A | 0 | 124 | 0 |
| B | 0 | 124 | 0 |
| C | 0 | 124 | 0 |
| D | 0 | 124 | 0 |
| Mode M0 | |||
|---|---|---|---|
| Quadrant | BADHDUFLAG | Total packets | Discarded packets |
| A | 0 | 12842 | 2 |
| B | 0 | 15933 | 1 |
| C | 0 | 12411 | 1 |
| D | 0 | 16472 | 1 |
| Mode M9 | |||
|---|---|---|---|
| Quadrant | BADHDUFLAG | Total packets | Discarded packets |
| A | 0 | 12 | 0 |
| B | 0 | 12 | 0 |
| C | 0 | 12 | 0 |
| D | 0 | 12 | 0 |
| Quadrant | Total seconds | Saturated seconds | Saturation percentage |
|---|---|---|---|
| A | 6049 | 66 | 1.091089% |
| B | 6049 | 286 | 4.728054% |
| C | 6049 | 34 | 0.562076% |
| D | 6049 | 248 | 4.099851% |
Noise dominated data is calculated using 1-second bins in cleaned event files. If a bin has >2000 counts, and if more than 50% of those come from <1% of pixels, then it is considered to be noise-dominated and hence unusable.
| Quadrant | # 1 sec bins | Bins with >0 counts | Bins with >2000 counts | High rate bins dominated by noise | Noise dominated (total time) | Noise dominated (detector-on time) | Marked lightcurve |
|---|---|---|---|---|---|---|---|
| A | 7239 | 6050 | 5 | 5 | 0.07% | 0.08% | 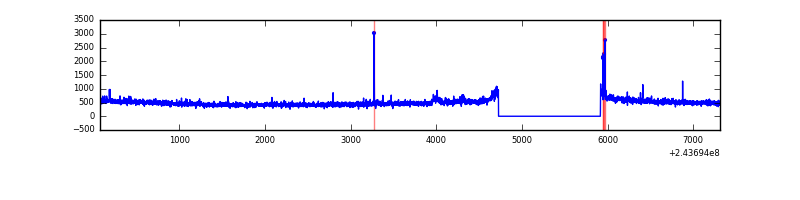 |
| B | 7239 | 6049 | 170 | 170 | 2.35% | 2.81% | 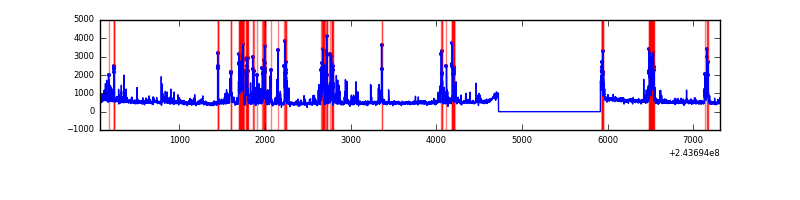 |
| C | 7239 | 6050 | 0 | 0 | 0.00% | 0.00% | 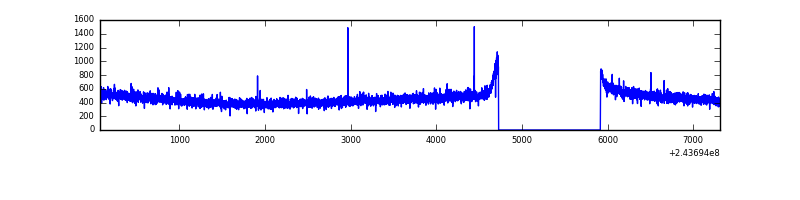 |
| D | 7239 | 6050 | 187 | 187 | 2.58% | 3.09% | 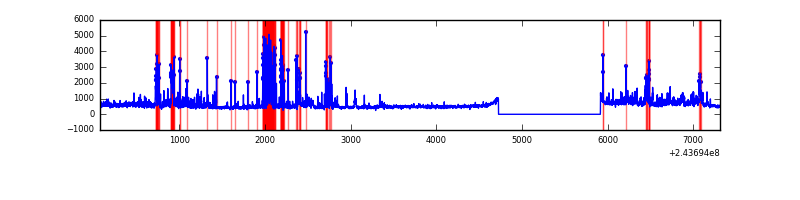 |
Top three noisy pixels from each quadrant. If the there are fewer than three noisy pixels in the level2.evt file, extra rows are filled as -1
| Pixel properties | Quadrant properties | ||||||
|---|---|---|---|---|---|---|---|
| Quadrant | DetID | PixID | Counts | Sigma | Mean | Median | Sigma |
| A | 13 | 251 | 39608 | 257.86 | 740 | 724 | 150.8 |
| A | 1 | 162 | 27545 | 177.87 | 740 | 724 | 150.8 |
| A | 15 | 174 | 20690 | 132.41 | 740 | 724 | 150.8 |
| B | 4 | 239 | 1010788 | 7278.56 | 729 | 713 | 138.8 |
| B | 0 | 219 | 57476 | 409.03 | 729 | 713 | 138.8 |
| B | 15 | 204 | 54682 | 388.9 | 729 | 713 | 138.8 |
| C | 13 | 61 | 5409 | 28.61 | 705 | 711 | 164.2 |
| C | 14 | 234 | 4103 | 20.66 | 705 | 711 | 164.2 |
| C | 1 | 0 | 2623 | 11.64 | 705 | 711 | 164.2 |
| D | 10 | 199 | 624214 | 3742.17 | 694 | 674 | 166.6 |
| D | 8 | 195 | 274345 | 1642.44 | 694 | 674 | 166.6 |
| D | 5 | 222 | 176279 | 1053.89 | 694 | 674 | 166.6 |
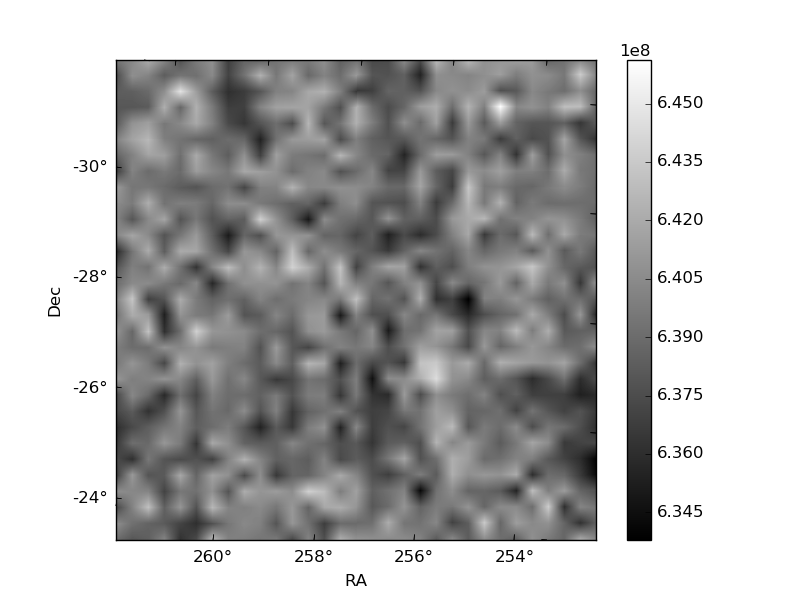
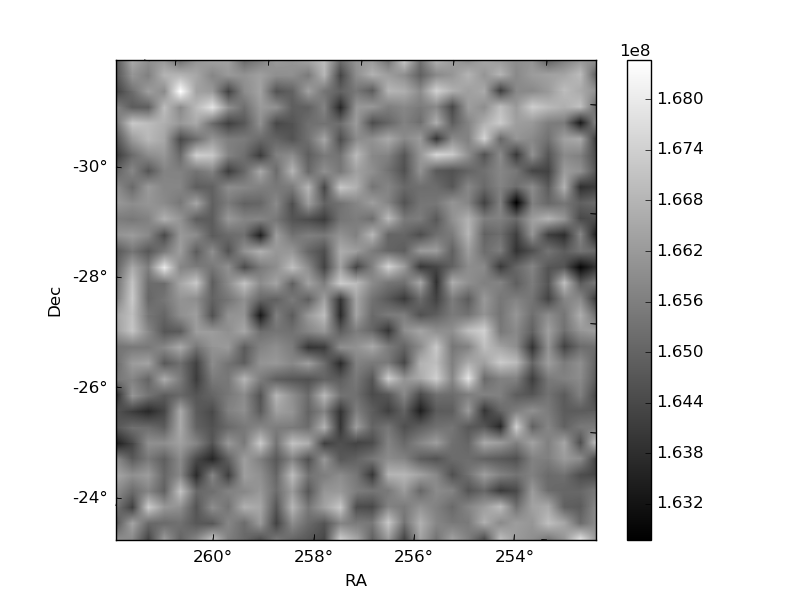
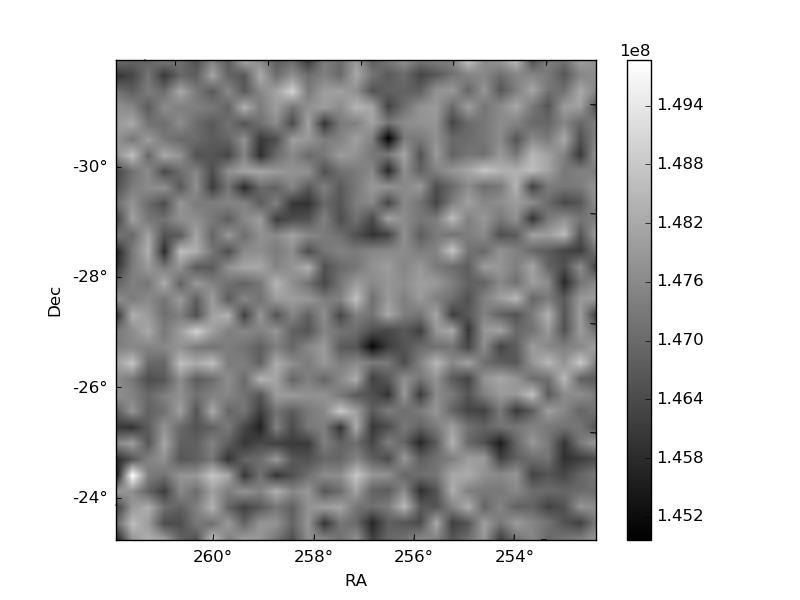
Histogram calculated using DETX and DETY for each event in the final _common_clean file
| Quadrant A | 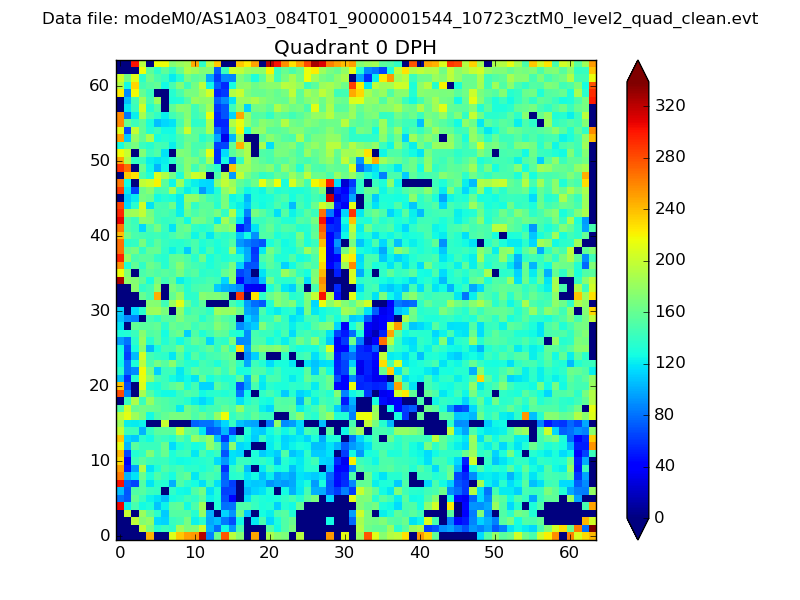 |
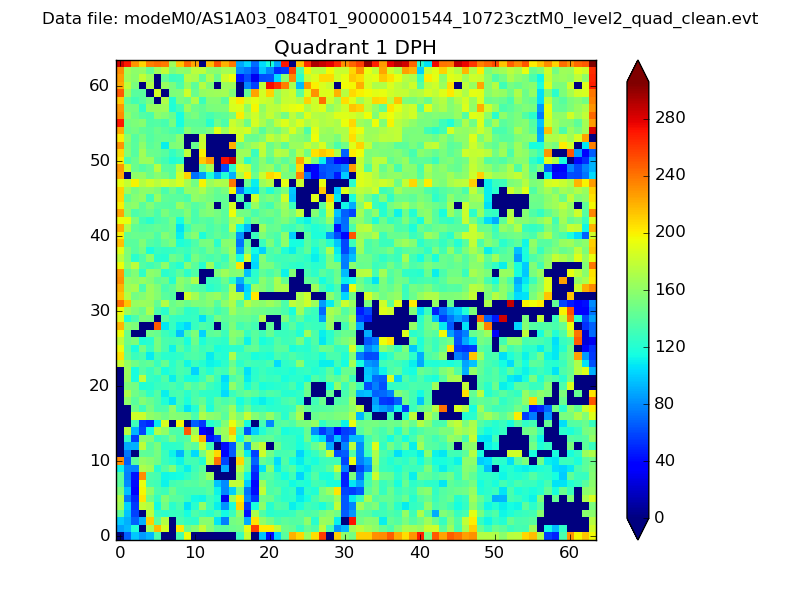 |
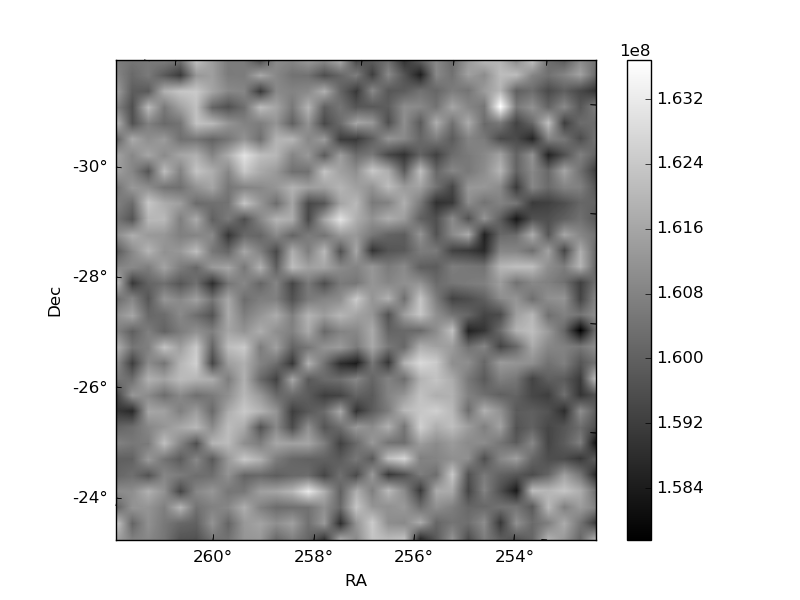
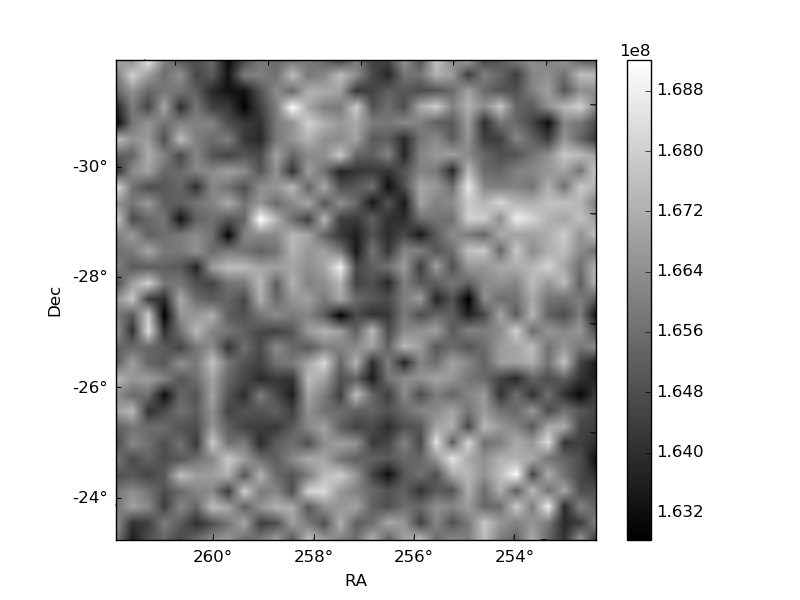
Quadrant B |
|---|---|---|---|
| Quadrant D | 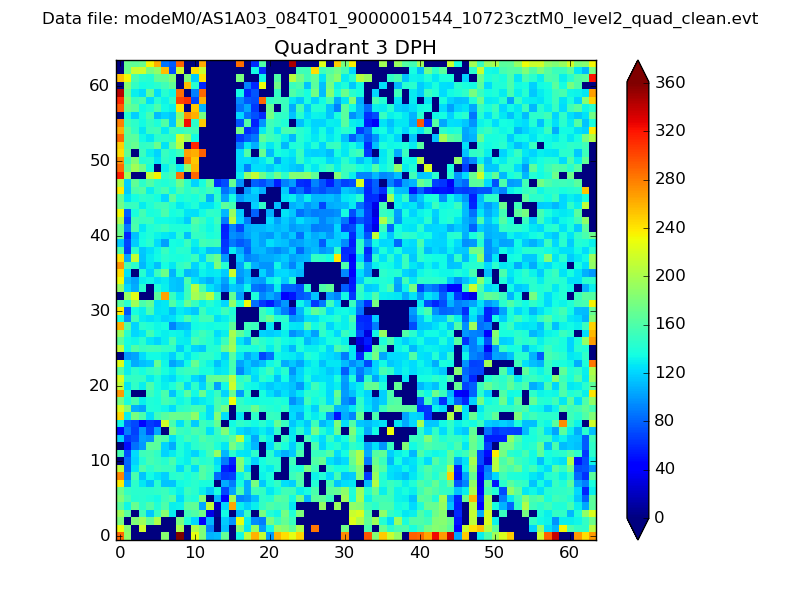 |
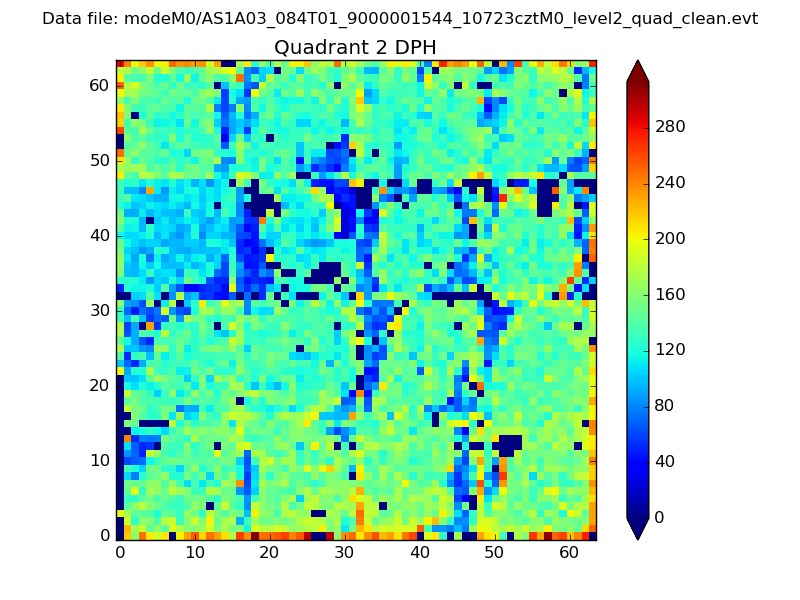 |
Quadrant C |
| Plot type | Count rate plots | Images |
|---|---|---|
| Comparison with Poisson distribution Blue bars denote a histogram of data divided into 1 sec bins. Red curve is a Poisson curve with rate = median count rate of data. |
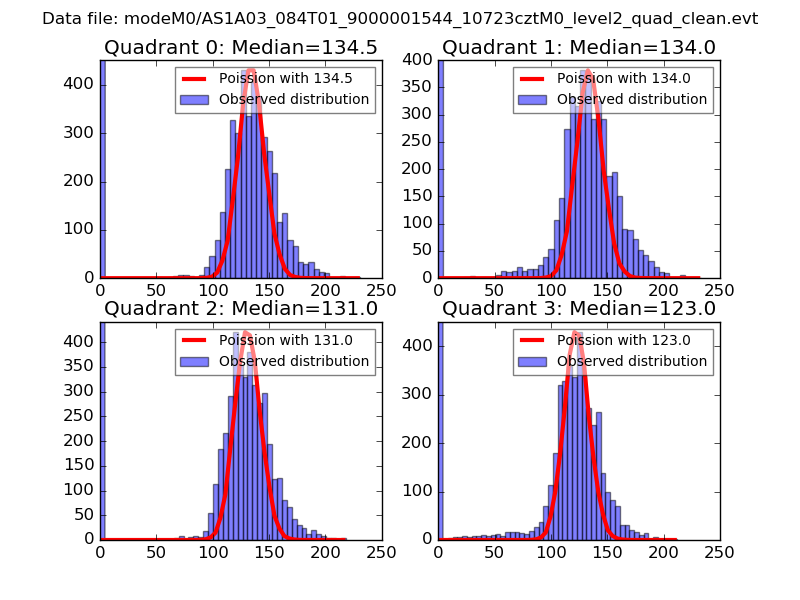 |
 |
| Quadrant-wise count rates Data is divided into 100 sec bins |
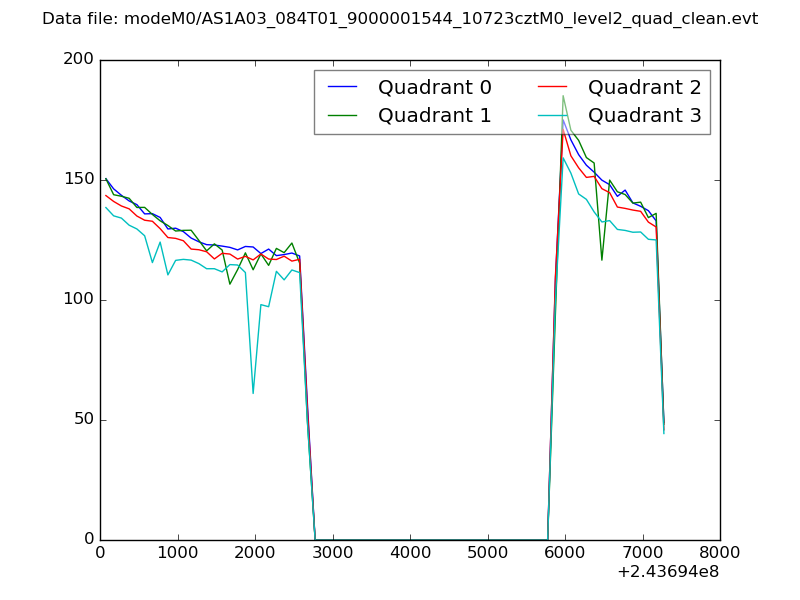 |
|
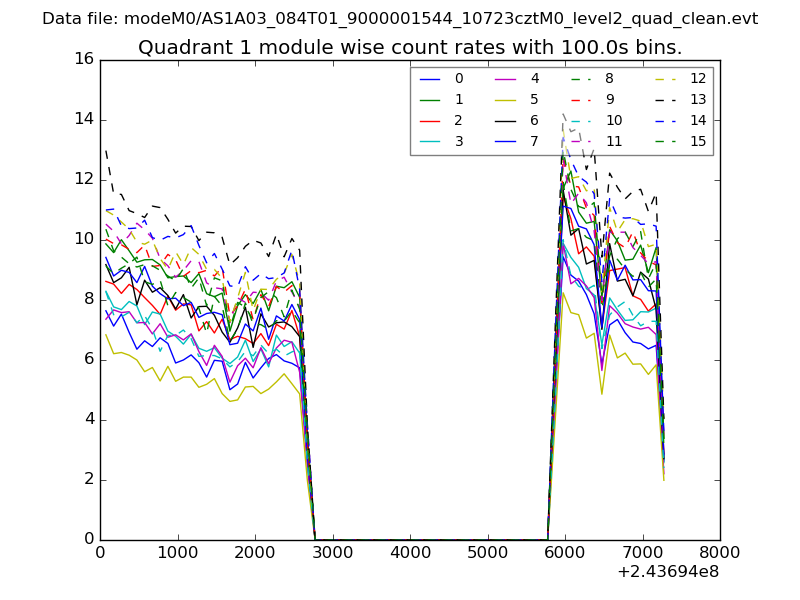
| Module-wise count rates for Quadrant A Data is divided into 100 sec bins |
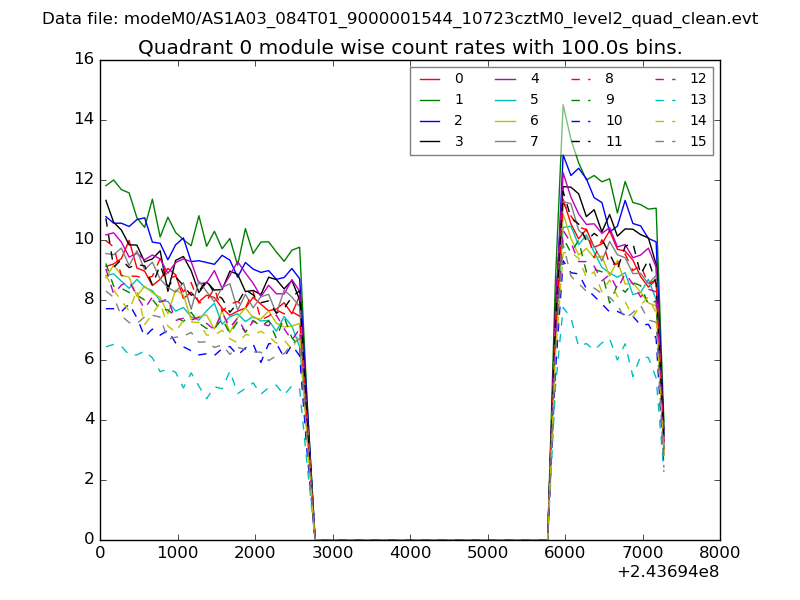 |
 |
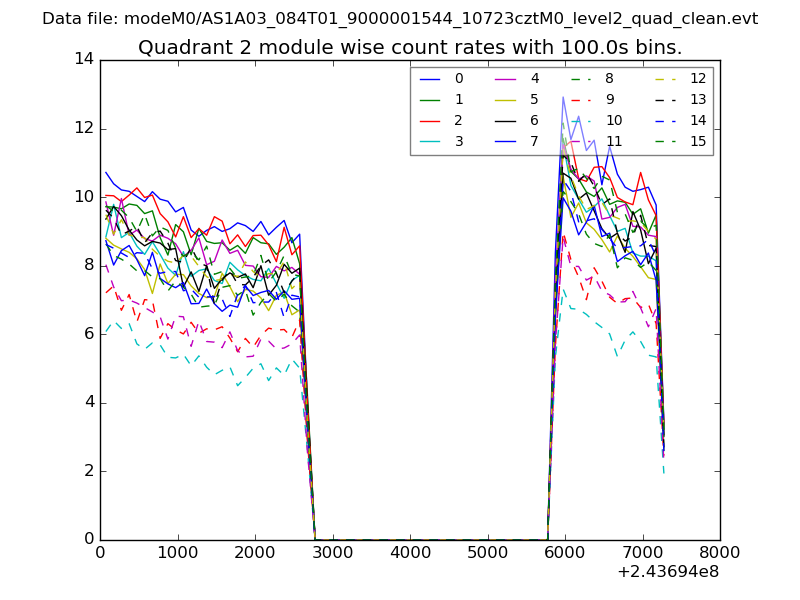
| Module-wise count rates for Quadrant B Data is divided into 100 sec bins |
 |
 |
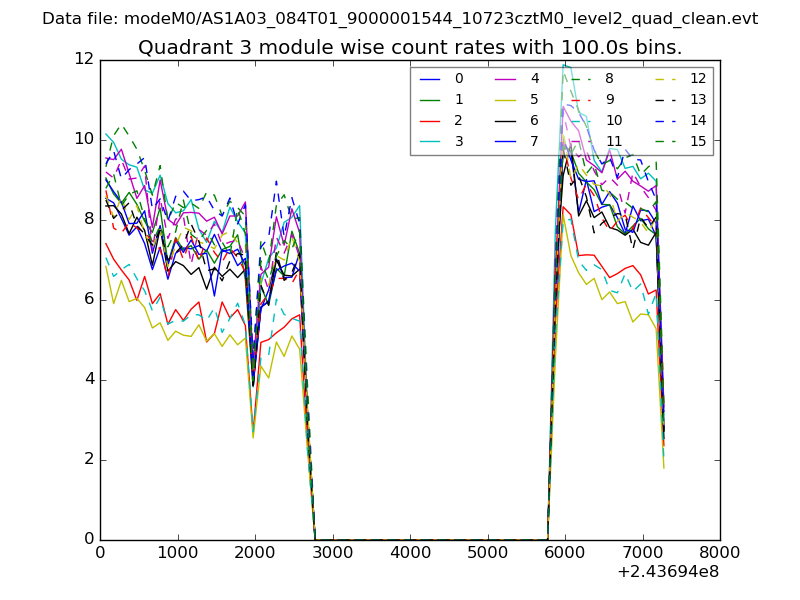
| Module-wise count rates for Quadrant C Data is divided into 100 sec bins |
 |
 |
| Module-wise count rates for Quadrant D Data is divided into 100 sec bins |
 |
 |
| Parameter | Plot |
|---|---|
| CZT HV Monitor | 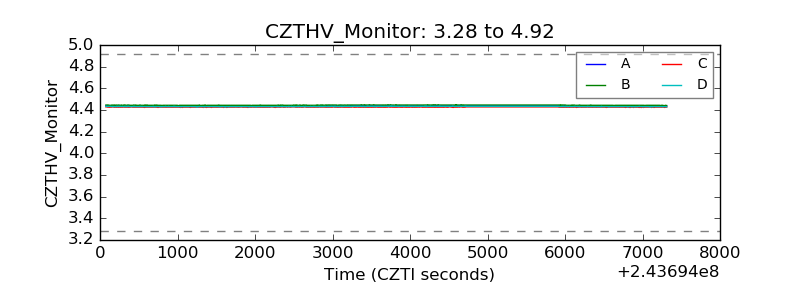 |
| D_VDD | 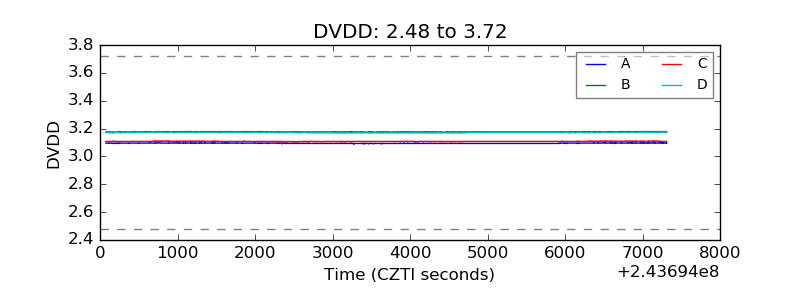 |
| Temperature 1 | 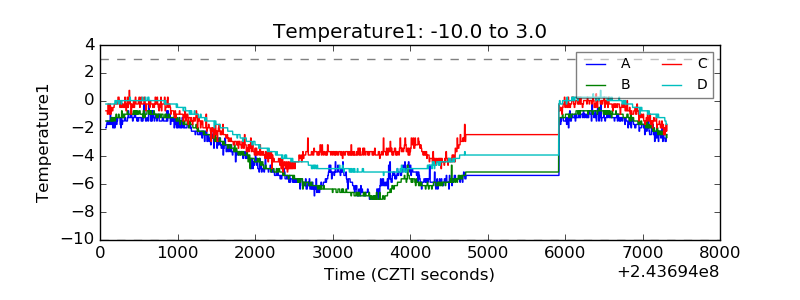 |
| Veto HV Monitor | 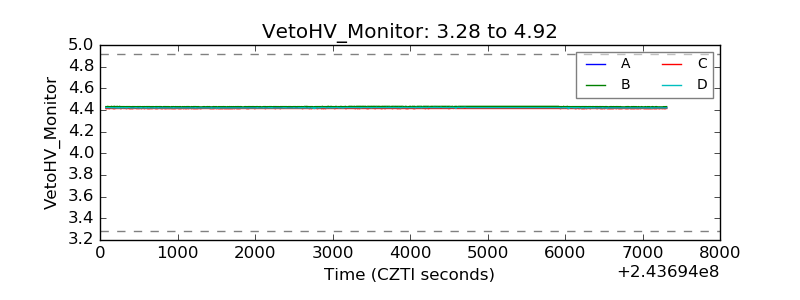 |
| Veto LLD | 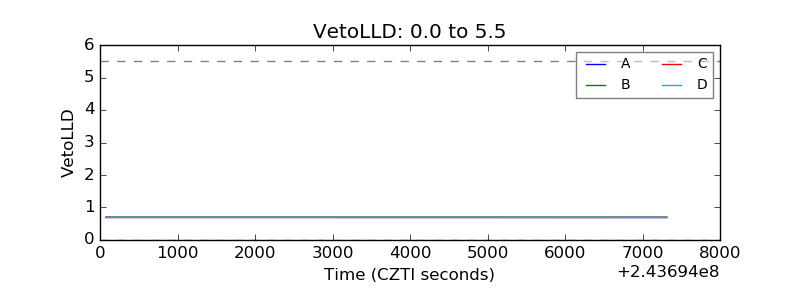 |
| Alpha Counter | 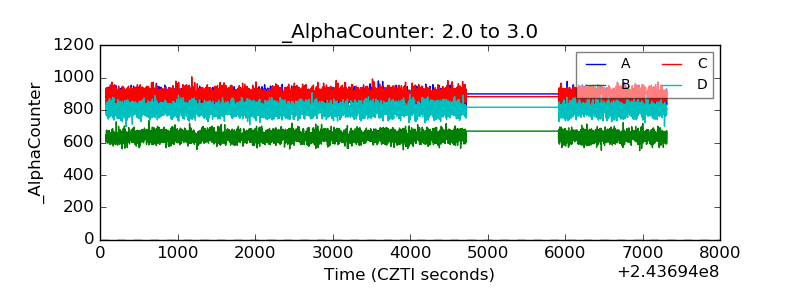 |
| _CPM_Rate | 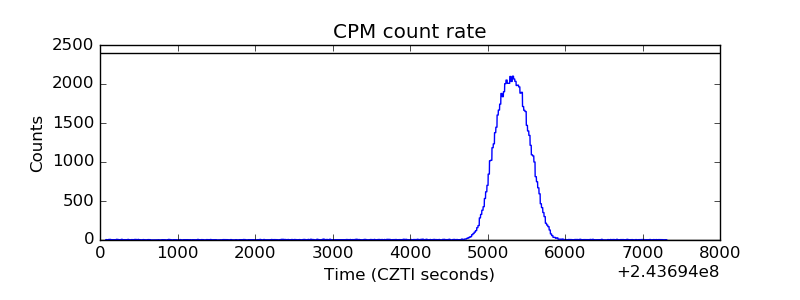 |
| CZT Counter | 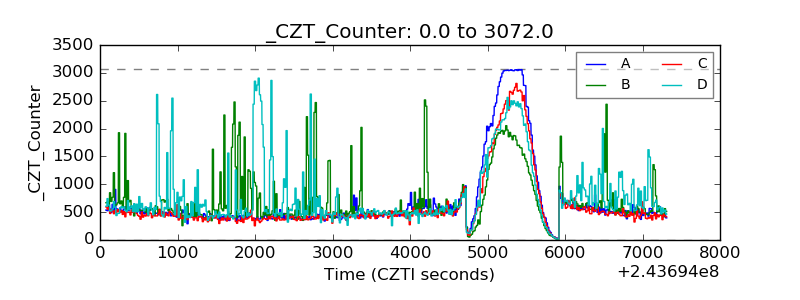 |
| +2.5 Volts monitor |  |
| +5 Volts monitor | 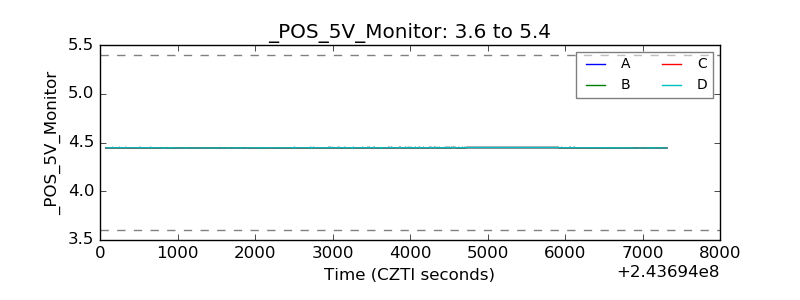 |
| _ROLL_ROT | 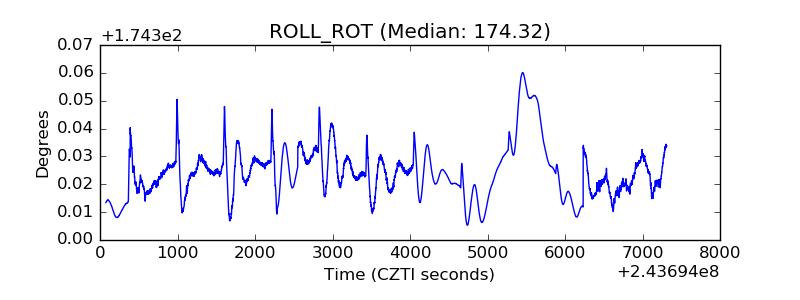 |
| _Roll_DEC | 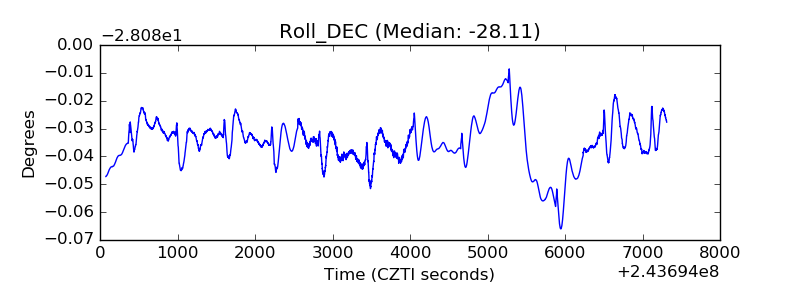 |
| _Roll_RA | 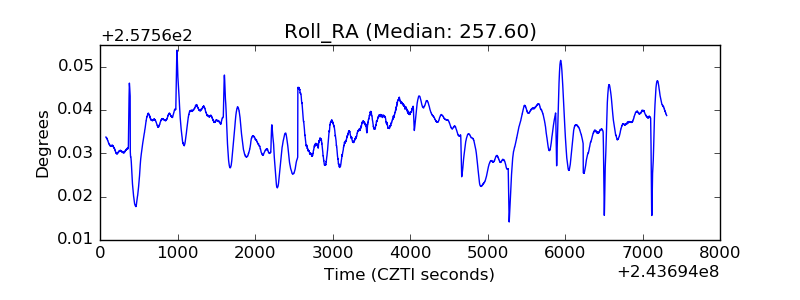 |
| Veto Counter |  |