| Param | Original file | Final file |
|---|---|---|
| Filename | modeM0/AS1A03_084T01_9000001544_10725cztM0_level2.evt | modeM0/AS1A03_084T01_9000001544_10725cztM0_level2_quad_clean.evt |
| Size (bytes) | 444,142,080 | 73,601,280 |
| Size | 423.6 MB | 70.2 MB |
| Events in quadrant A | 2,745,904 | 476,898 |
| Events in quadrant B | 4,180,419 | 462,676 |
| Events in quadrant C | 2,581,790 | 465,944 |
| Events in quadrant D | 3,565,098 | 434,027 |
| Mode SS | |||
|---|---|---|---|
| Quadrant | BADHDUFLAG | Total packets | Discarded packets |
| A | 0 | 112 | 0 |
| B | 0 | 112 | 0 |
| C | 0 | 112 | 0 |
| D | 0 | 112 | 0 |
| Mode M0 | |||
|---|---|---|---|
| Quadrant | BADHDUFLAG | Total packets | Discarded packets |
| A | 0 | 11732 | 1 |
| B | 0 | 16024 | 1 |
| C | 0 | 11459 | 1 |
| D | 0 | 14176 | 1 |
| Mode M9 | |||
|---|---|---|---|
| Quadrant | BADHDUFLAG | Total packets | Discarded packets |
| A | 0 | 13 | 0 |
| B | 0 | 13 | 0 |
| C | 0 | 13 | 0 |
| D | 0 | 13 | 0 |
| Quadrant | Total seconds | Saturated seconds | Saturation percentage |
|---|---|---|---|
| A | 5563 | 43 | 0.772964% |
| B | 5563 | 413 | 7.424052% |
| C | 5563 | 24 | 0.431422% |
| D | 5563 | 80 | 1.438073% |
Noise dominated data is calculated using 1-second bins in cleaned event files. If a bin has >2000 counts, and if more than 50% of those come from <1% of pixels, then it is considered to be noise-dominated and hence unusable.
| Quadrant | # 1 sec bins | Bins with >0 counts | Bins with >2000 counts | High rate bins dominated by noise | Noise dominated (total time) | Noise dominated (detector-on time) | Marked lightcurve |
|---|---|---|---|---|---|---|---|
| A | 6848 | 5564 | 0 | 0 | 0.00% | 0.00% | 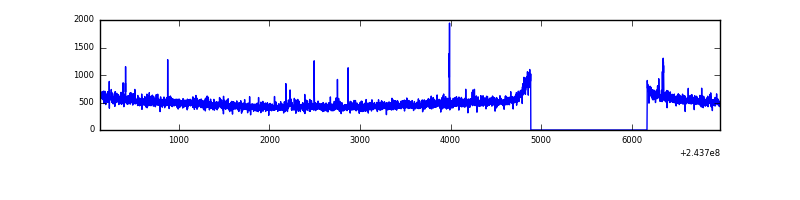 |
| B | 6848 | 5564 | 289 | 289 | 4.22% | 5.19% | 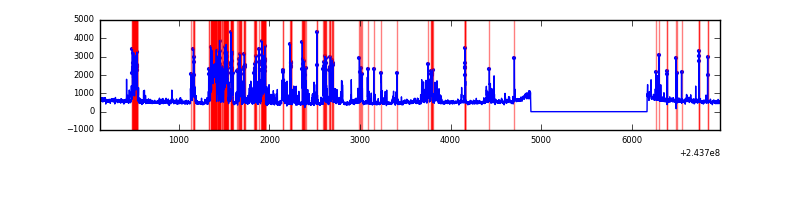 |
| C | 6848 | 5564 | 0 | 0 | 0.00% | 0.00% | 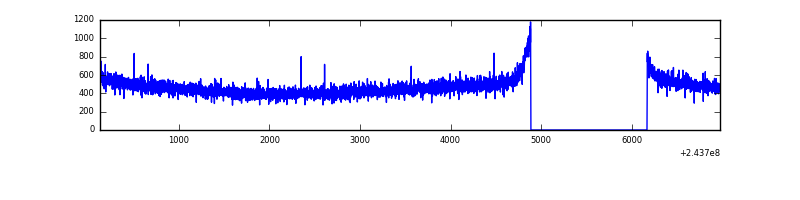 |
| D | 6848 | 5564 | 57 | 57 | 0.83% | 1.02% | 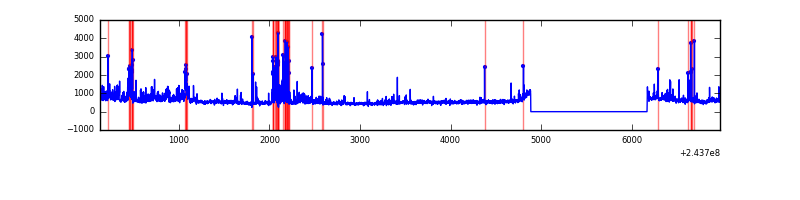 |
Top three noisy pixels from each quadrant. If the there are fewer than three noisy pixels in the level2.evt file, extra rows are filled as -1
| Pixel properties | Quadrant properties | ||||||
|---|---|---|---|---|---|---|---|
| Quadrant | DetID | PixID | Counts | Sigma | Mean | Median | Sigma |
| A | 15 | 174 | 20854 | 142.59 | 692 | 679 | 141.5 |
| A | 1 | 162 | 20156 | 137.65 | 692 | 679 | 141.5 |
| A | 13 | 251 | 17637 | 119.85 | 692 | 679 | 141.5 |
| B | 4 | 239 | 1157607 | 9029.65 | 677 | 664 | 128.1 |
| B | 4 | 81 | 230279 | 1792.09 | 677 | 664 | 128.1 |
| B | 15 | 204 | 41594 | 319.45 | 677 | 664 | 128.1 |
| C | 13 | 61 | 5120 | 29.08 | 660 | 664 | 153.3 |
| C | 14 | 234 | 1988 | 8.64 | 660 | 664 | 153.3 |
| C | 1 | 0 | 1902 | 8.08 | 660 | 664 | 153.3 |
| D | 8 | 195 | 397816 | 2536.85 | 653 | 636 | 156.6 |
| D | 10 | 199 | 275427 | 1755.14 | 653 | 636 | 156.6 |
| D | 5 | 222 | 154653 | 983.73 | 653 | 636 | 156.6 |
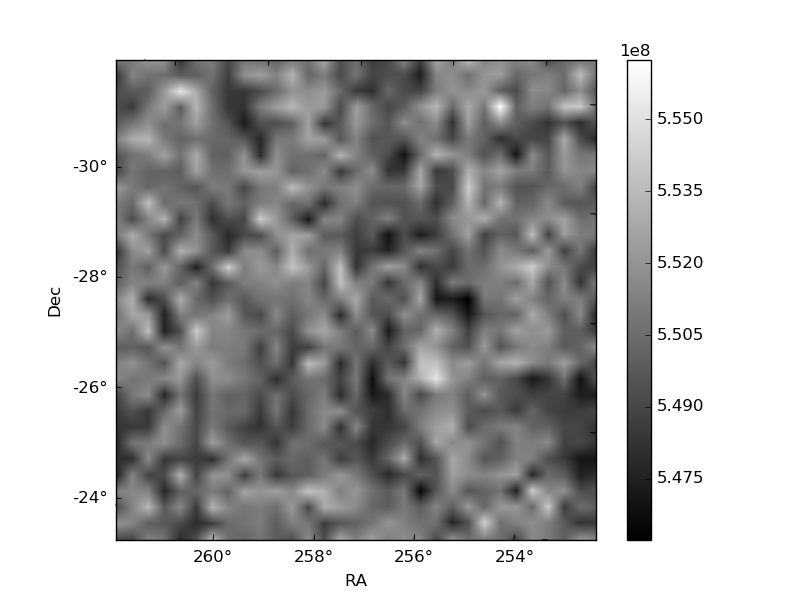
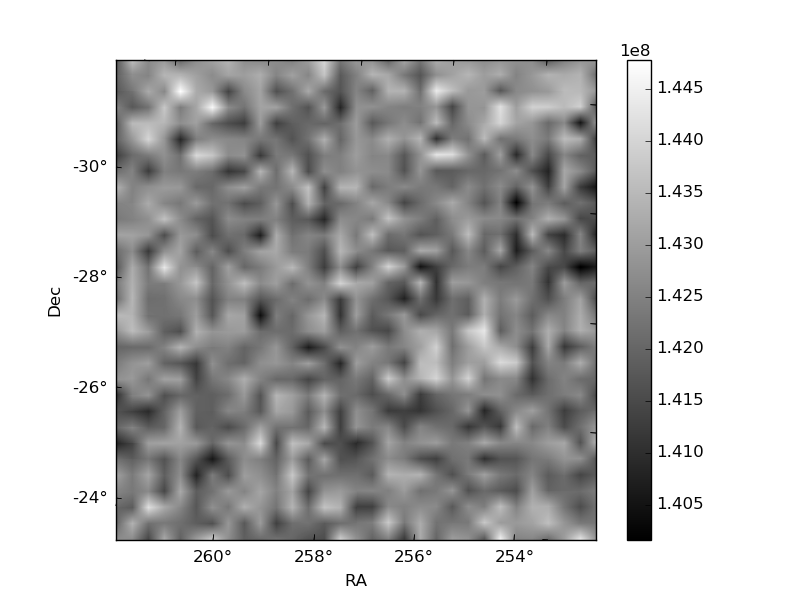
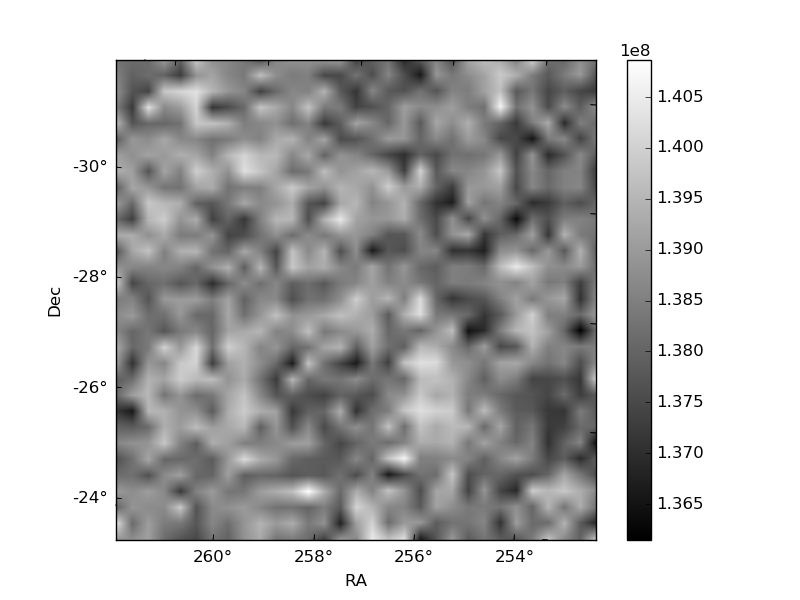
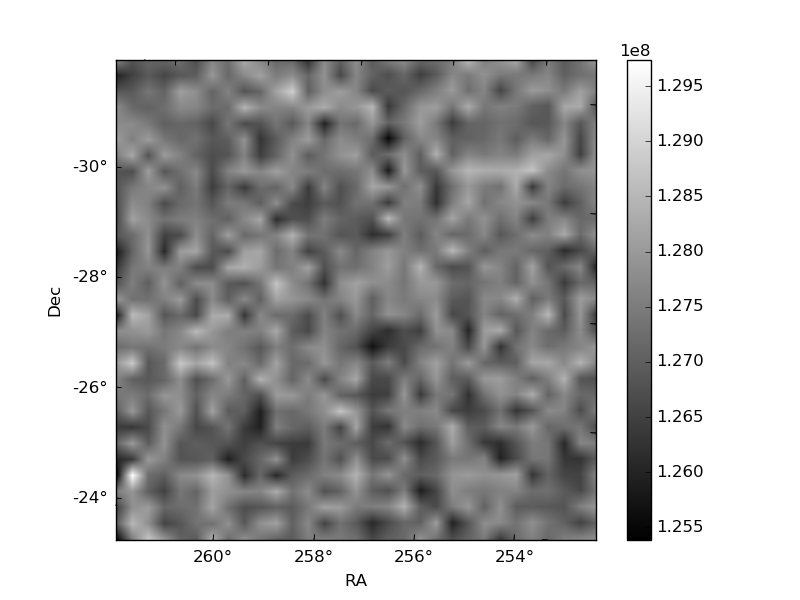
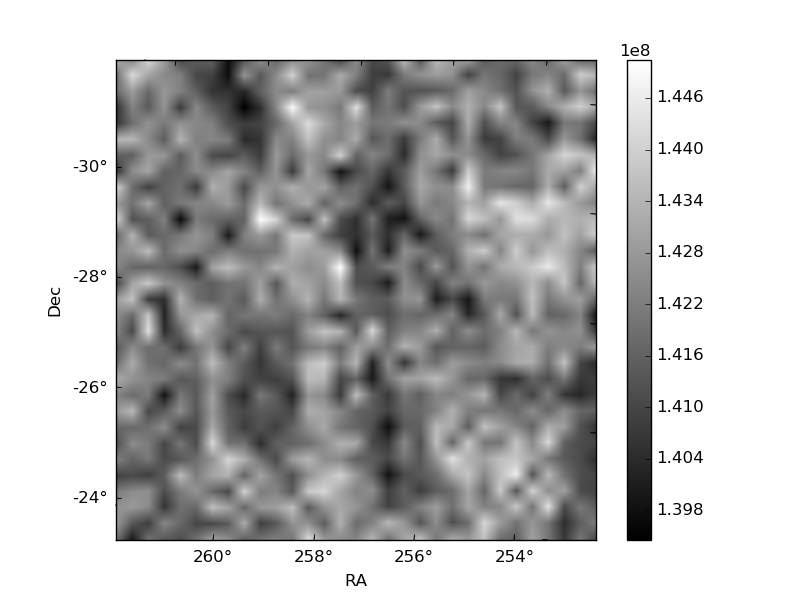
Histogram calculated using DETX and DETY for each event in the final _common_clean file
| Quadrant A | 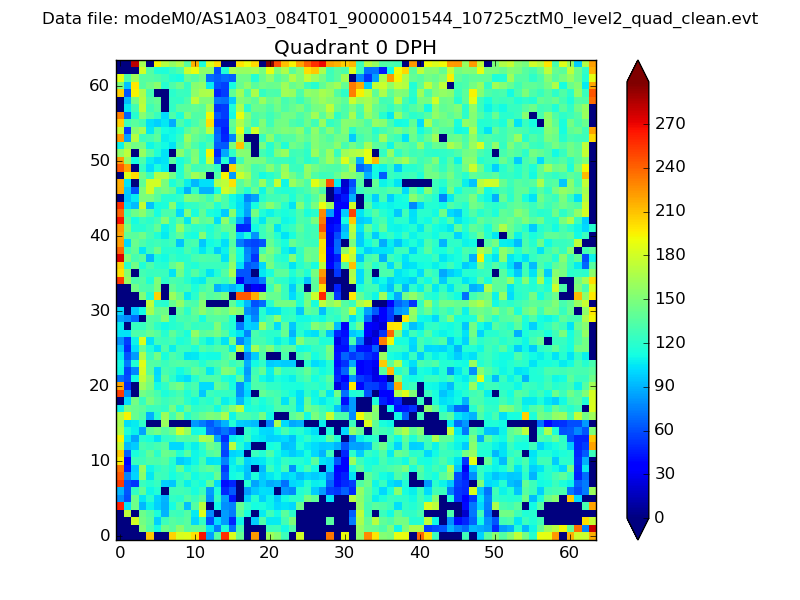 |
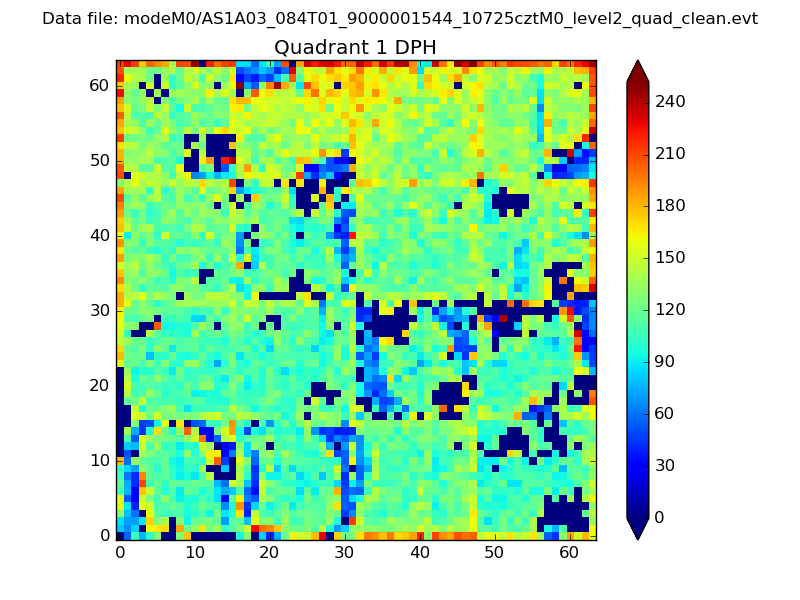 |
Quadrant B |
|---|---|---|---|
| Quadrant D | 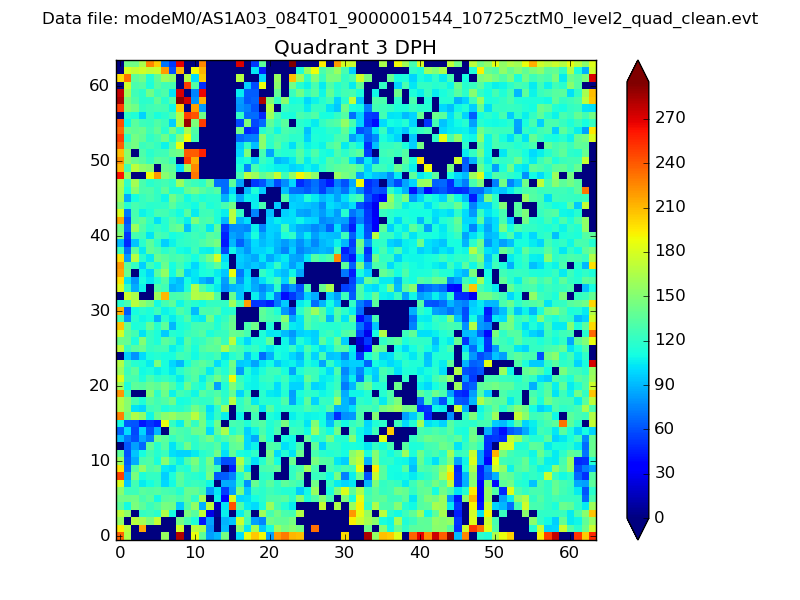 |
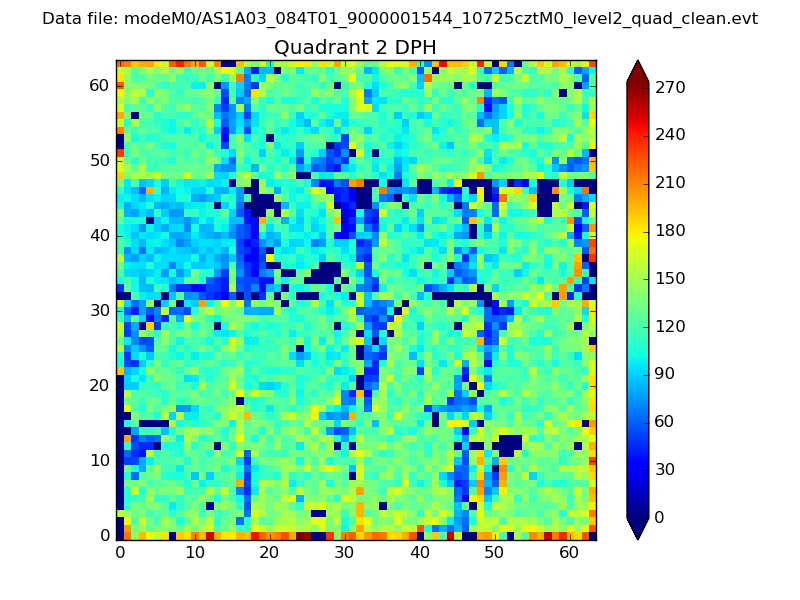 |
Quadrant C |
| Plot type | Count rate plots | Images |
|---|---|---|
| Comparison with Poisson distribution Blue bars denote a histogram of data divided into 1 sec bins. Red curve is a Poisson curve with rate = median count rate of data. |
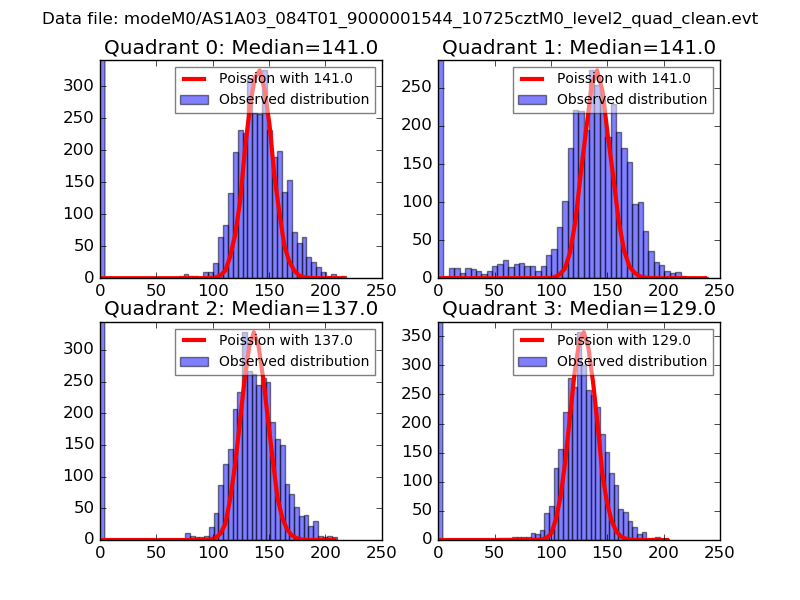 |
 |
| Quadrant-wise count rates Data is divided into 100 sec bins |
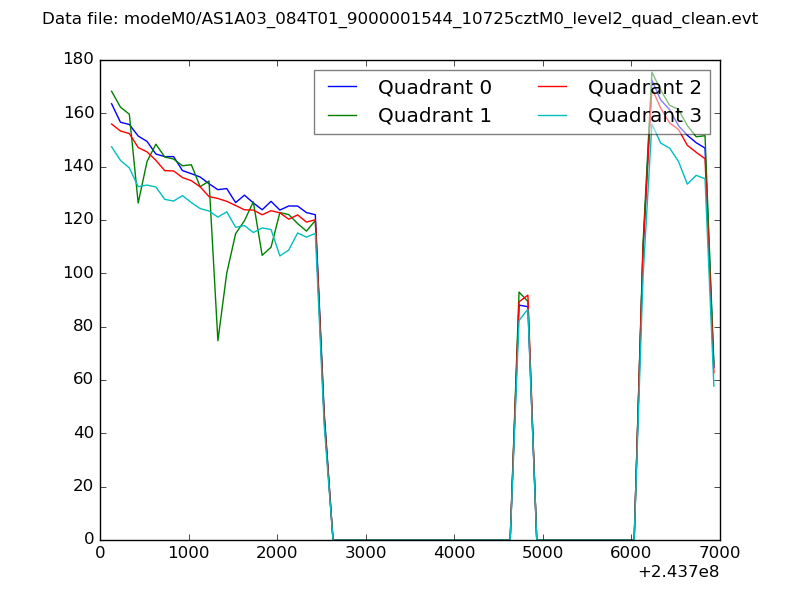 |
|
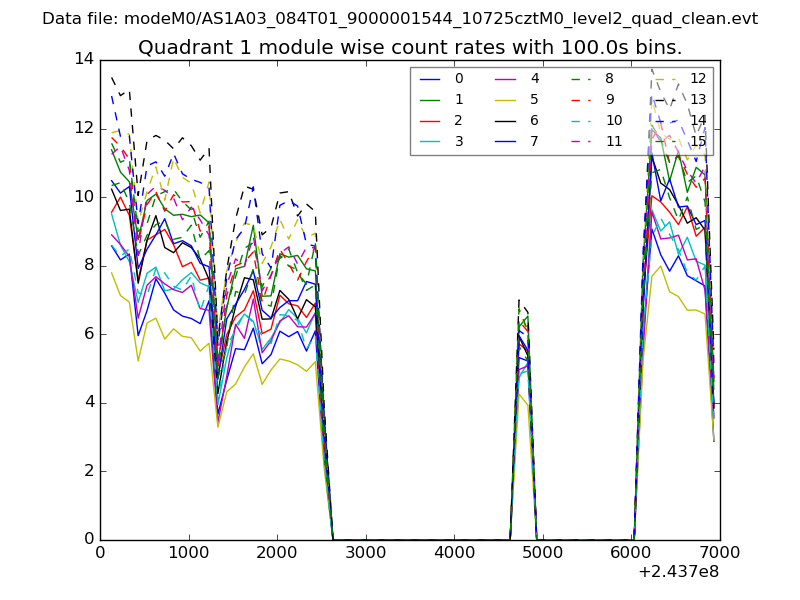
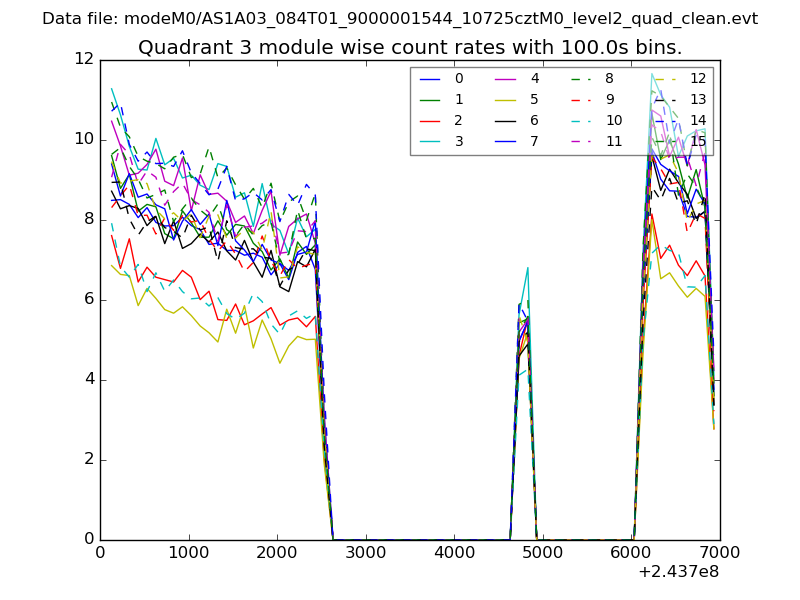
| Module-wise count rates for Quadrant A Data is divided into 100 sec bins |
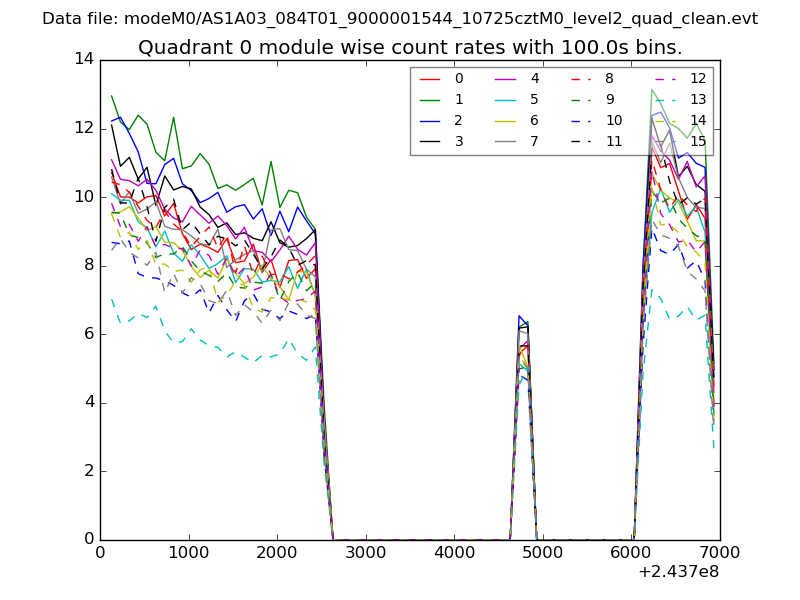 |
 |
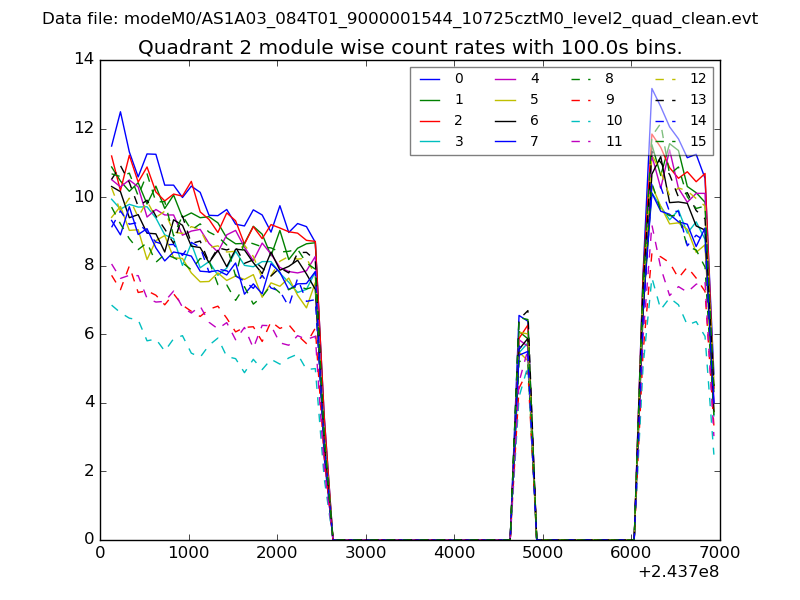
| Module-wise count rates for Quadrant B Data is divided into 100 sec bins |
 |
 |
| Module-wise count rates for Quadrant C Data is divided into 100 sec bins |
 |
 |
| Module-wise count rates for Quadrant D Data is divided into 100 sec bins |
 |
 |
| Parameter | Plot |
|---|---|
| CZT HV Monitor | 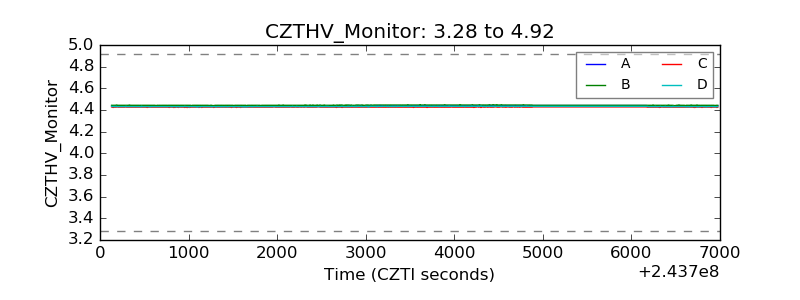 |
| D_VDD | 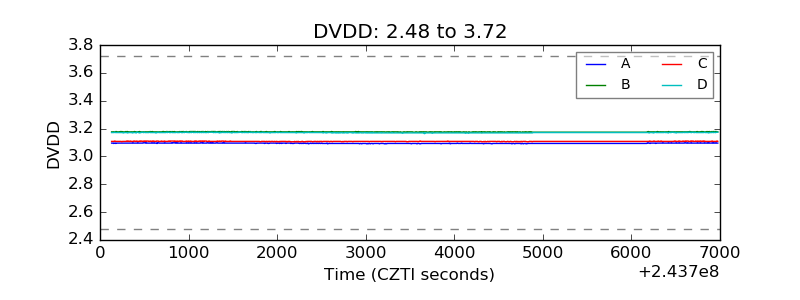 |
| Temperature 1 | 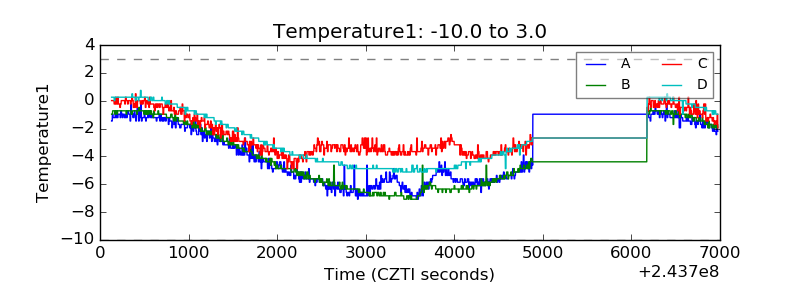 |
| Veto HV Monitor | 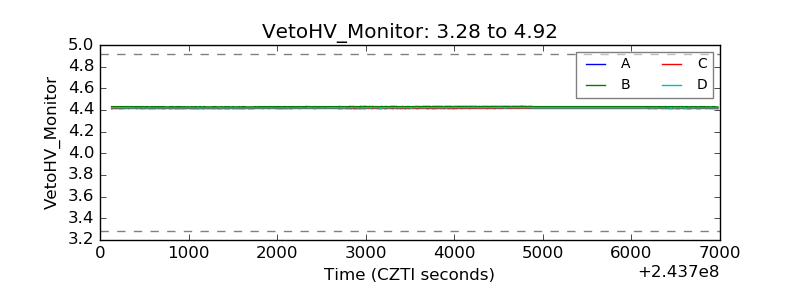 |
| Veto LLD | 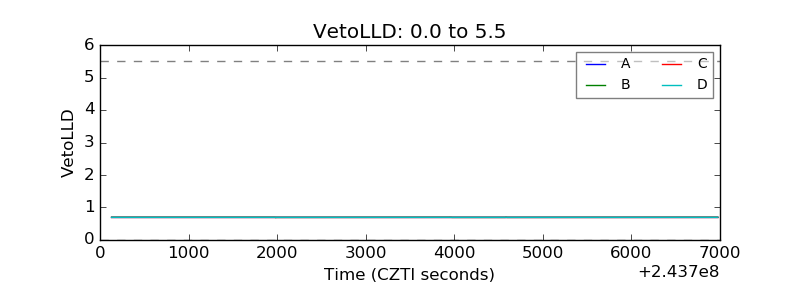 |
| Alpha Counter | 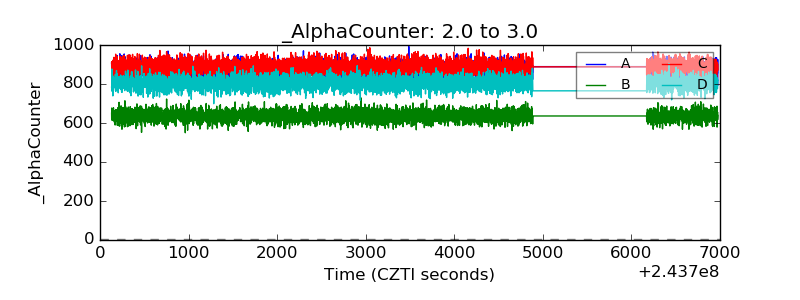 |
| _CPM_Rate | 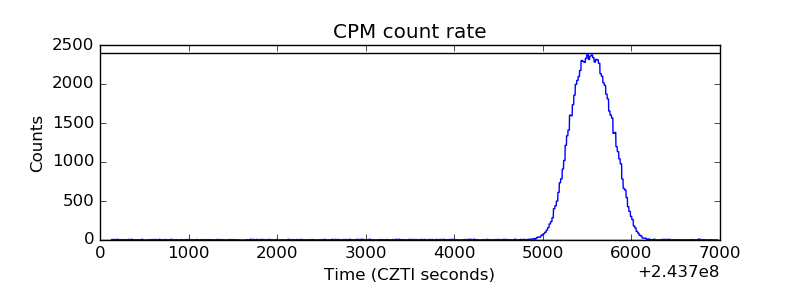 |
| CZT Counter | 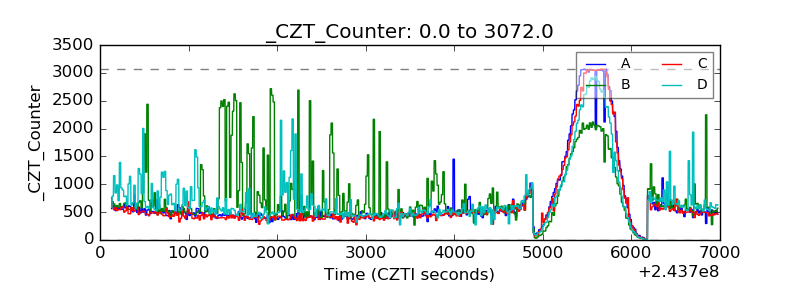 |
| +2.5 Volts monitor |  |
| +5 Volts monitor | 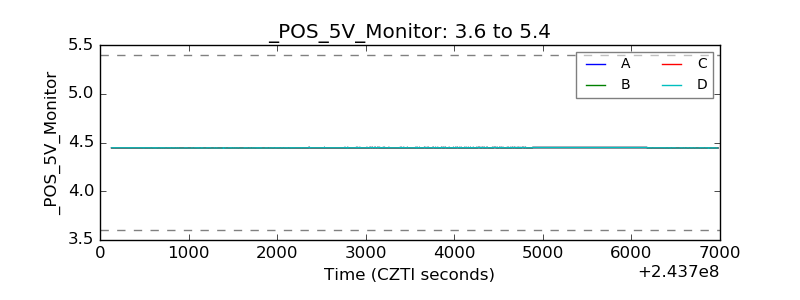 |
| _ROLL_ROT | 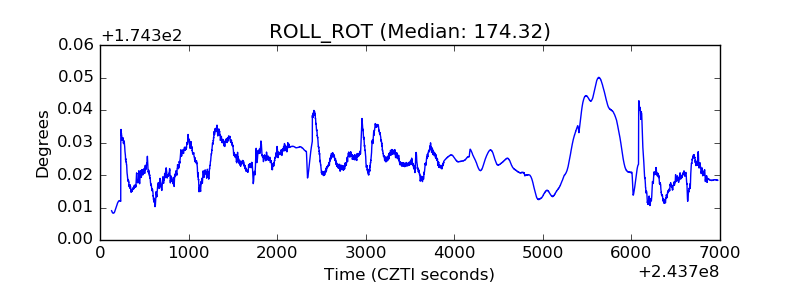 |
| _Roll_DEC | 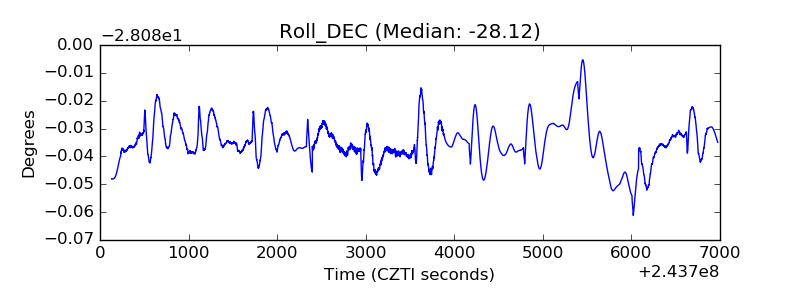 |
| _Roll_RA | 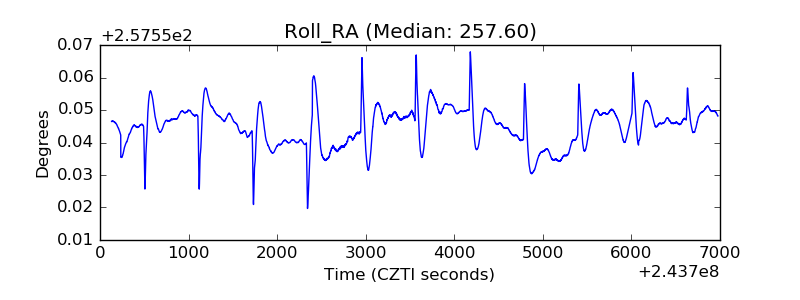 |
| Veto Counter | 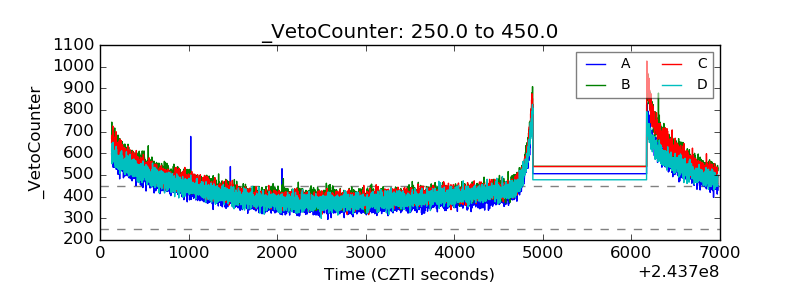 |