| Param | Original file | Final file |
|---|---|---|
| Filename | modeM0/AS1A03_064T01_9000001548cztM0_level2.fits | modeM0/AS1A03_064T01_9000001548cztM0_level2_quad_clean.evt |
| Size (bytes) | 245,007,360 | 222,215,040 |
| Size | 233.7 MB | 211.9 MB |
| Events in quadrant A | 1,521,290 | 1,336,849 |
| Events in quadrant B | 1,445,026 | 1,320,555 |
| Events in quadrant C | 1,531,168 | 1,302,821 |
| Events in quadrant D | 1,232,862 | 1,080,697 |
| Mode M0 | |||
|---|---|---|---|
| Quadrant | BADHDUFLAG | Total packets | Discarded packets |
| A | 0 | 54325 | 0 |
| B | 0 | 67275 | 0 |
| C | 0 | 51328 | 0 |
| D | 0 | 92442 | 0 |
| Mode M9 | |||
|---|---|---|---|
| Quadrant | BADHDUFLAG | Total packets | Discarded packets |
| A | 0 | 57 | 0 |
| B | 0 | 57 | 0 |
| C | 0 | 57 | 0 |
| D | 0 | 57 | 0 |
| Mode SS | |||
|---|---|---|---|
| Quadrant | BADHDUFLAG | Total packets | Discarded packets |
| A | 0 | 502 | 0 |
| B | 0 | 502 | 0 |
| C | 0 | 502 | 0 |
| D | 0 | 502 | 0 |
| Quadrant | Total seconds | Saturated seconds | Saturation percentage |
|---|---|---|---|
| A | 24524 | 501 | 2.042897% |
| B | 24525 | 1198 | 4.884811% |
| C | 24525 | 274 | 1.117227% |
| D | 24525 | 3792 | 15.461774% |
Noise dominated data is calculated using 1-second bins in cleaned event files. If a bin has >2000 counts, and if more than 50% of those come from <1% of pixels, then it is considered to be noise-dominated and hence unusable.
| Quadrant | # 1 sec bins | Bins with >0 counts | Bins with >2000 counts | High rate bins dominated by noise | Noise dominated (total time) | Noise dominated (detector-on time) | Marked lightcurve |
|---|---|---|---|---|---|---|---|
| A | 30350 | 24519 | 0 | 0 | 0.00% | 0.00% | 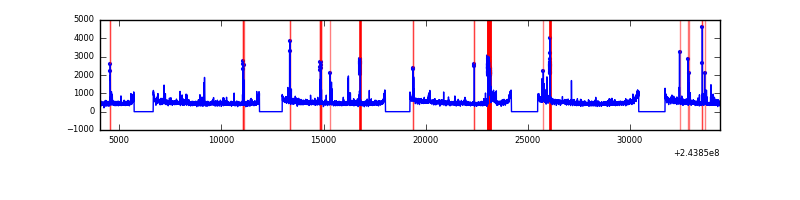 |
| B | 30350 | 24521 | 0 | 0 | 0.00% | 0.00% |  |
| C | 30350 | 24521 | 0 | 0 | 0.00% | 0.00% | 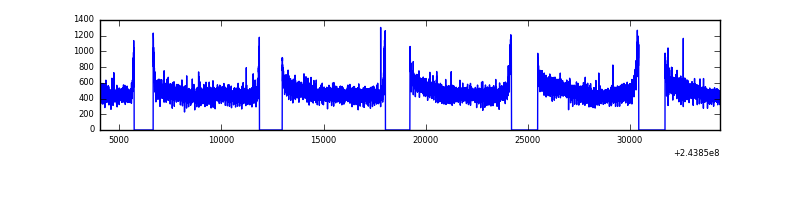 |
| D | 30350 | 24519 | 0 | 0 | 0.00% | 0.00% | 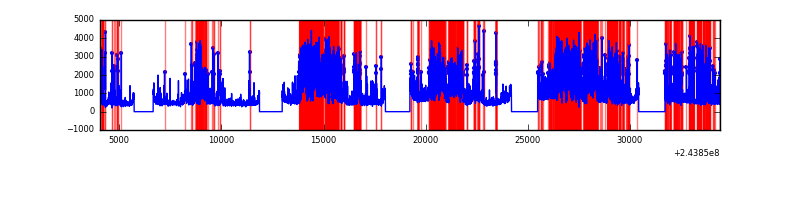 |
Top three noisy pixels from each quadrant. If the there are fewer than three noisy pixels in the level2.evt file, extra rows are filled as -1
| Pixel properties | Quadrant properties | ||||||
|---|---|---|---|---|---|---|---|
| Quadrant | DetID | PixID | Counts | Sigma | Mean | Median | Sigma |
| A | 0 | 29 | 1496 | 11.36 | 396 | 372 | 99.0 |
| A | 7 | 110 | 1199 | 8.36 | 396 | 372 | 99.0 |
| A | 0 | 30 | 1146 | 7.82 | 396 | 372 | 99.0 |
| B | 2 | 9 | 1297 | 12.06 | 381 | 364 | 77.4 |
| B | 5 | 128 | 979 | 7.95 | 381 | 364 | 77.4 |
| B | 3 | 17 | 977 | 7.92 | 381 | 364 | 77.4 |
| C | 1 | 81 | 1146 | 7.25 | 404 | 378 | 105.9 |
| C | 1 | 80 | 1143 | 7.22 | 404 | 378 | 105.9 |
| C | 2 | 191 | 1056 | 6.4 | 404 | 378 | 105.9 |
| D | 10 | 189 | 886 | 5.97 | 351 | 320 | 94.8 |
| D | 7 | 5 | 862 | 5.72 | 351 | 320 | 94.8 |
| D | 6 | 231 | 851 | 5.6 | 351 | 320 | 94.8 |
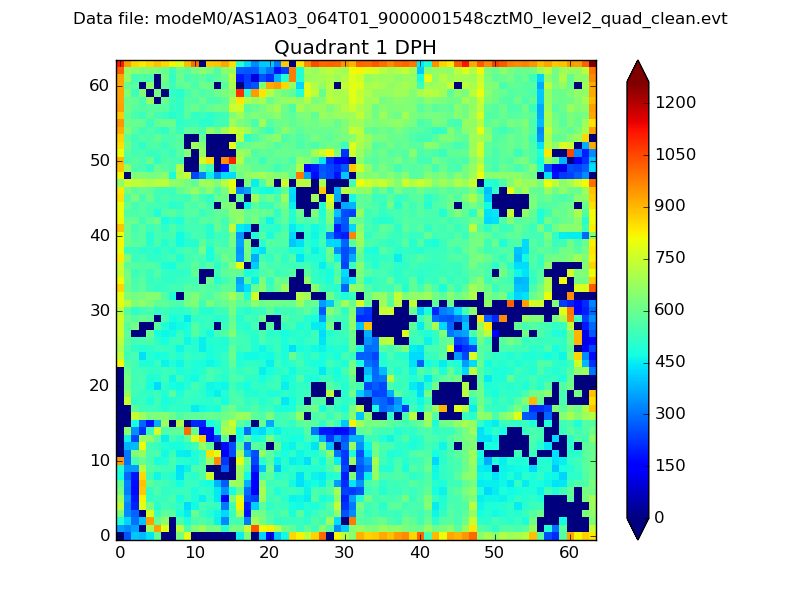
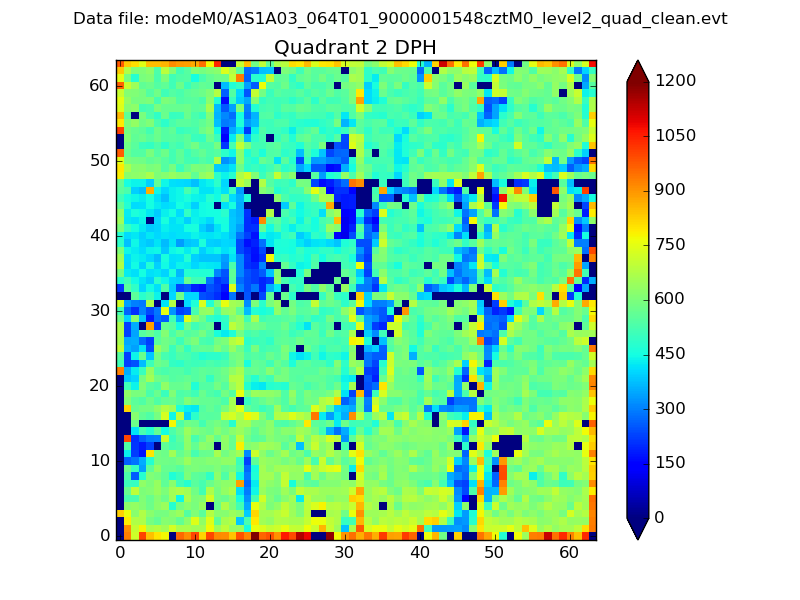
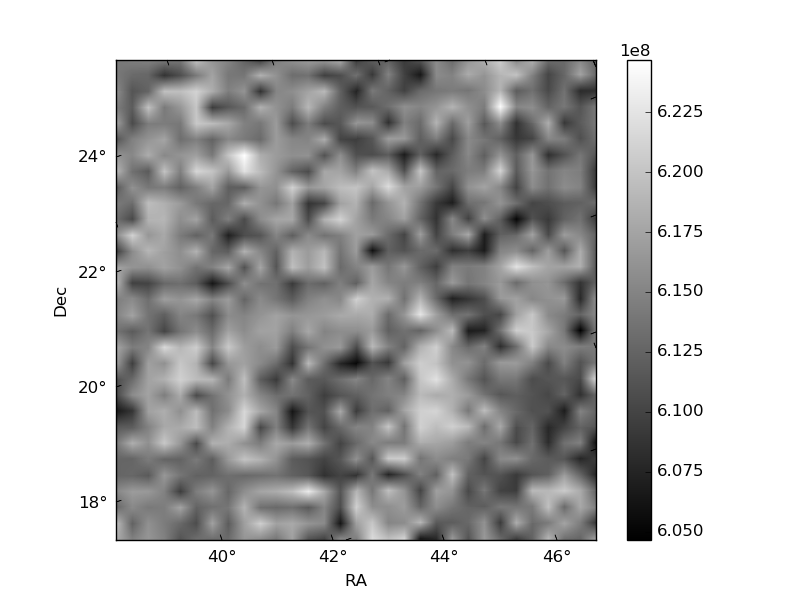
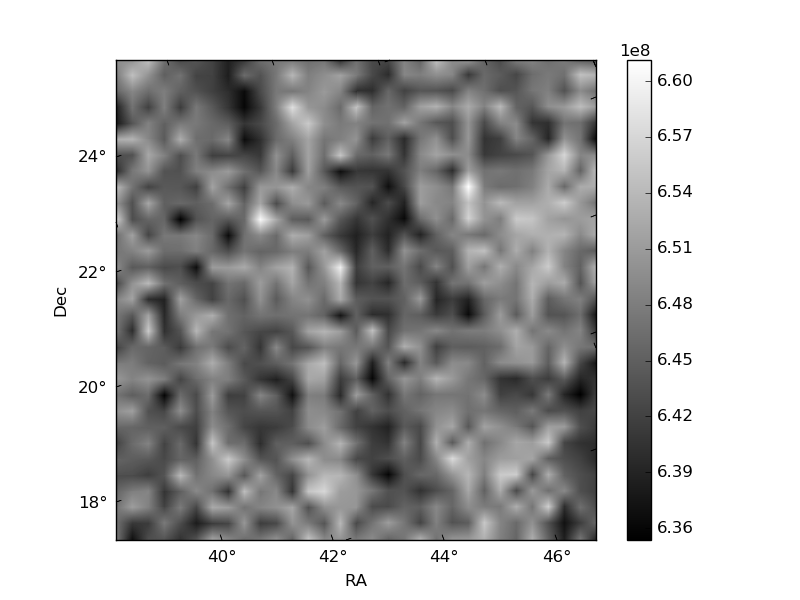
Histogram calculated using DETX and DETY for each event in the final _common_clean file
| Quadrant A | 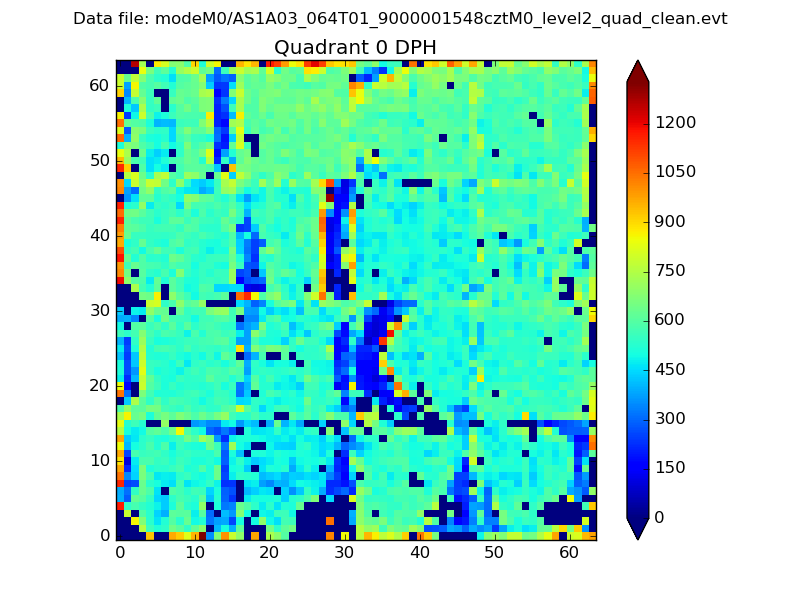 |
 |
Quadrant B |
|---|---|---|---|
| Quadrant D | 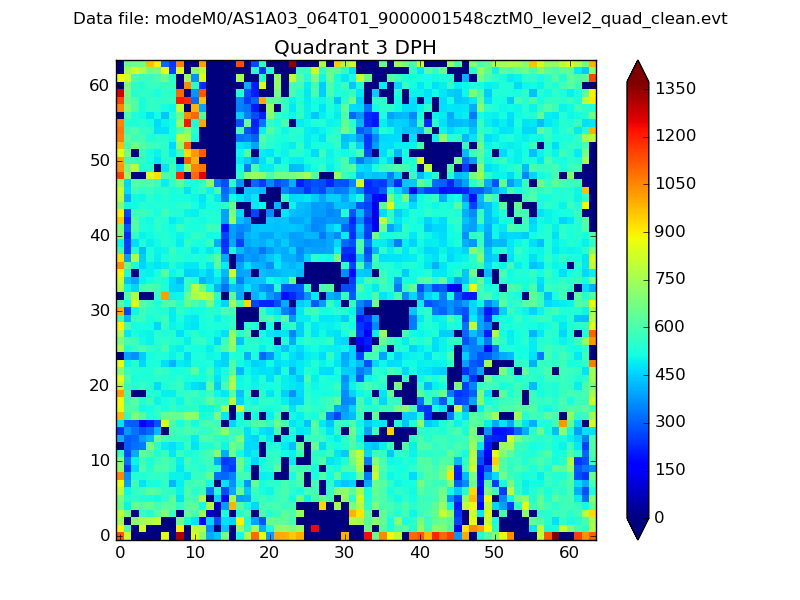 |
 |
Quadrant C |
| Plot type | Count rate plots | Images |
|---|---|---|
| Comparison with Poisson distribution Blue bars denote a histogram of data divided into 1 sec bins. Red curve is a Poisson curve with rate = median count rate of data. |
 |
 |
| Quadrant-wise count rates Data is divided into 100 sec bins |
 |
|
| Module-wise count rates for Quadrant A Data is divided into 100 sec bins |
 |
 |
| Module-wise count rates for Quadrant B Data is divided into 100 sec bins |
 |
 |
| Module-wise count rates for Quadrant C Data is divided into 100 sec bins |
 |
 |
| Module-wise count rates for Quadrant D Data is divided into 100 sec bins |
 |
 |
| Parameter | Plot |
|---|---|
| CZT HV Monitor | 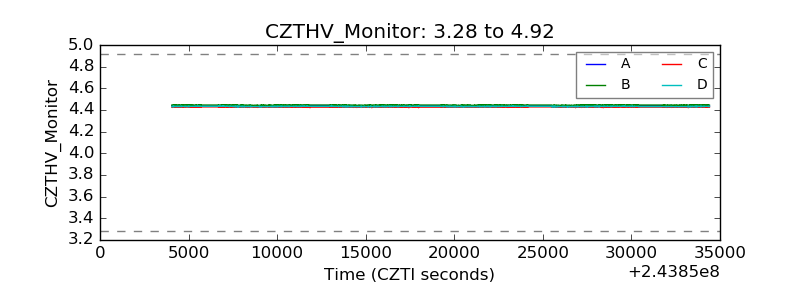 |
| D_VDD | 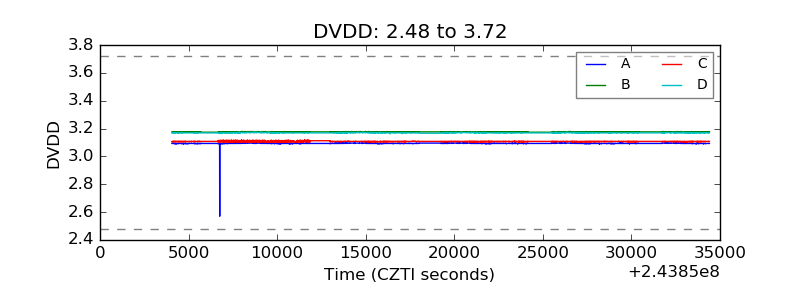 |
| Temperature 1 |  |
| Veto HV Monitor | 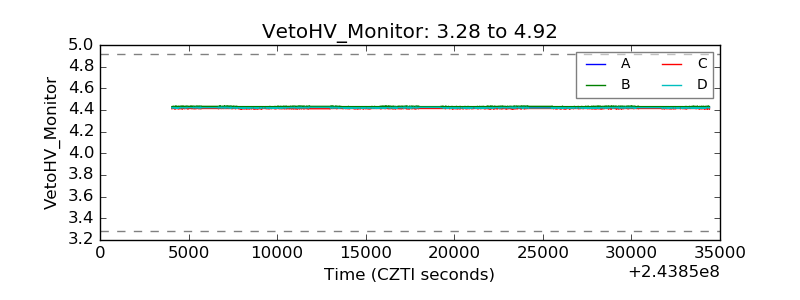 |
| Veto LLD | 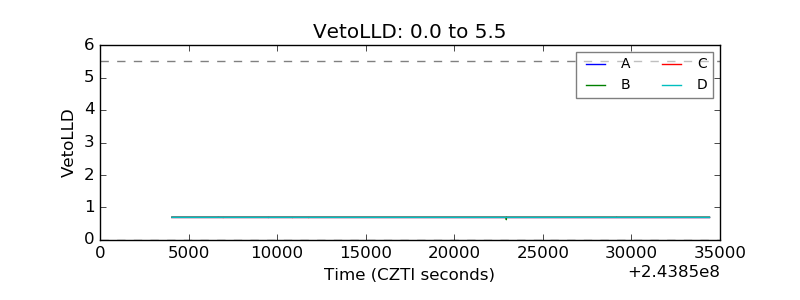 |
| Alpha Counter | 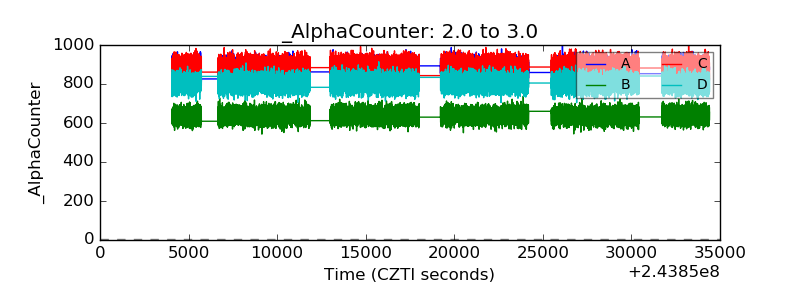 |
| _CPM_Rate | 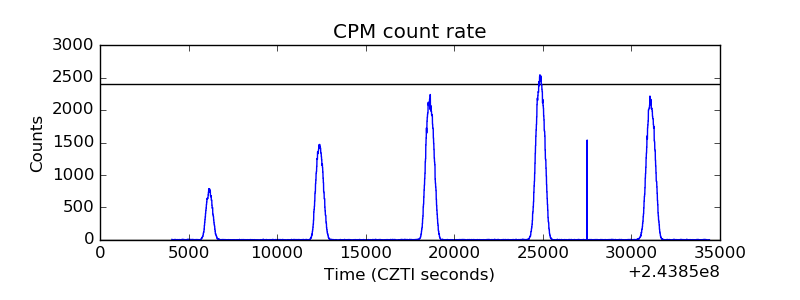 |
| CZT Counter | 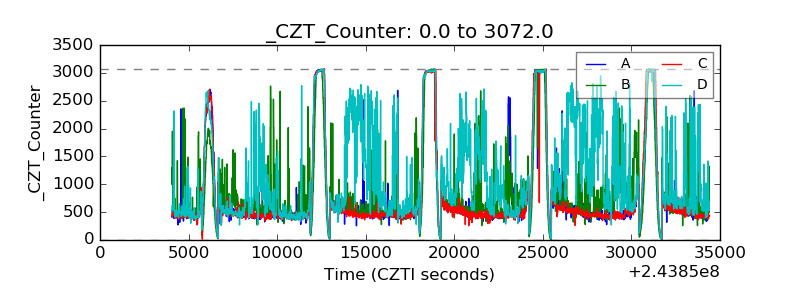 |
| +2.5 Volts monitor | 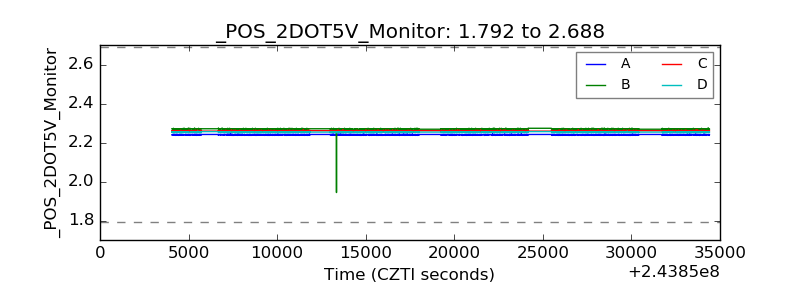 |
| +5 Volts monitor | 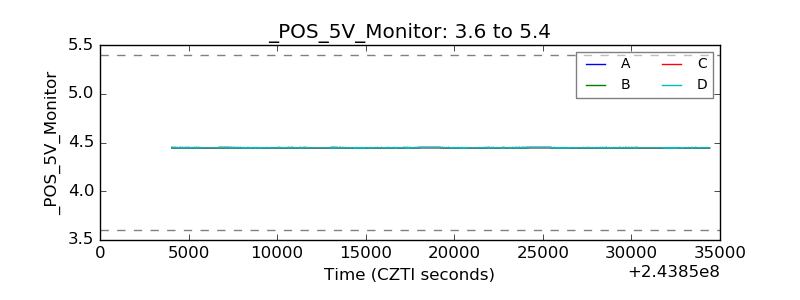 |
| _ROLL_ROT | 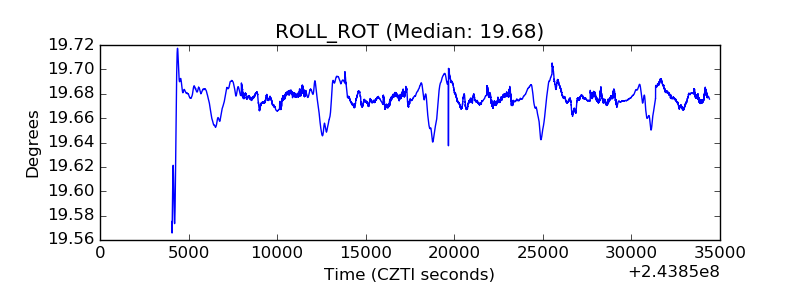 |
| _Roll_DEC | 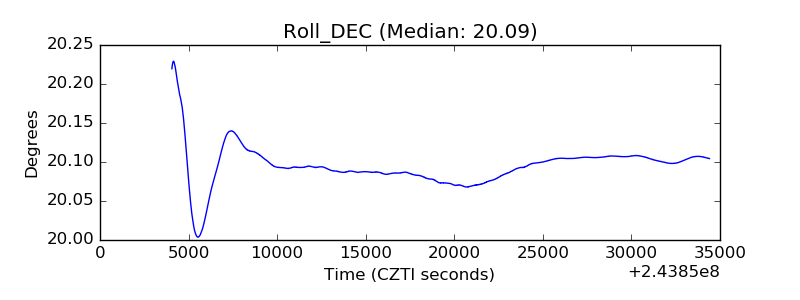 |
| _Roll_RA |  |
| Veto Counter | 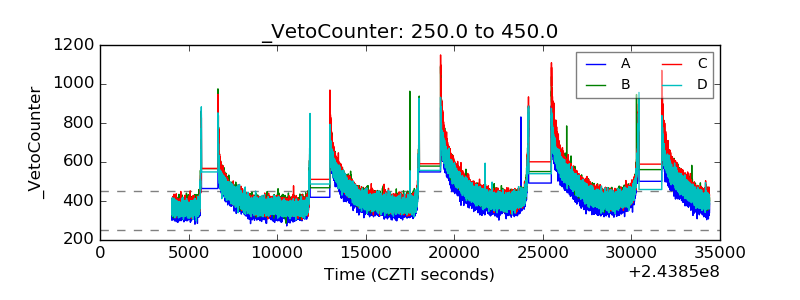 |