| Param | Original file | Final file |
|---|---|---|
| Filename | modeM0/AS1A03_064T01_9000001548_10749cztM0_level2.evt | modeM0/AS1A03_064T01_9000001548_10749cztM0_level2_quad_clean.evt |
| Size (bytes) | 238,556,160 | 39,237,120 |
| Size | 227.5 MB | 37.4 MB |
| Events in quadrant A | 1,587,091 | 243,694 |
| Events in quadrant B | 2,171,527 | 242,861 |
| Events in quadrant C | 1,496,815 | 245,064 |
| Events in quadrant D | 1,754,673 | 233,308 |
| Mode M0 | |||
|---|---|---|---|
| Quadrant | BADHDUFLAG | Total packets | Discarded packets |
| A | 0 | 6699 | 4 |
| B | 0 | 8560 | 1 |
| C | 0 | 6451 | 1 |
| D | 0 | 7226 | 1 |
| Mode M9 | |||
|---|---|---|---|
| Quadrant | BADHDUFLAG | Total packets | Discarded packets |
| A | 0 | 9 | 0 |
| B | 0 | 9 | 0 |
| C | 0 | 9 | 0 |
| D | 0 | 9 | 0 |
| Mode SS | |||
|---|---|---|---|
| Quadrant | BADHDUFLAG | Total packets | Discarded packets |
| A | 0 | 66 | 0 |
| B | 0 | 66 | 0 |
| C | 0 | 66 | 0 |
| D | 0 | 66 | 0 |
| Quadrant | Total seconds | Saturated seconds | Saturation percentage |
|---|---|---|---|
| A | 3125 | 70 | 2.240000% |
| B | 3126 | 187 | 5.982086% |
| C | 3126 | 48 | 1.535509% |
| D | 3126 | 76 | 2.431222% |
Noise dominated data is calculated using 1-second bins in cleaned event files. If a bin has >2000 counts, and if more than 50% of those come from <1% of pixels, then it is considered to be noise-dominated and hence unusable.
| Quadrant | # 1 sec bins | Bins with >0 counts | Bins with >2000 counts | High rate bins dominated by noise | Noise dominated (total time) | Noise dominated (detector-on time) | Marked lightcurve |
|---|---|---|---|---|---|---|---|
| A | 4061 | 3126 | 2 | 2 | 0.05% | 0.06% | 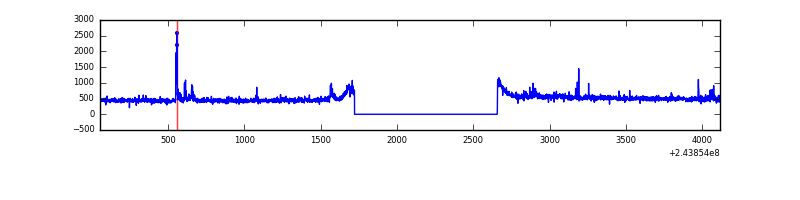 |
| B | 4061 | 3126 | 64 | 64 | 1.58% | 2.05% | 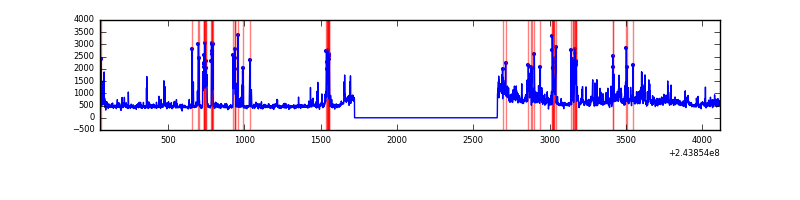 |
| C | 4061 | 3127 | 0 | 0 | 0.00% | 0.00% | 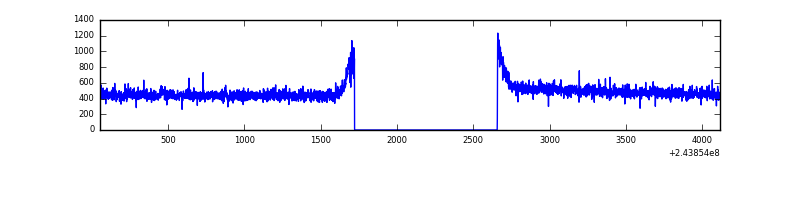 |
| D | 4061 | 3127 | 27 | 27 | 0.66% | 0.86% | 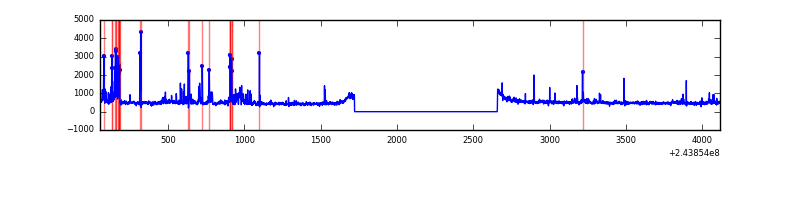 |
Top three noisy pixels from each quadrant. If the there are fewer than three noisy pixels in the level2.evt file, extra rows are filled as -1
| Pixel properties | Quadrant properties | ||||||
|---|---|---|---|---|---|---|---|
| Quadrant | DetID | PixID | Counts | Sigma | Mean | Median | Sigma |
| A | 15 | 223 | 30314 | 368.67 | 392 | 384 | 81.2 |
| A | 13 | 251 | 11048 | 131.36 | 392 | 384 | 81.2 |
| A | 8 | 15 | 10414 | 123.55 | 392 | 384 | 81.2 |
| B | 4 | 239 | 346419 | 4537.39 | 388 | 379 | 76.3 |
| B | 0 | 85 | 151880 | 1986.53 | 388 | 379 | 76.3 |
| B | 0 | 214 | 75990 | 991.44 | 388 | 379 | 76.3 |
| C | 8 | 128 | 4370 | 44.19 | 381 | 384 | 90.2 |
| C | 13 | 61 | 2884 | 27.71 | 381 | 384 | 90.2 |
| C | 8 | 112 | 2357 | 21.87 | 381 | 384 | 90.2 |
| D | 10 | 172 | 60769 | 650.17 | 379 | 368 | 92.9 |
| D | 12 | 233 | 57844 | 618.69 | 379 | 368 | 92.9 |
| D | 10 | 157 | 55155 | 589.74 | 379 | 368 | 92.9 |
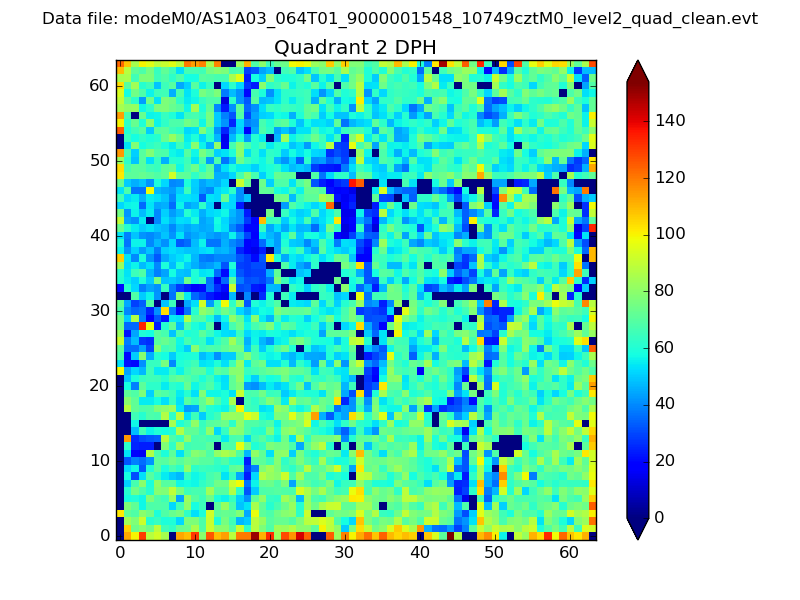
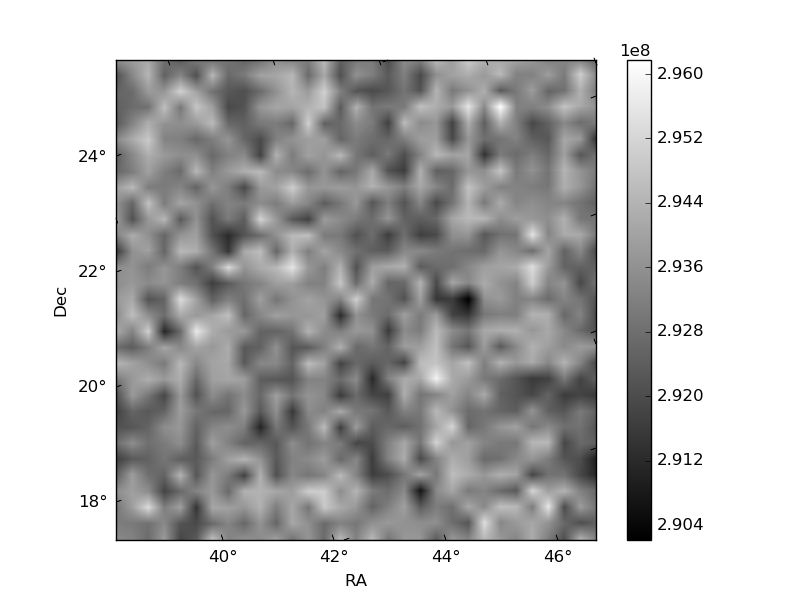
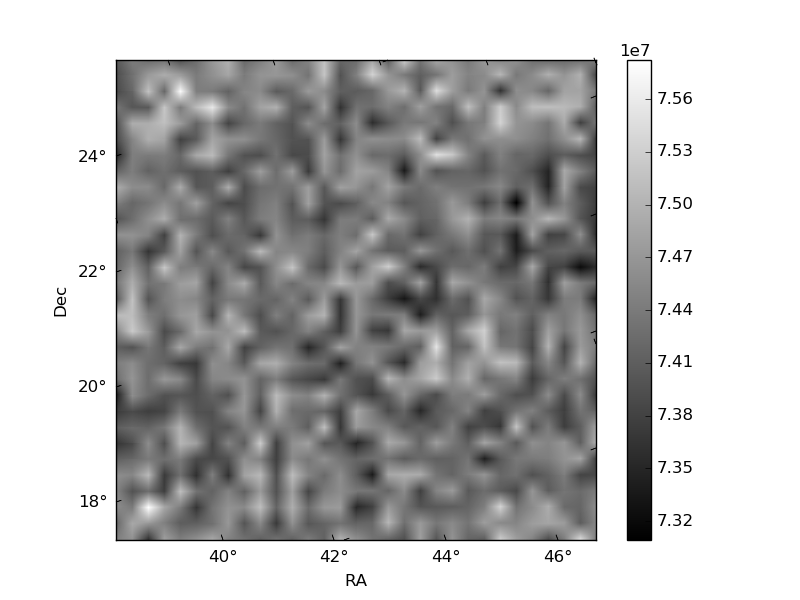
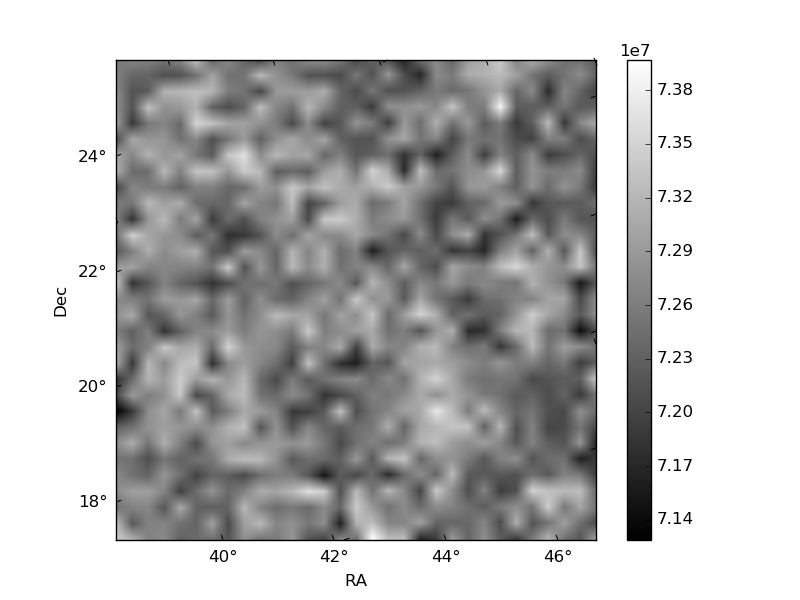
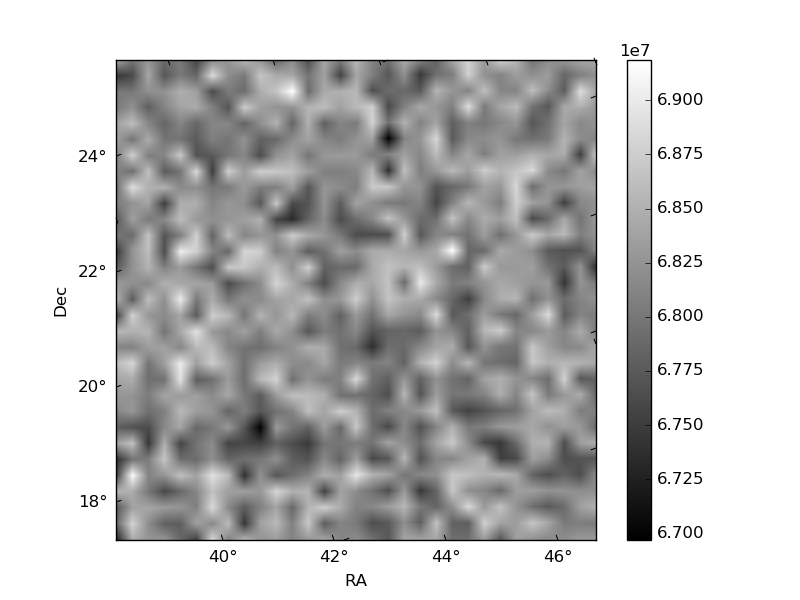
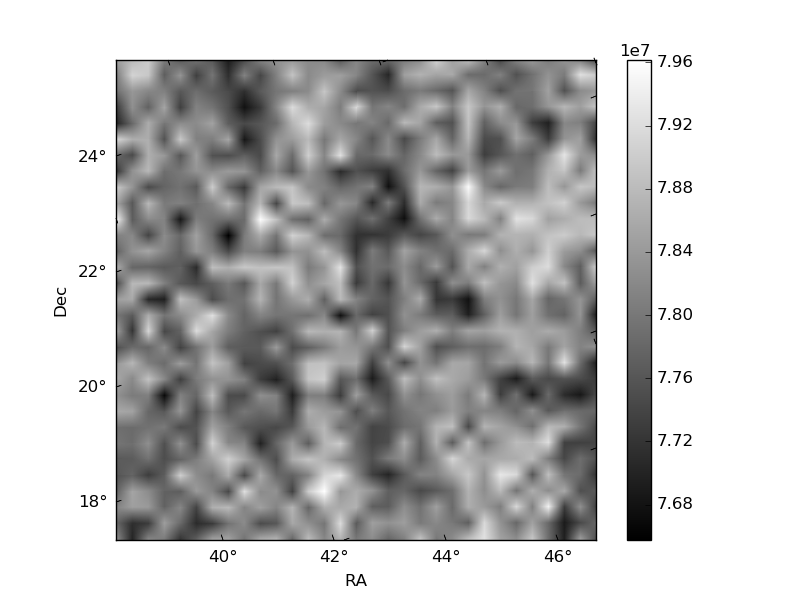
Histogram calculated using DETX and DETY for each event in the final _common_clean file
| Quadrant A | 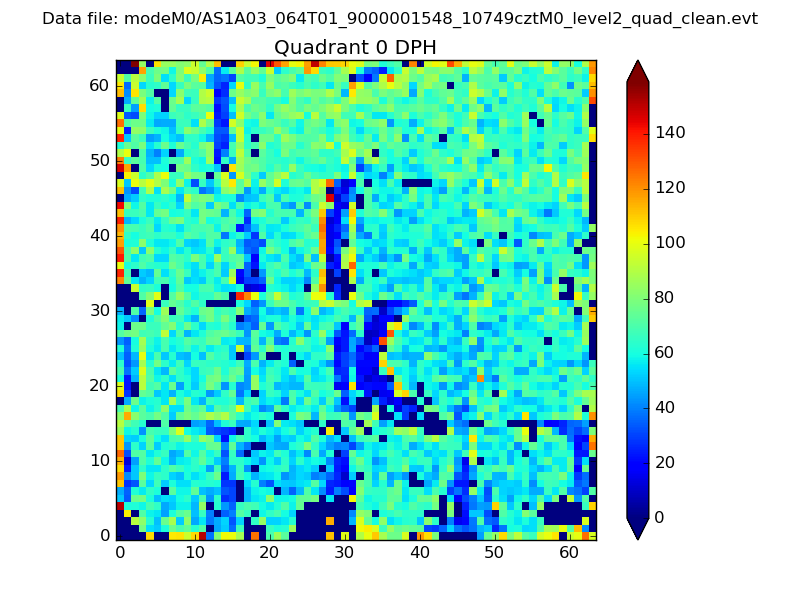 |
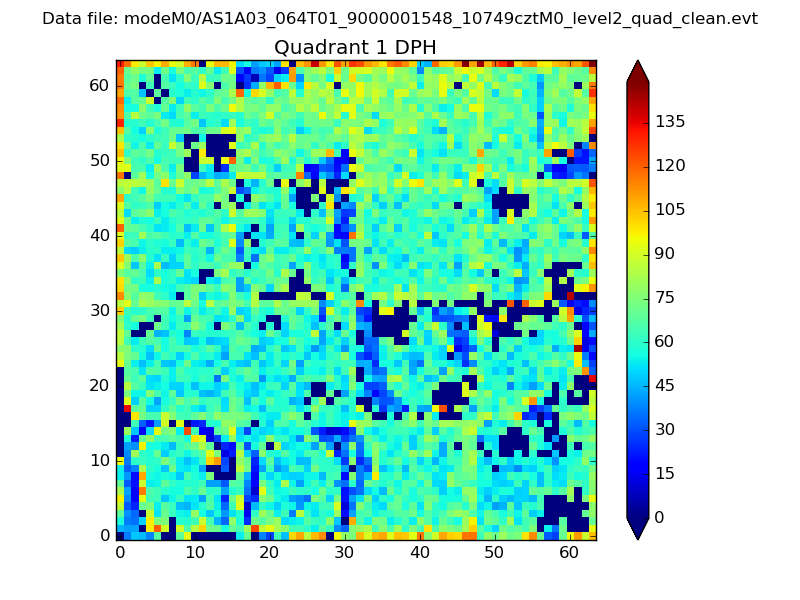 |
Quadrant B |
|---|---|---|---|
| Quadrant D | 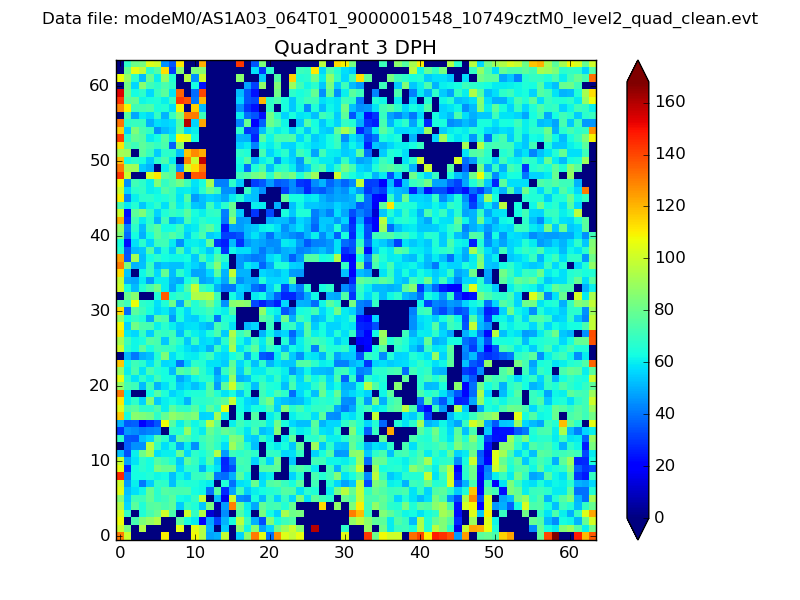 |
 |
Quadrant C |
| Plot type | Count rate plots | Images |
|---|---|---|
| Comparison with Poisson distribution Blue bars denote a histogram of data divided into 1 sec bins. Red curve is a Poisson curve with rate = median count rate of data. |
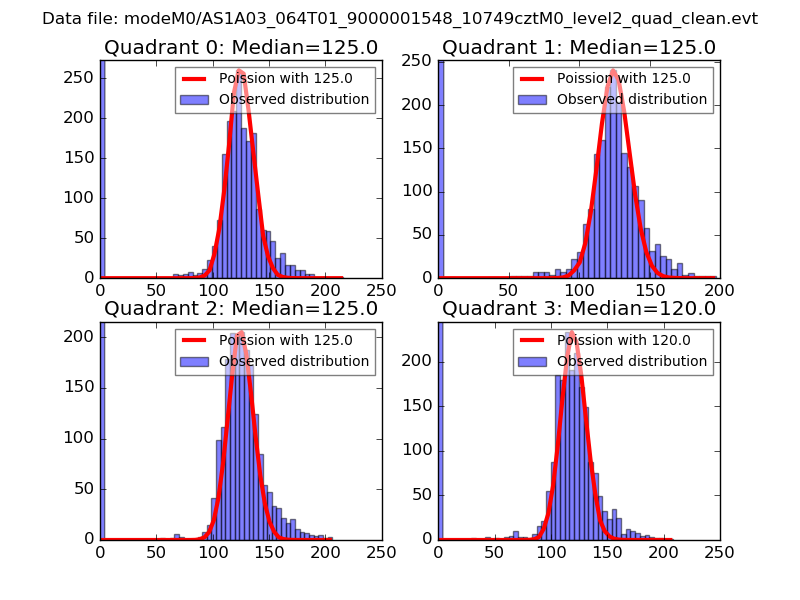 |
 |
| Quadrant-wise count rates Data is divided into 100 sec bins |
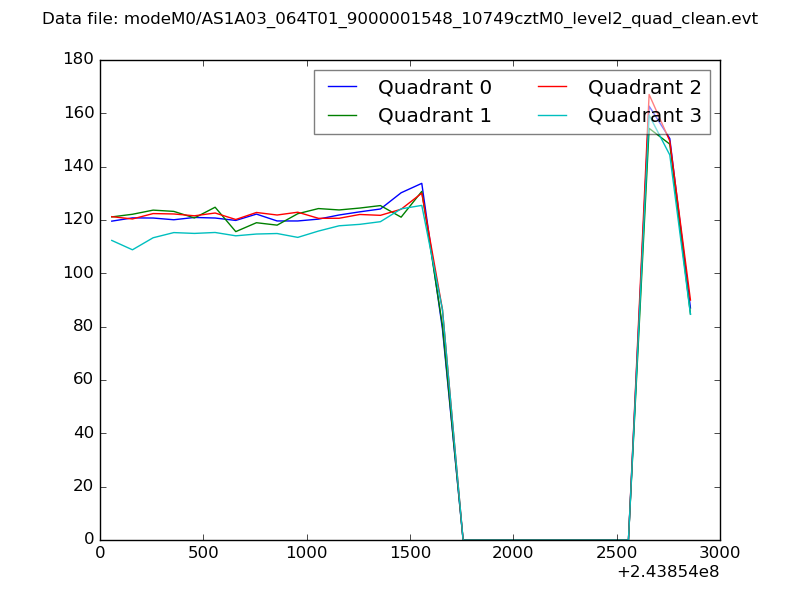 |
|
| Module-wise count rates for Quadrant A Data is divided into 100 sec bins |
 |
 |
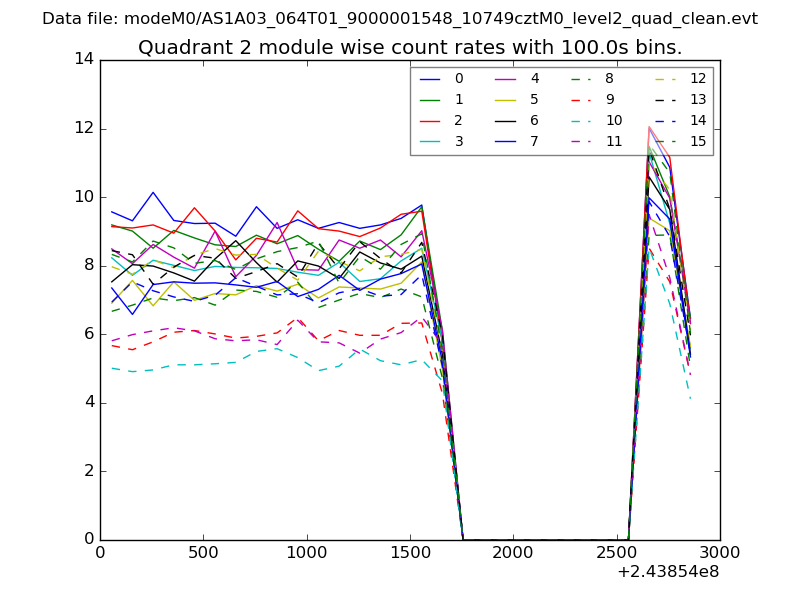
| Module-wise count rates for Quadrant B Data is divided into 100 sec bins |
 |
 |
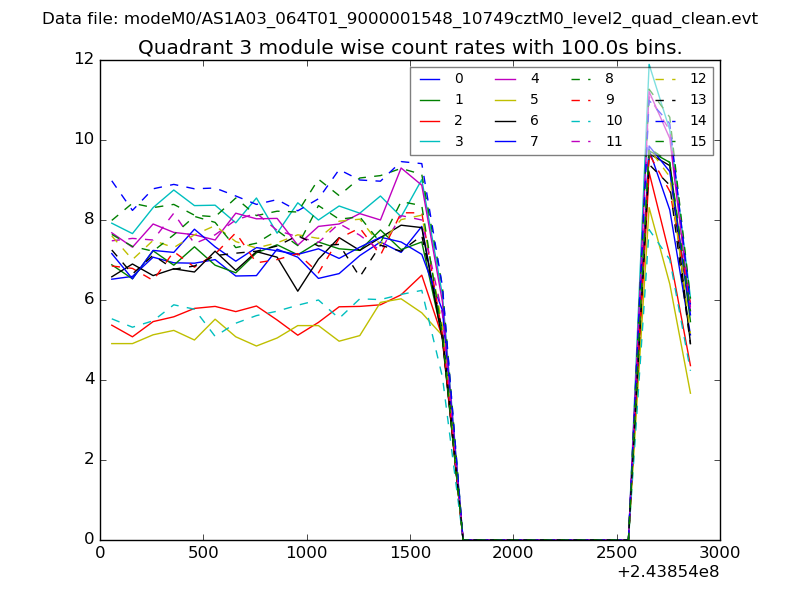
| Module-wise count rates for Quadrant C Data is divided into 100 sec bins |
 |
 |
| Module-wise count rates for Quadrant D Data is divided into 100 sec bins |
 |
 |
| Parameter | Plot |
|---|---|
| CZT HV Monitor | 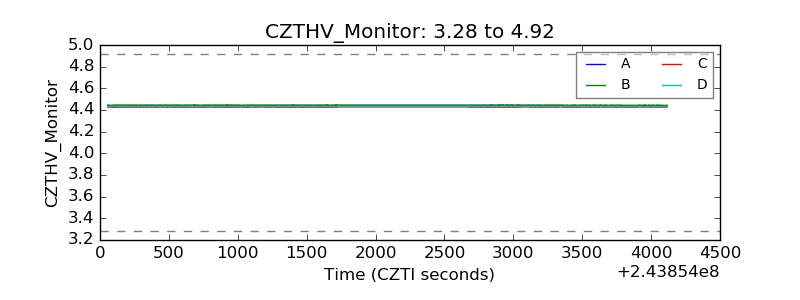 |
| D_VDD | 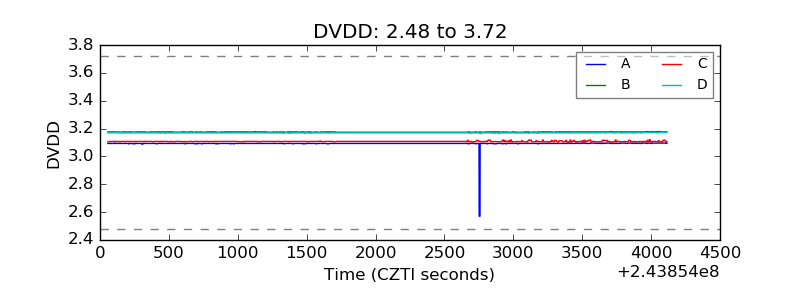 |
| Temperature 1 | 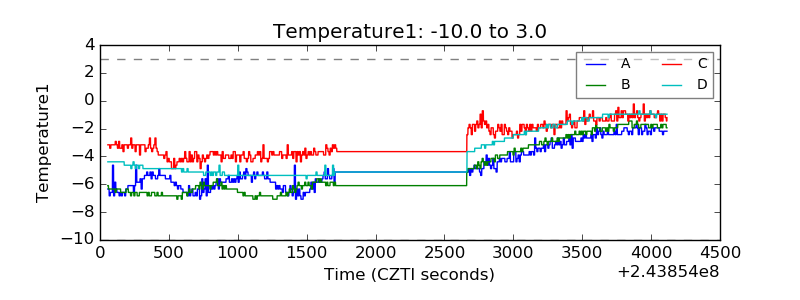 |
| Veto HV Monitor | 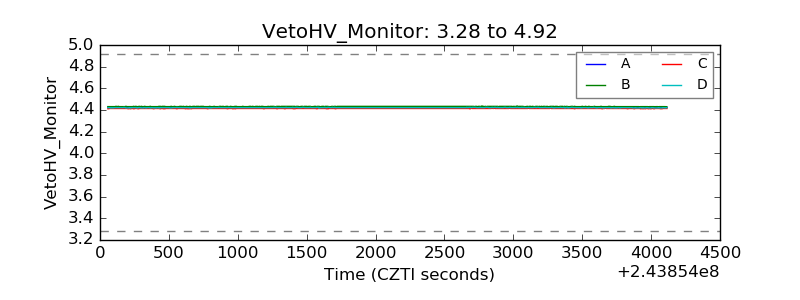 |
| Veto LLD |  |
| Alpha Counter | 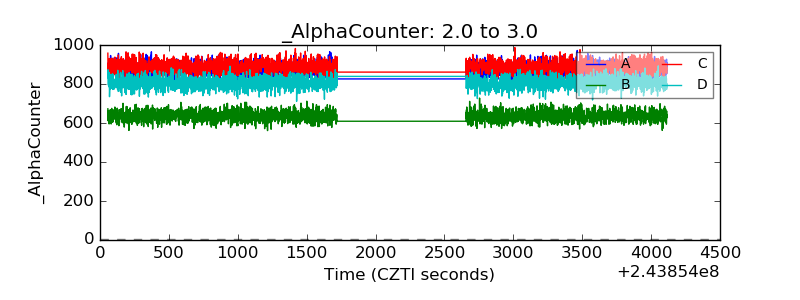 |
| _CPM_Rate | 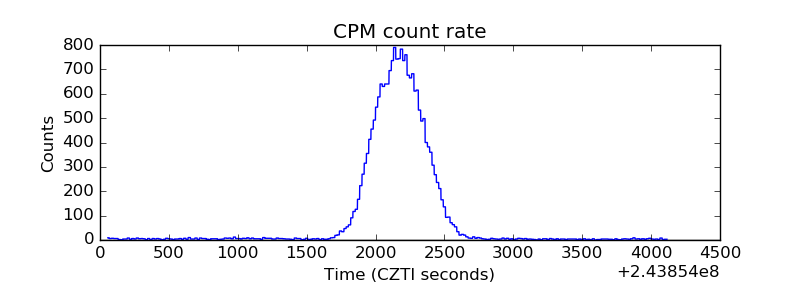 |
| CZT Counter | 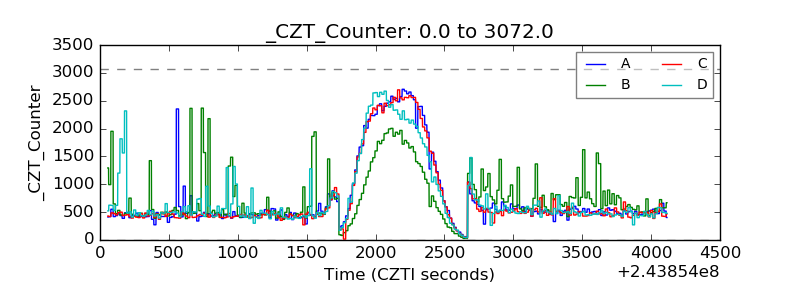 |
| +2.5 Volts monitor |  |
| +5 Volts monitor |  |
| _ROLL_ROT | 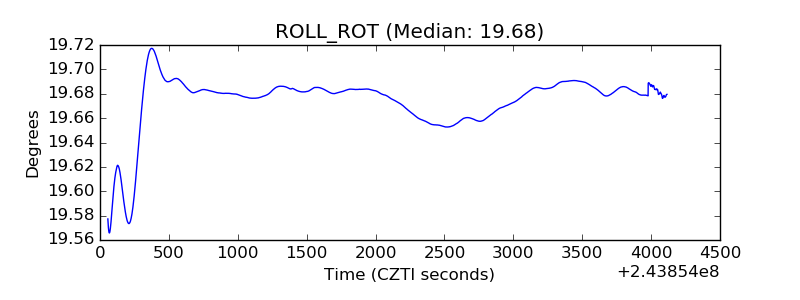 |
| _Roll_DEC | 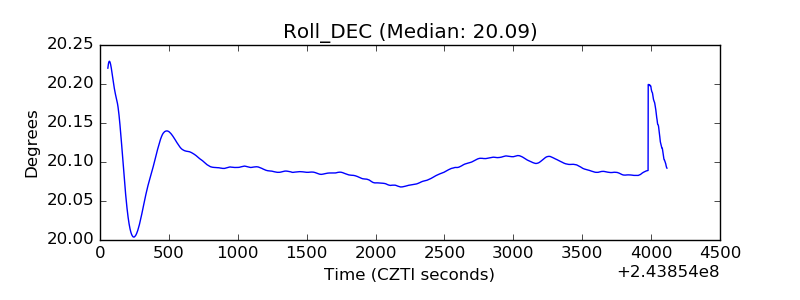 |
| _Roll_RA | 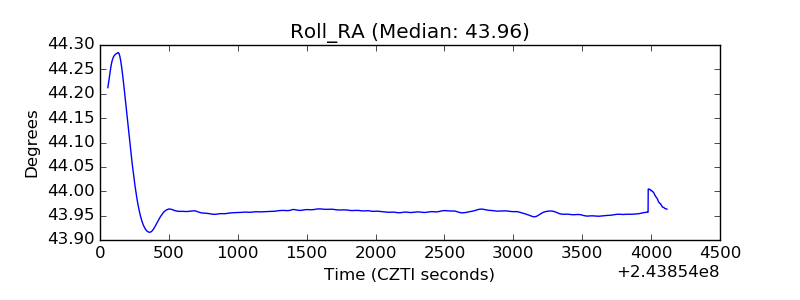 |
| Veto Counter | 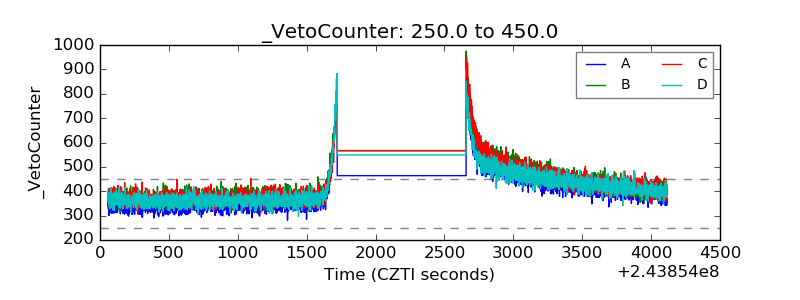 |