| Param | Original file | Final file |
|---|---|---|
| Filename | modeM0/AS1A03_064T01_9000001548_10751cztM0_level2.evt | modeM0/AS1A03_064T01_9000001548_10751cztM0_level2_quad_clean.evt |
| Size (bytes) | 545,120,640 | 63,120,960 |
| Size | 519.9 MB | 60.2 MB |
| Events in quadrant A | 3,318,969 | 369,788 |
| Events in quadrant B | 4,564,647 | 363,660 |
| Events in quadrant C | 3,122,961 | 368,090 |
| Events in quadrant D | 5,057,885 | 352,209 |
| Mode M0 | |||
|---|---|---|---|
| Quadrant | BADHDUFLAG | Total packets | Discarded packets |
| A | 0 | 14031 | 3 |
| B | 0 | 17953 | 2 |
| C | 0 | 13524 | 2 |
| D | 0 | 19482 | 2 |
| Mode M9 | |||
|---|---|---|---|
| Quadrant | BADHDUFLAG | Total packets | Discarded packets |
| A | 0 | 11 | 0 |
| B | 0 | 11 | 0 |
| C | 0 | 11 | 0 |
| D | 0 | 11 | 0 |
| Mode SS | |||
|---|---|---|---|
| Quadrant | BADHDUFLAG | Total packets | Discarded packets |
| A | 0 | 134 | 0 |
| B | 0 | 134 | 0 |
| C | 0 | 134 | 0 |
| D | 0 | 134 | 0 |
| Quadrant | Total seconds | Saturated seconds | Saturation percentage |
|---|---|---|---|
| A | 6552 | 76 | 1.159951% |
| B | 6552 | 310 | 4.731380% |
| C | 6552 | 42 | 0.641026% |
| D | 6553 | 551 | 8.408363% |
Noise dominated data is calculated using 1-second bins in cleaned event files. If a bin has >2000 counts, and if more than 50% of those come from <1% of pixels, then it is considered to be noise-dominated and hence unusable.
| Quadrant | # 1 sec bins | Bins with >0 counts | Bins with >2000 counts | High rate bins dominated by noise | Noise dominated (total time) | Noise dominated (detector-on time) | Marked lightcurve |
|---|---|---|---|---|---|---|---|
| A | 7667 | 6552 | 6 | 6 | 0.08% | 0.09% | 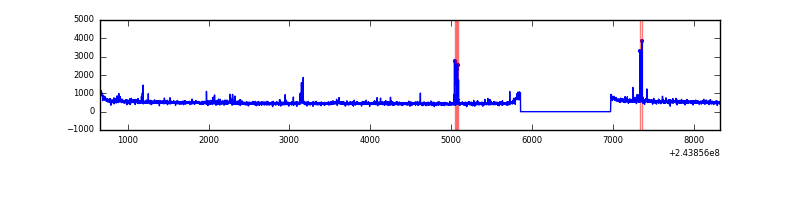 |
| B | 7667 | 6552 | 129 | 129 | 1.68% | 1.97% | 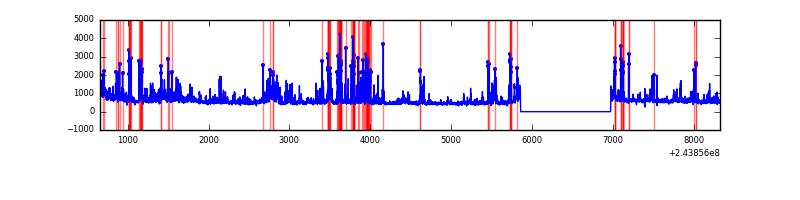 |
| C | 7667 | 6553 | 0 | 0 | 0.00% | 0.00% | 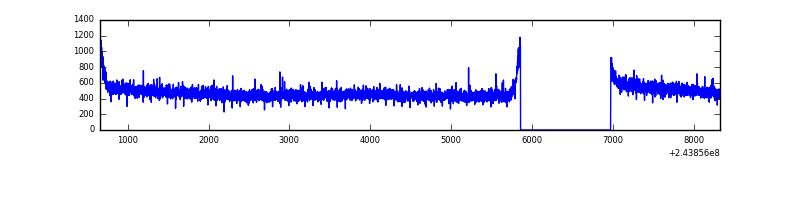 |
| D | 7667 | 6553 | 432 | 432 | 5.63% | 6.59% | 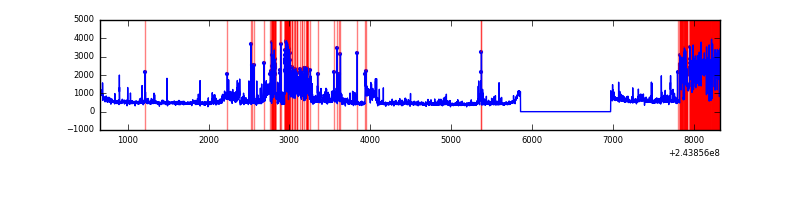 |
Top three noisy pixels from each quadrant. If the there are fewer than three noisy pixels in the level2.evt file, extra rows are filled as -1
| Pixel properties | Quadrant properties | ||||||
|---|---|---|---|---|---|---|---|
| Quadrant | DetID | PixID | Counts | Sigma | Mean | Median | Sigma |
| A | 13 | 248 | 61423 | 365.76 | 822 | 806 | 165.7 |
| A | 8 | 15 | 26520 | 155.16 | 822 | 806 | 165.7 |
| A | 15 | 223 | 17482 | 100.62 | 822 | 806 | 165.7 |
| B | 4 | 239 | 909702 | 5831.11 | 810 | 793 | 155.9 |
| B | 0 | 85 | 166725 | 1064.54 | 810 | 793 | 155.9 |
| B | 4 | 81 | 116015 | 739.21 | 810 | 793 | 155.9 |
| C | 8 | 128 | 10996 | 55.13 | 795 | 801 | 184.9 |
| C | 8 | 112 | 6250 | 29.47 | 795 | 801 | 184.9 |
| C | 13 | 61 | 5956 | 27.88 | 795 | 801 | 184.9 |
| D | 2 | 16 | 1922106 | 10353.99 | 773 | 753 | 185.6 |
| D | 1 | 52 | 42256 | 223.66 | 773 | 753 | 185.6 |
| D | 13 | 249 | 41881 | 221.63 | 773 | 753 | 185.6 |
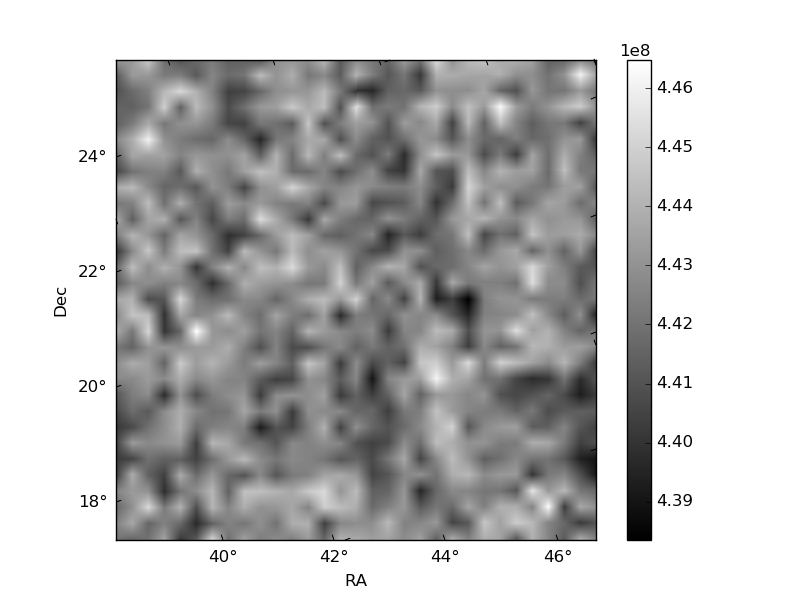
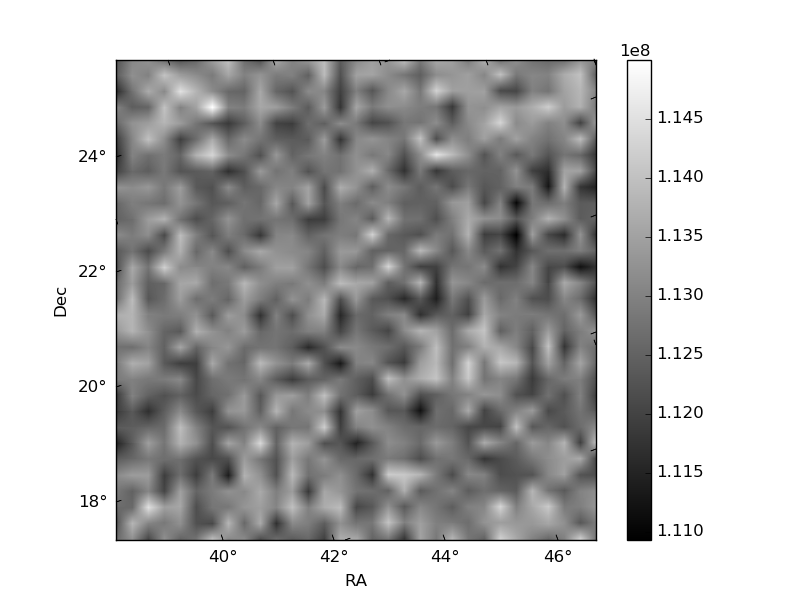
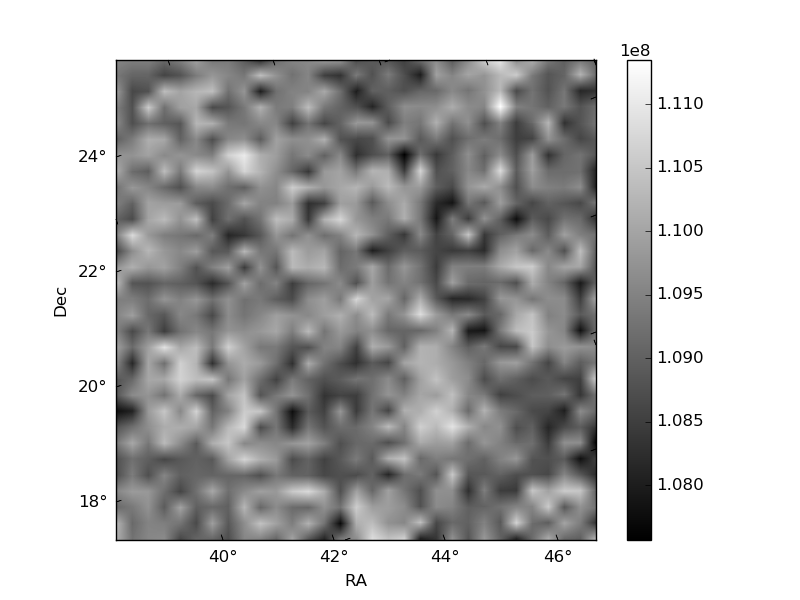
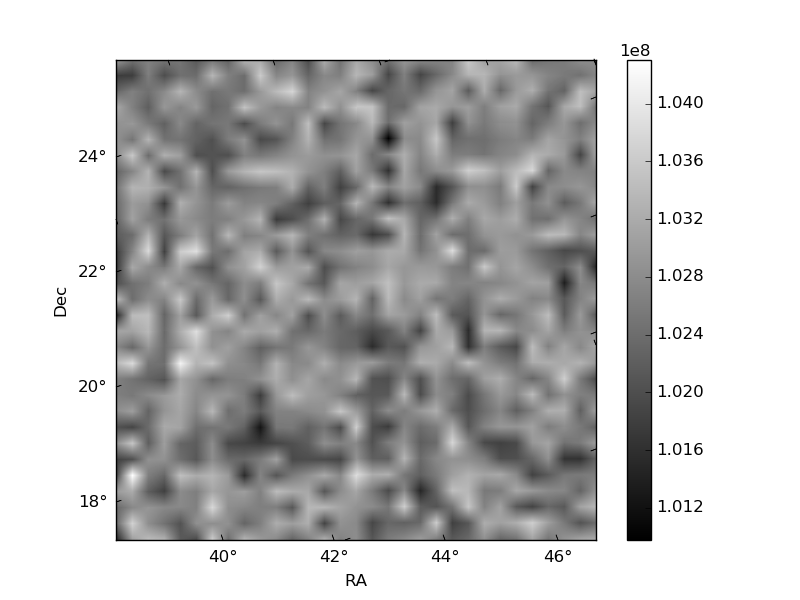
Histogram calculated using DETX and DETY for each event in the final _common_clean file
| Quadrant A | 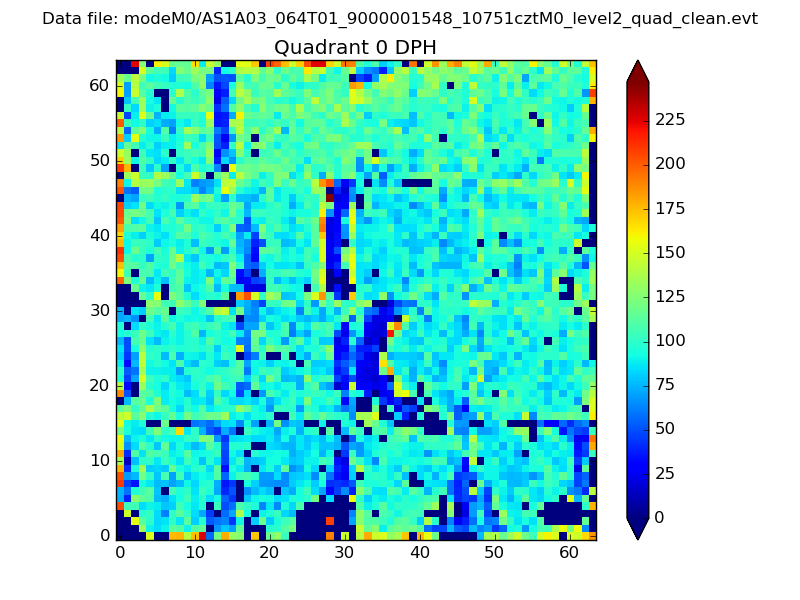 |
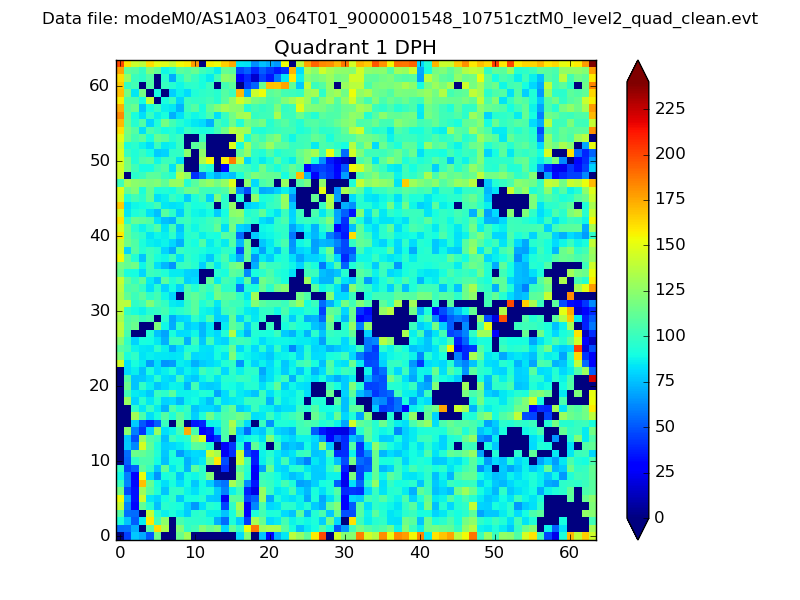 |
Quadrant B |
|---|---|---|---|
| Quadrant D |  |
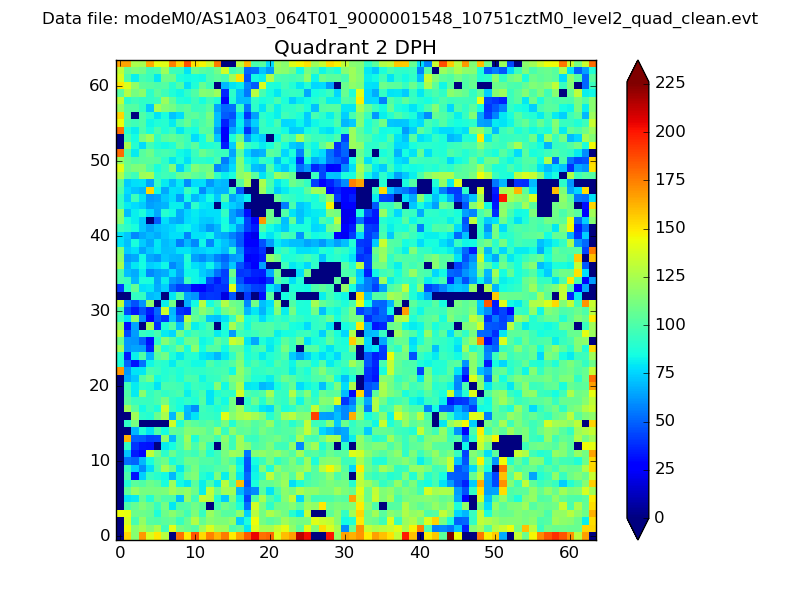 |
Quadrant C |
| Plot type | Count rate plots | Images |
|---|---|---|
| Comparison with Poisson distribution Blue bars denote a histogram of data divided into 1 sec bins. Red curve is a Poisson curve with rate = median count rate of data. |
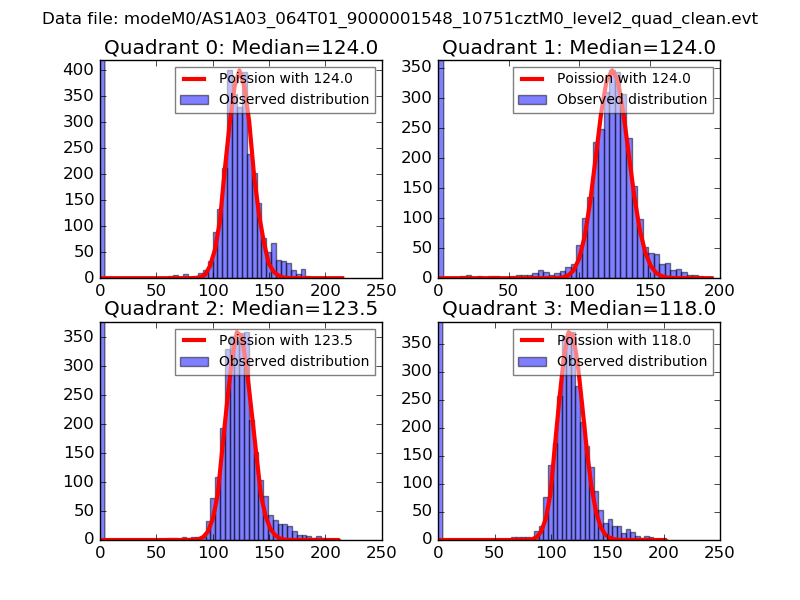 |
 |
| Quadrant-wise count rates Data is divided into 100 sec bins |
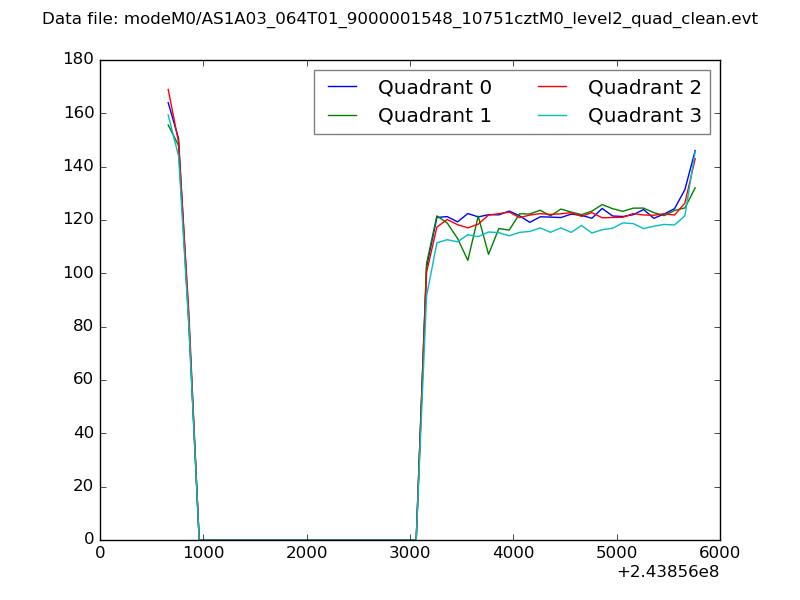 |
|
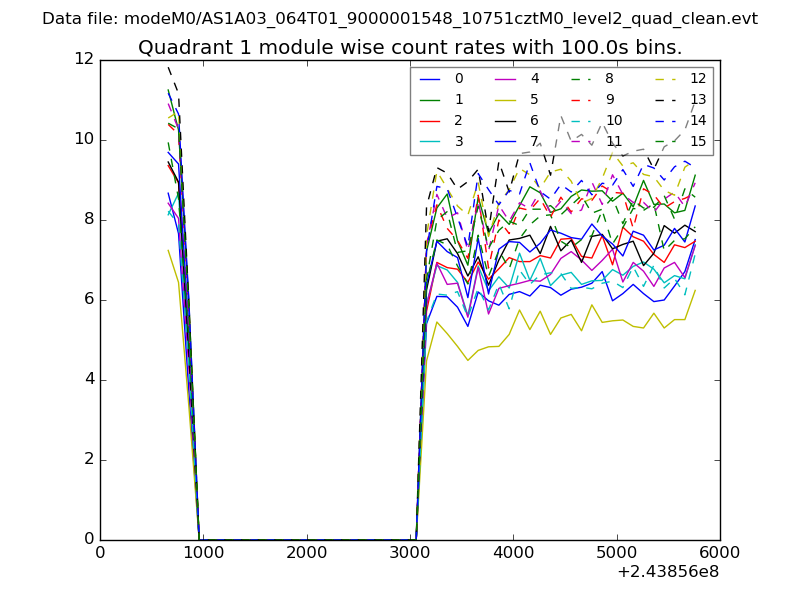
| Module-wise count rates for Quadrant A Data is divided into 100 sec bins |
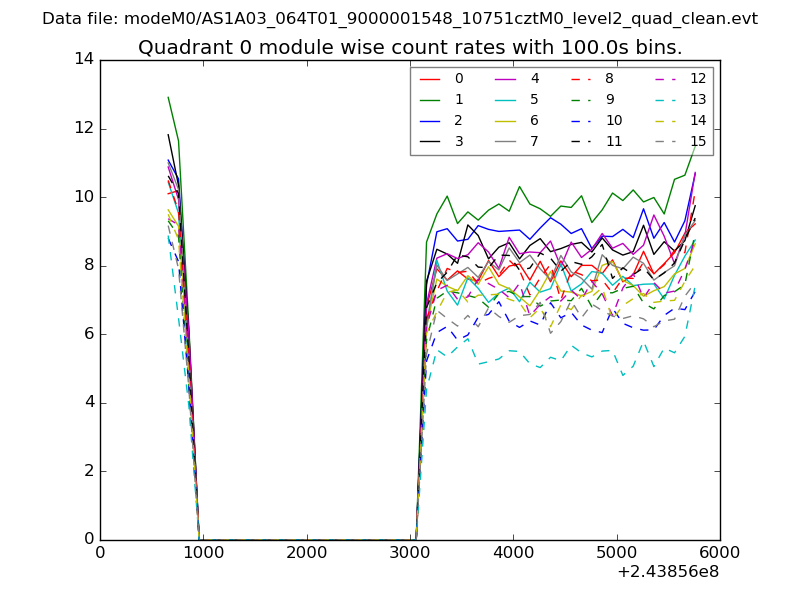 |
 |
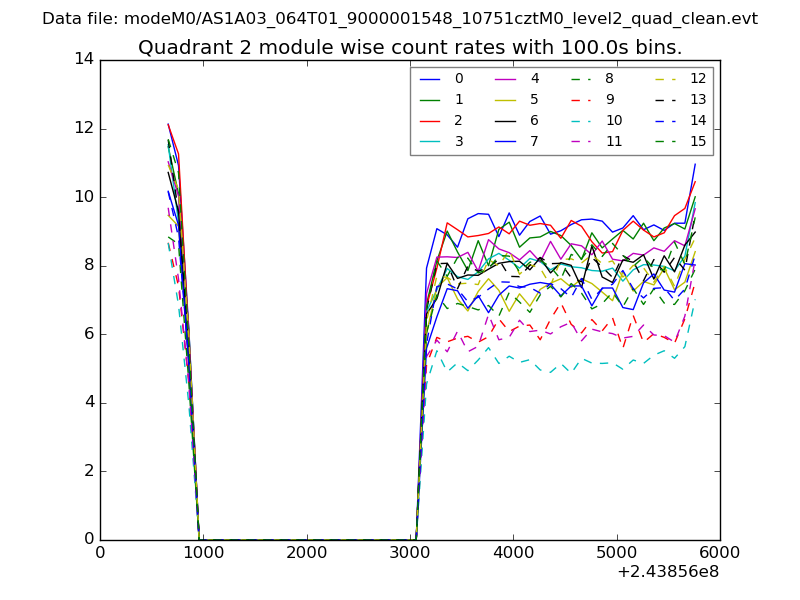
| Module-wise count rates for Quadrant B Data is divided into 100 sec bins |
 |
 |
| Module-wise count rates for Quadrant C Data is divided into 100 sec bins |
 |
 |
| Module-wise count rates for Quadrant D Data is divided into 100 sec bins |
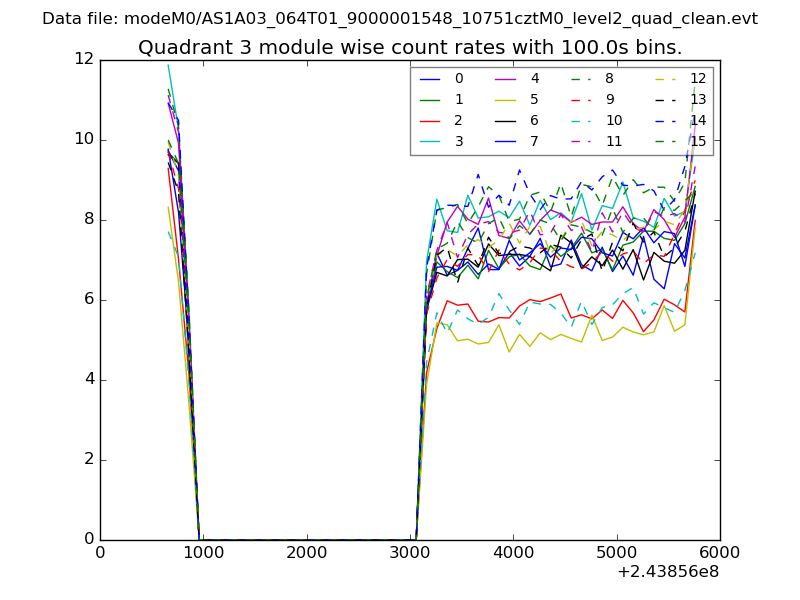 |
 |
| Parameter | Plot |
|---|---|
| CZT HV Monitor | 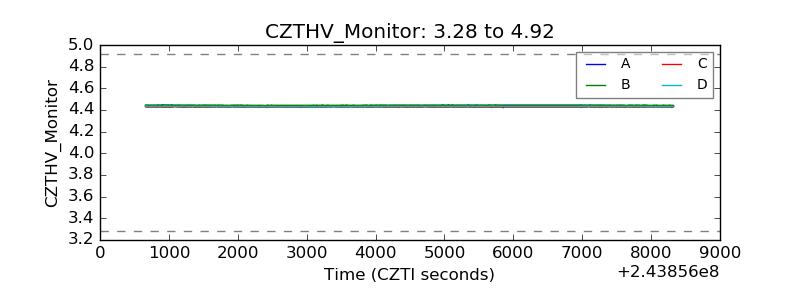 |
| D_VDD | 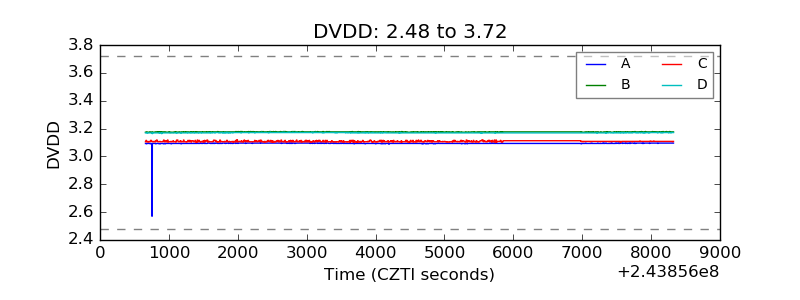 |
| Temperature 1 | 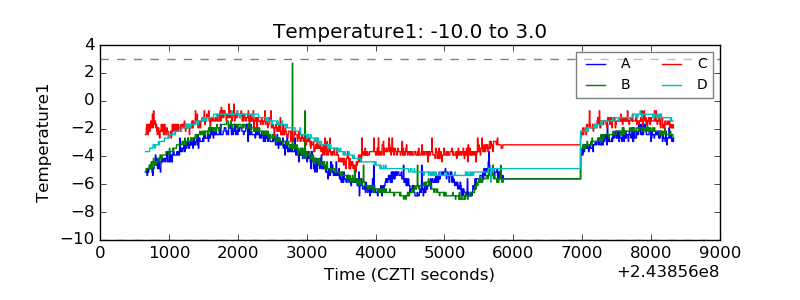 |
| Veto HV Monitor | 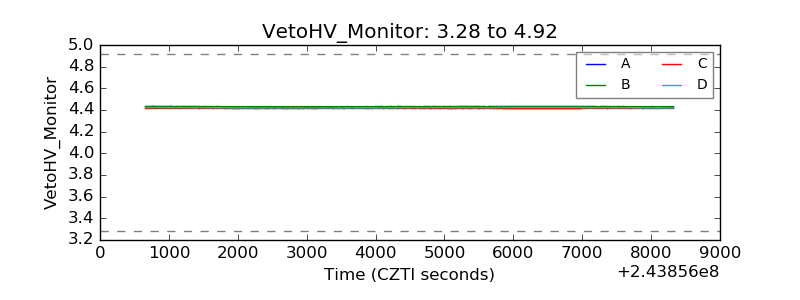 |
| Veto LLD |  |
| Alpha Counter | 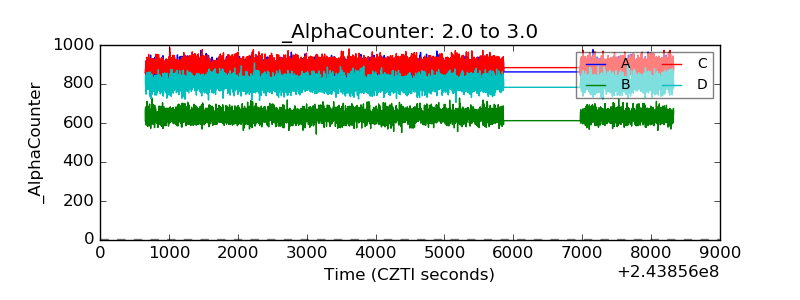 |
| _CPM_Rate | 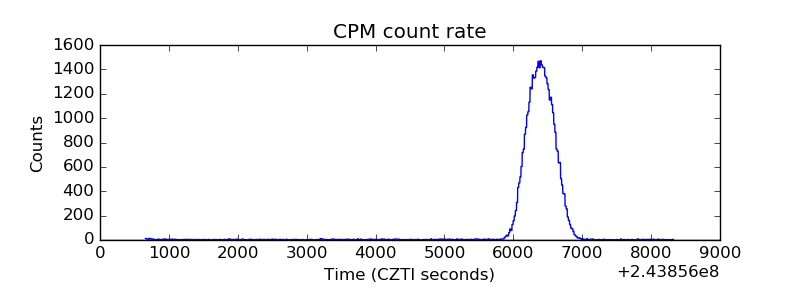 |
| CZT Counter | 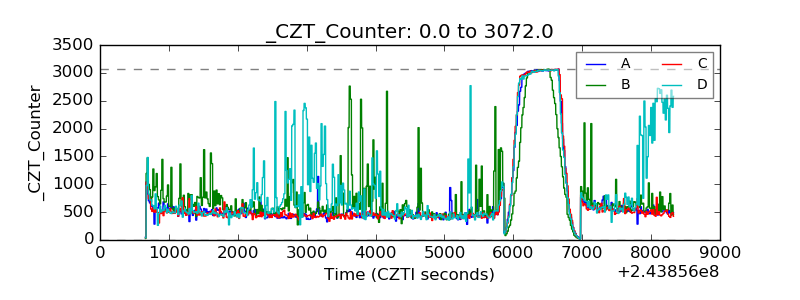 |
| +2.5 Volts monitor |  |
| +5 Volts monitor |  |
| _ROLL_ROT |  |
| _Roll_DEC | 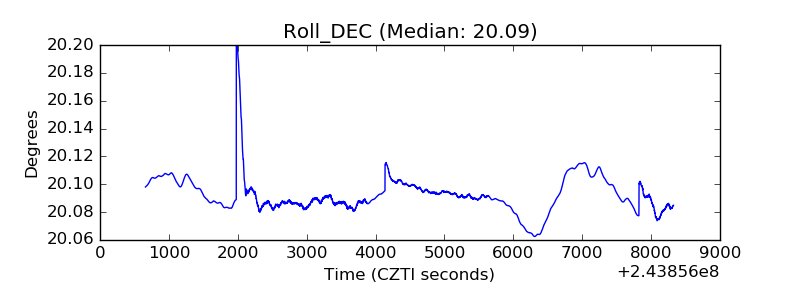 |
| _Roll_RA | 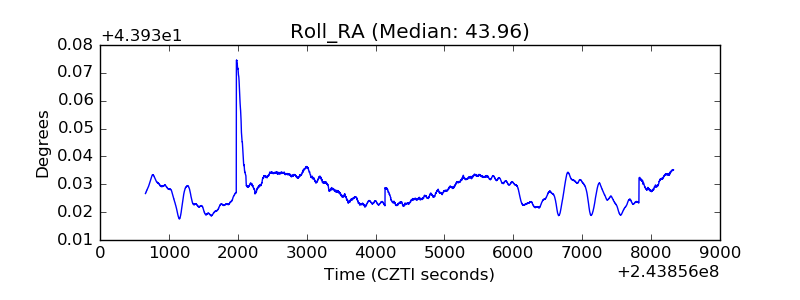 |
| Veto Counter | 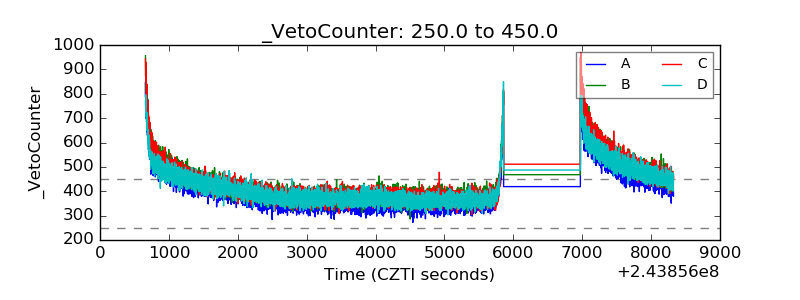 |