| Param | Original file | Final file |
|---|---|---|
| Filename | modeM0/AS1A03_064T01_9000001548_10752cztM0_level2.evt | modeM0/AS1A03_064T01_9000001548_10752cztM0_level2_quad_clean.evt |
| Size (bytes) | 623,831,040 | 63,846,720 |
| Size | 594.9 MB | 60.9 MB |
| Events in quadrant A | 3,465,291 | 377,095 |
| Events in quadrant B | 4,109,116 | 381,212 |
| Events in quadrant C | 3,196,412 | 380,348 |
| Events in quadrant D | 7,685,279 | 343,950 |
| Mode M0 | |||
|---|---|---|---|
| Quadrant | BADHDUFLAG | Total packets | Discarded packets |
| A | 0 | 14453 | 3 |
| B | 0 | 16517 | 2 |
| C | 0 | 13655 | 2 |
| D | 0 | 27283 | 2 |
| Mode M9 | |||
|---|---|---|---|
| Quadrant | BADHDUFLAG | Total packets | Discarded packets |
| A | 0 | 18 | 0 |
| B | 0 | 18 | 0 |
| C | 0 | 18 | 0 |
| D | 0 | 19 | 0 |
| Mode SS | |||
|---|---|---|---|
| Quadrant | BADHDUFLAG | Total packets | Discarded packets |
| A | 0 | 132 | 0 |
| B | 0 | 132 | 0 |
| C | 0 | 132 | 0 |
| D | 0 | 132 | 0 |
| Quadrant | Total seconds | Saturated seconds | Saturation percentage |
|---|---|---|---|
| A | 6449 | 101 | 1.566134% |
| B | 6449 | 202 | 3.132269% |
| C | 6449 | 49 | 0.759808% |
| D | 6449 | 1364 | 21.150566% |
Noise dominated data is calculated using 1-second bins in cleaned event files. If a bin has >2000 counts, and if more than 50% of those come from <1% of pixels, then it is considered to be noise-dominated and hence unusable.
| Quadrant | # 1 sec bins | Bins with >0 counts | Bins with >2000 counts | High rate bins dominated by noise | Noise dominated (total time) | Noise dominated (detector-on time) | Marked lightcurve |
|---|---|---|---|---|---|---|---|
| A | 7649 | 6449 | 26 | 26 | 0.34% | 0.40% | 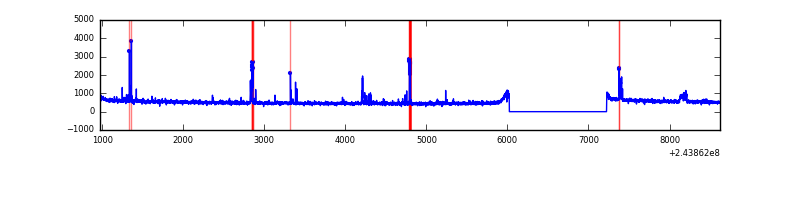 |
| B | 7649 | 6450 | 72 | 72 | 0.94% | 1.12% | 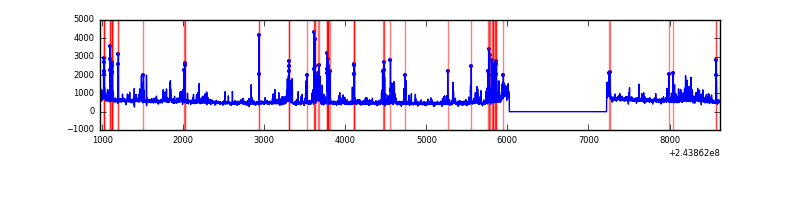 |
| C | 7649 | 6450 | 0 | 0 | 0.00% | 0.00% | 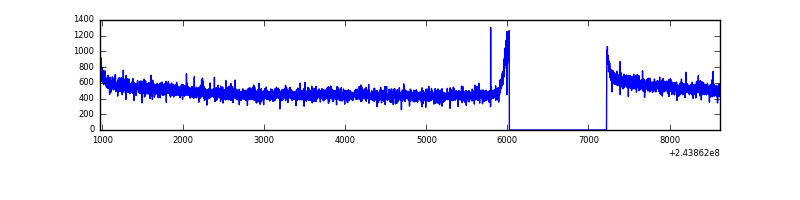 |
| D | 7649 | 6449 | 1109 | 1109 | 14.50% | 17.20% | 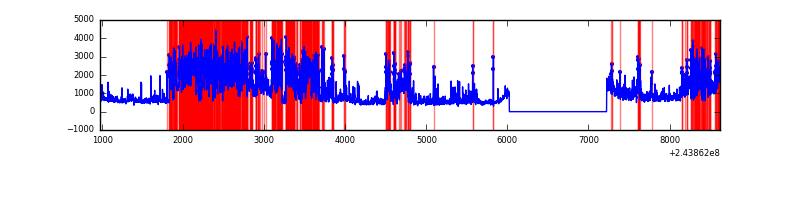 |
Top three noisy pixels from each quadrant. If the there are fewer than three noisy pixels in the level2.evt file, extra rows are filled as -1
| Pixel properties | Quadrant properties | ||||||
|---|---|---|---|---|---|---|---|
| Quadrant | DetID | PixID | Counts | Sigma | Mean | Median | Sigma |
| A | 15 | 223 | 98726 | 580.5 | 838 | 821 | 168.7 |
| A | 15 | 239 | 43531 | 253.24 | 838 | 821 | 168.7 |
| A | 15 | 174 | 32408 | 187.29 | 838 | 821 | 168.7 |
| B | 4 | 239 | 527685 | 3315.82 | 835 | 816 | 158.9 |
| B | 4 | 81 | 167038 | 1046.11 | 835 | 816 | 158.9 |
| B | 0 | 214 | 47115 | 291.38 | 835 | 816 | 158.9 |
| C | 13 | 61 | 6137 | 28.17 | 818 | 825 | 188.6 |
| C | 14 | 234 | 4290 | 18.37 | 818 | 825 | 188.6 |
| C | 8 | 222 | 2371 | 8.2 | 818 | 825 | 188.6 |
| D | 2 | 16 | 4363859 | 23922.63 | 760 | 740 | 182.4 |
| D | 1 | 52 | 134046 | 730.91 | 760 | 740 | 182.4 |
| D | 8 | 195 | 97625 | 531.21 | 760 | 740 | 182.4 |
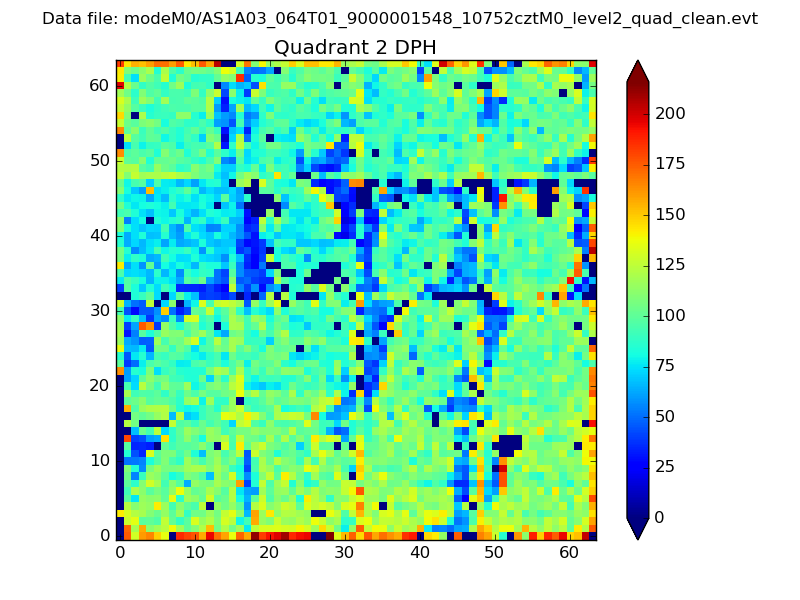
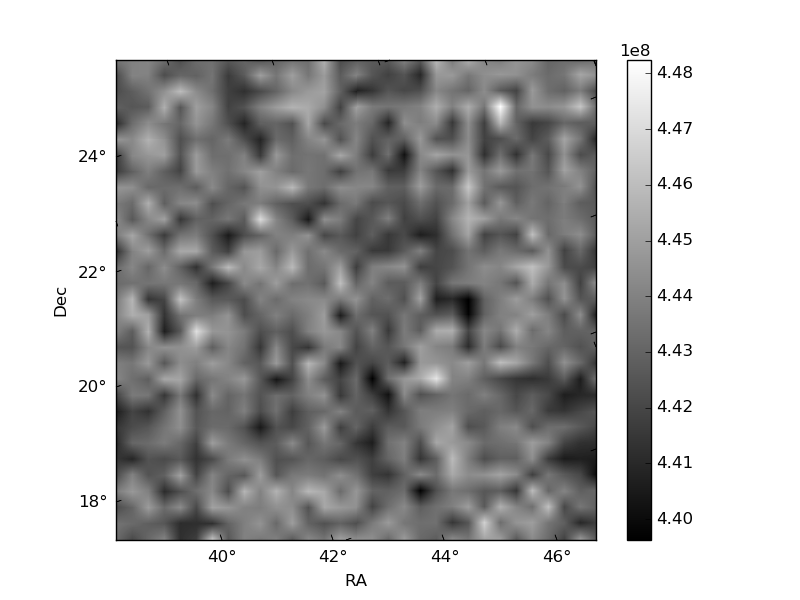
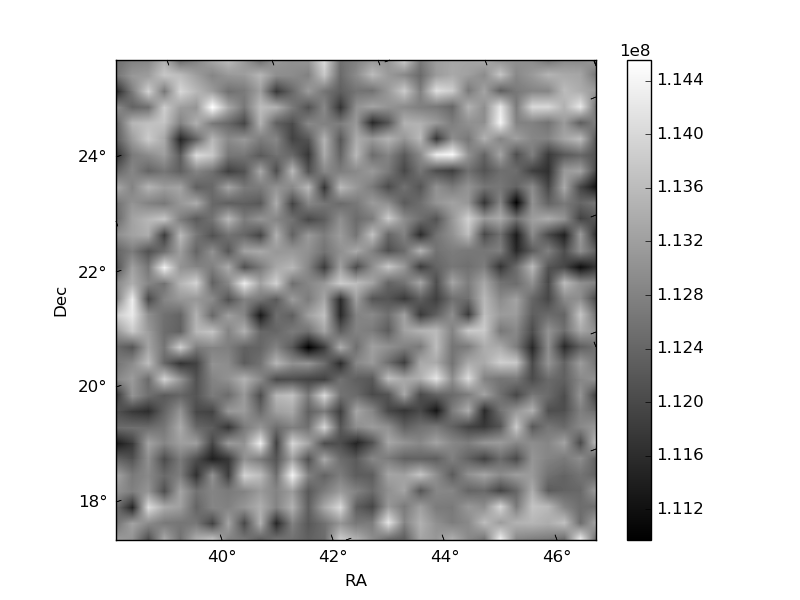
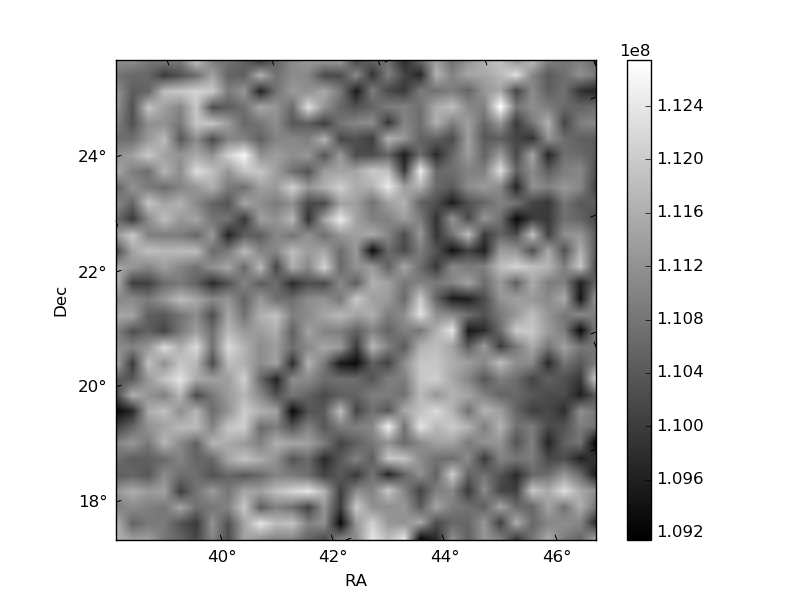
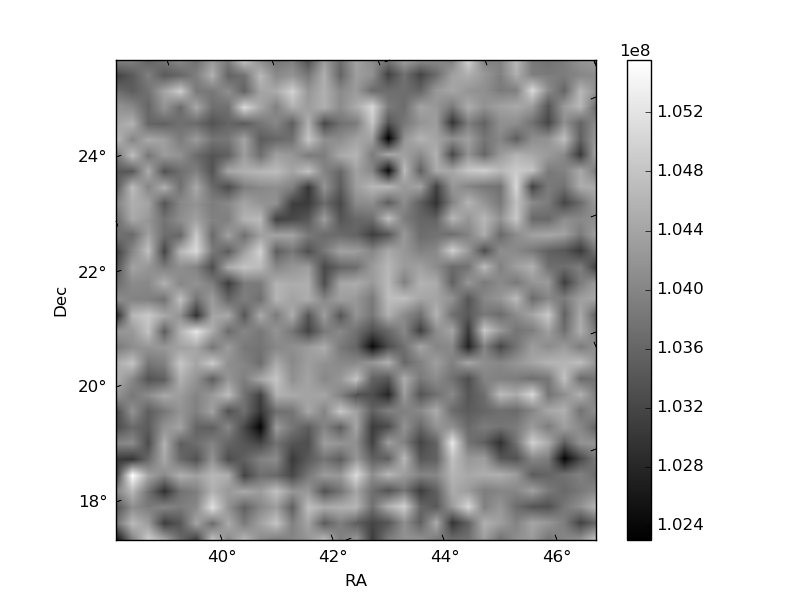
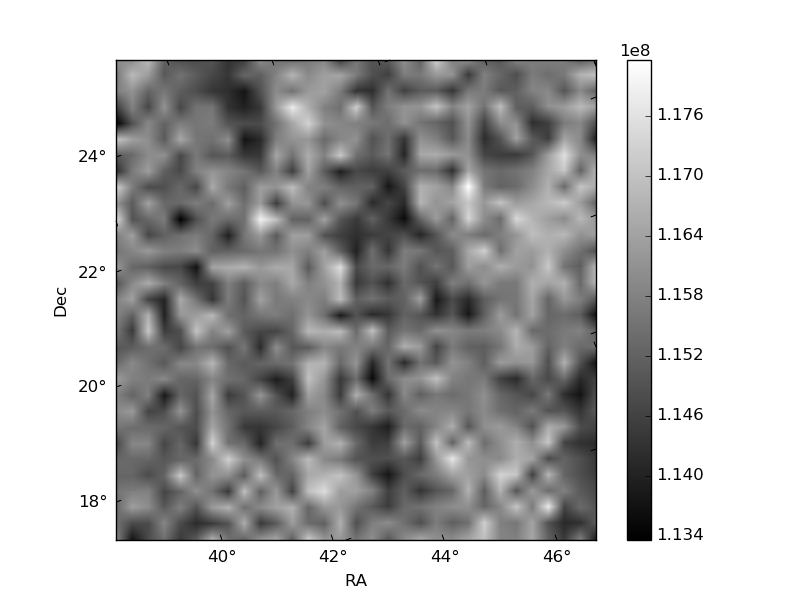
Histogram calculated using DETX and DETY for each event in the final _common_clean file
| Quadrant A | 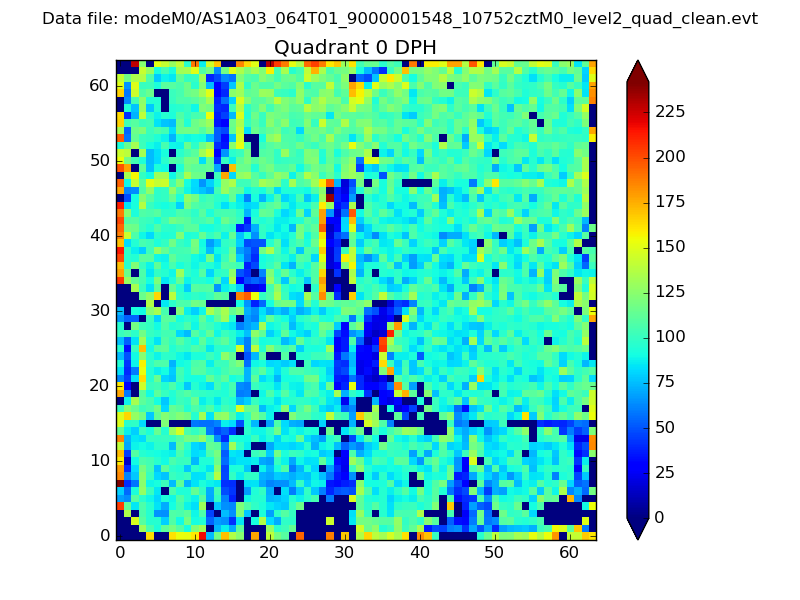 |
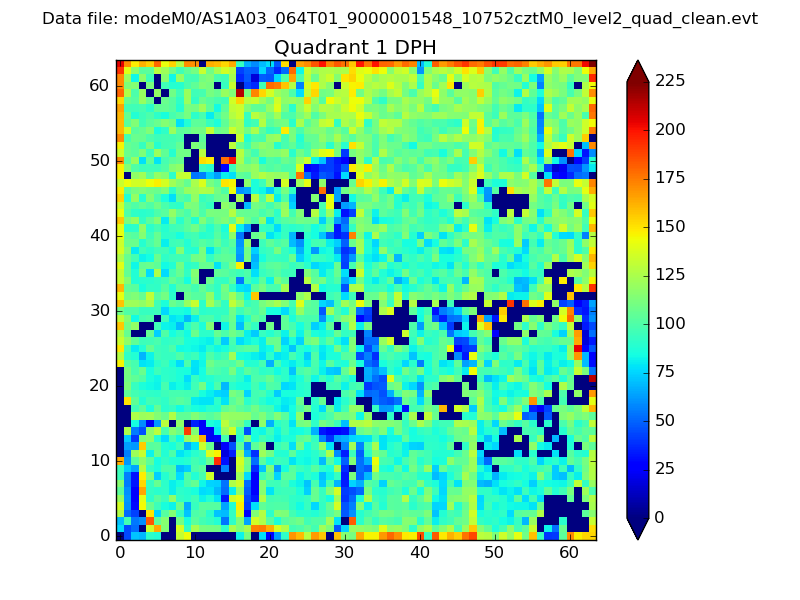 |
Quadrant B |
|---|---|---|---|
| Quadrant D | 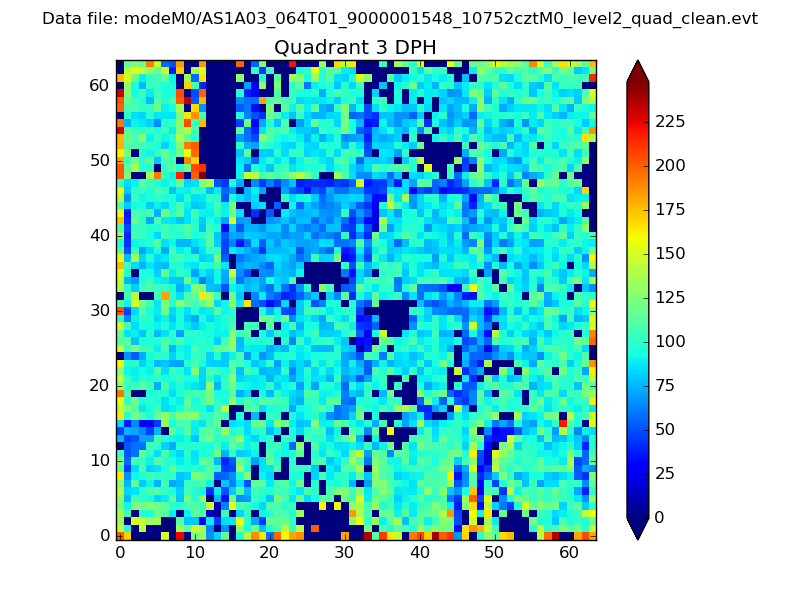 |
 |
Quadrant C |
| Plot type | Count rate plots | Images |
|---|---|---|
| Comparison with Poisson distribution Blue bars denote a histogram of data divided into 1 sec bins. Red curve is a Poisson curve with rate = median count rate of data. |
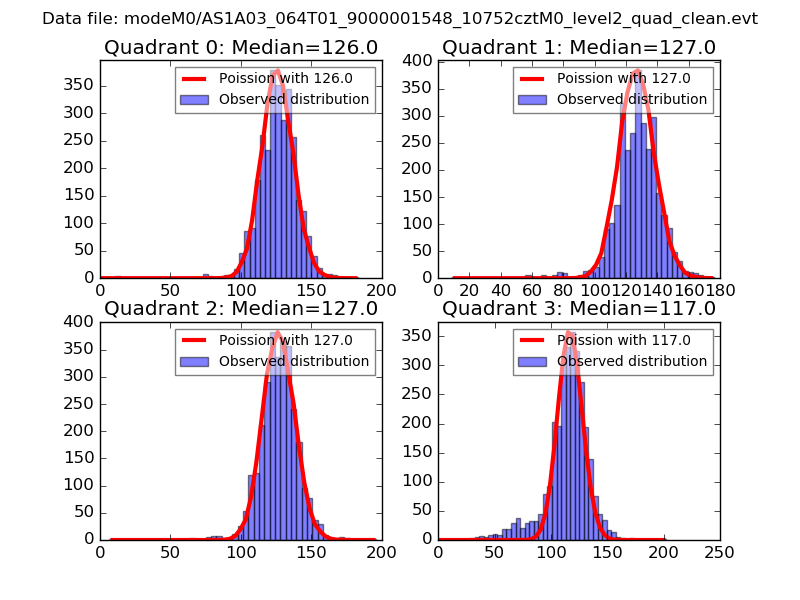 |
 |
| Quadrant-wise count rates Data is divided into 100 sec bins |
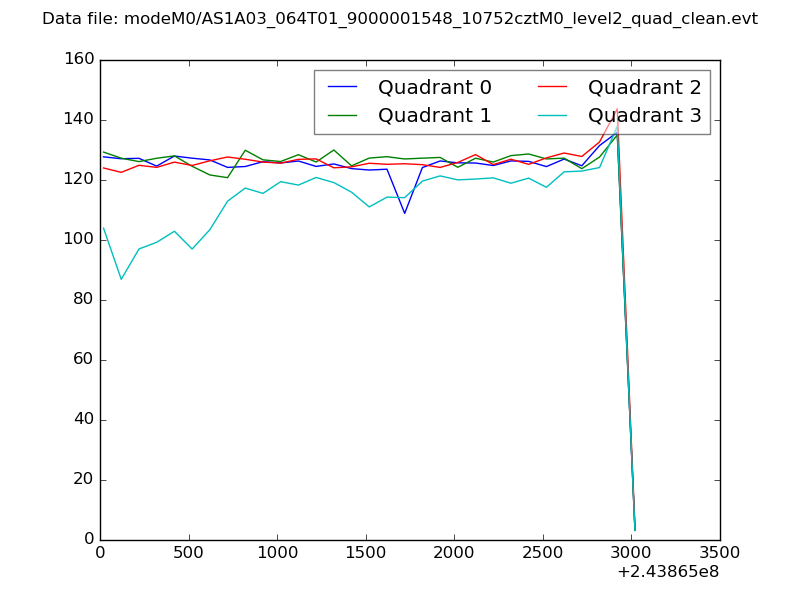 |
|
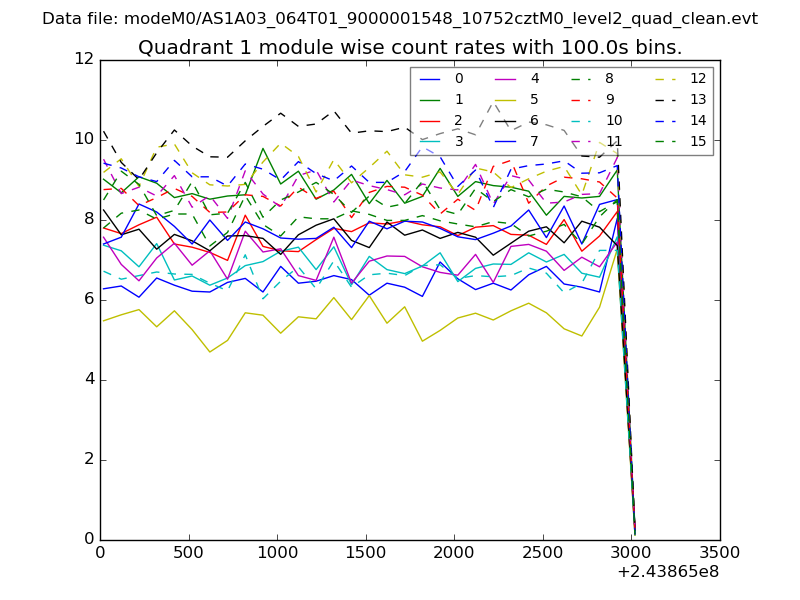
| Module-wise count rates for Quadrant A Data is divided into 100 sec bins |
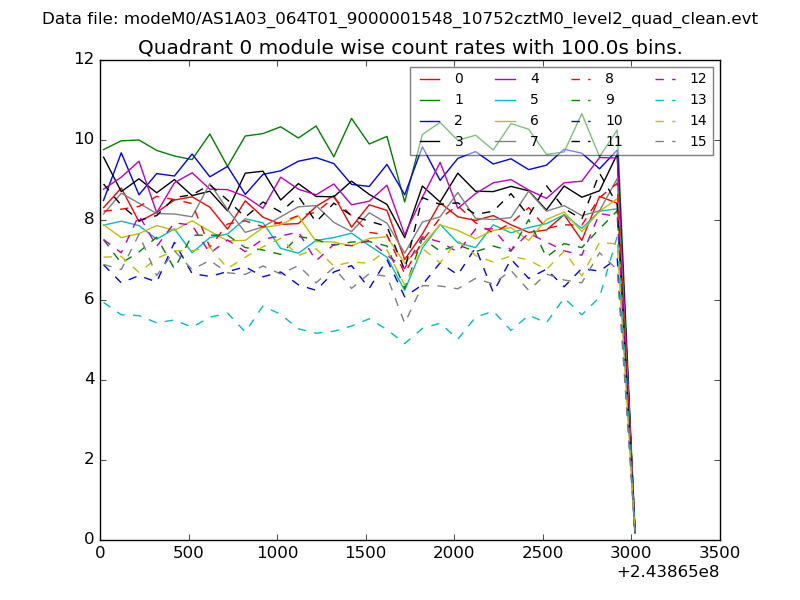 |
 |
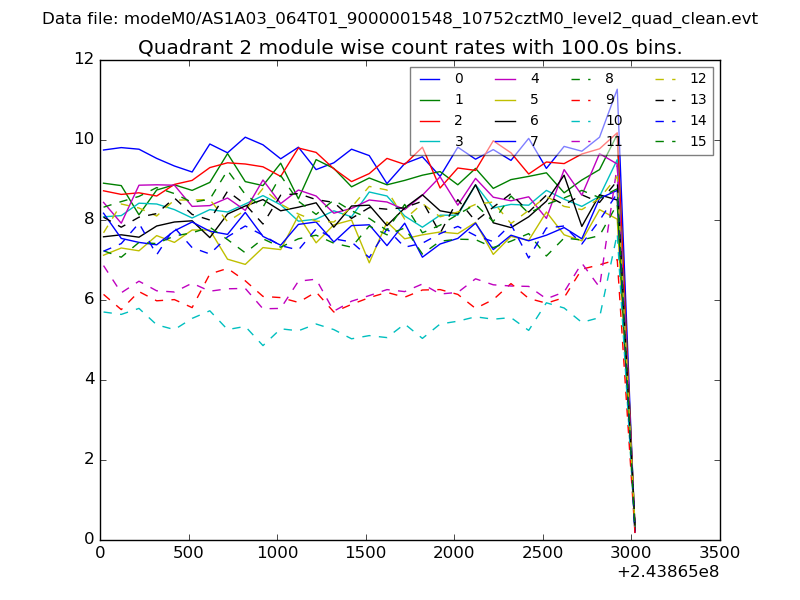
| Module-wise count rates for Quadrant B Data is divided into 100 sec bins |
 |
 |
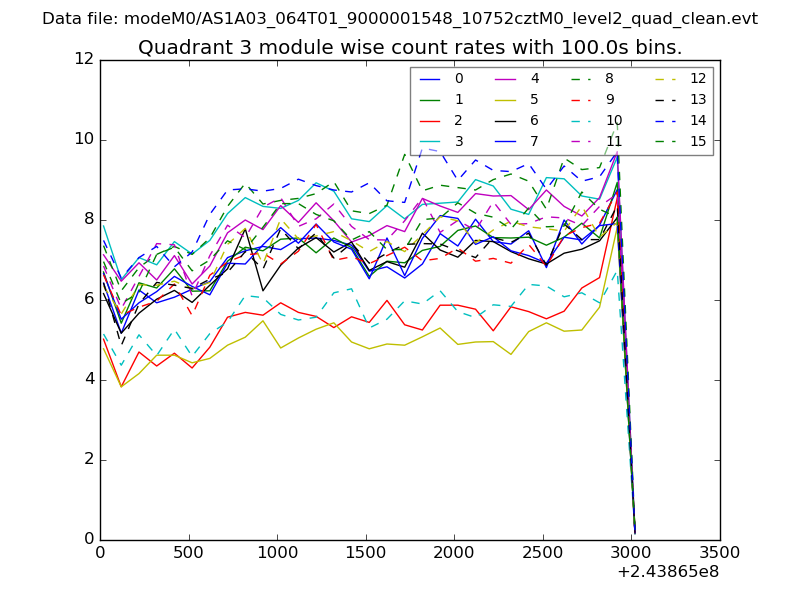
| Module-wise count rates for Quadrant C Data is divided into 100 sec bins |
 |
 |
| Module-wise count rates for Quadrant D Data is divided into 100 sec bins |
 |
 |
| Parameter | Plot |
|---|---|
| CZT HV Monitor | 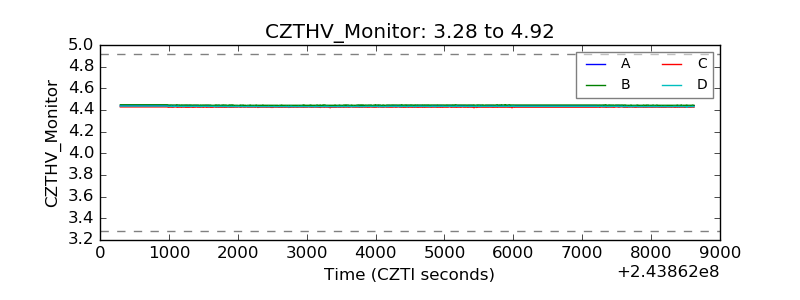 |
| D_VDD | 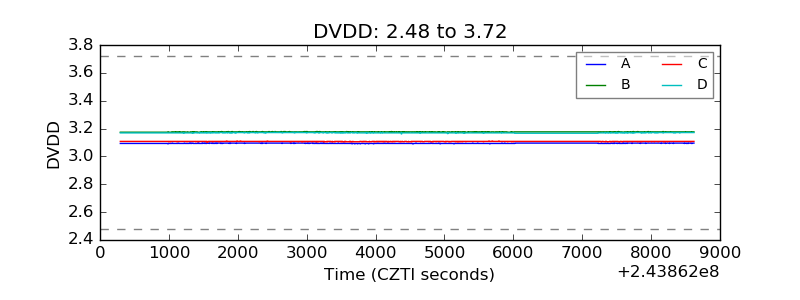 |
| Temperature 1 | 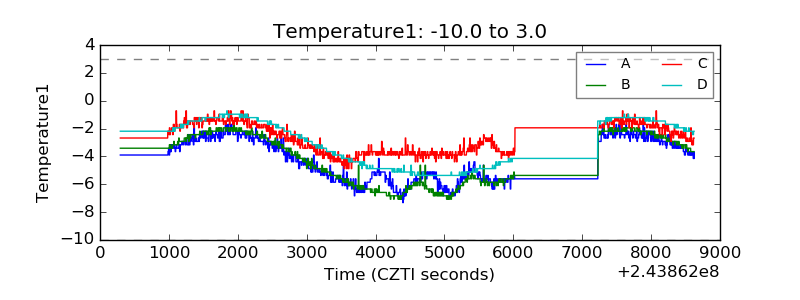 |
| Veto HV Monitor | 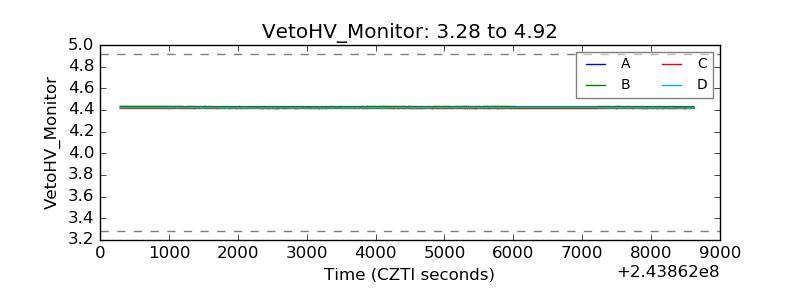 |
| Veto LLD | 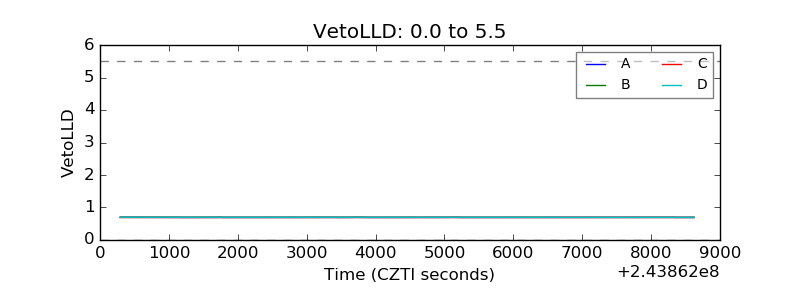 |
| Alpha Counter | 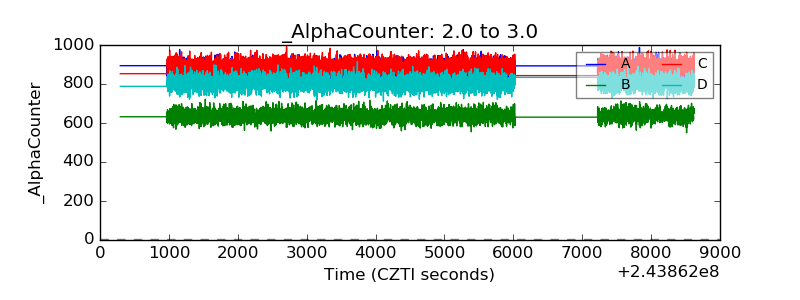 |
| _CPM_Rate | 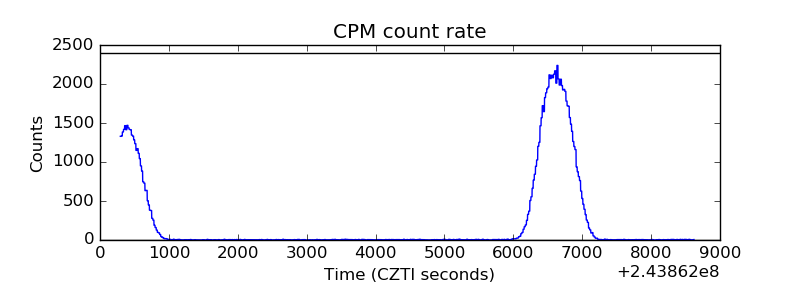 |
| CZT Counter | 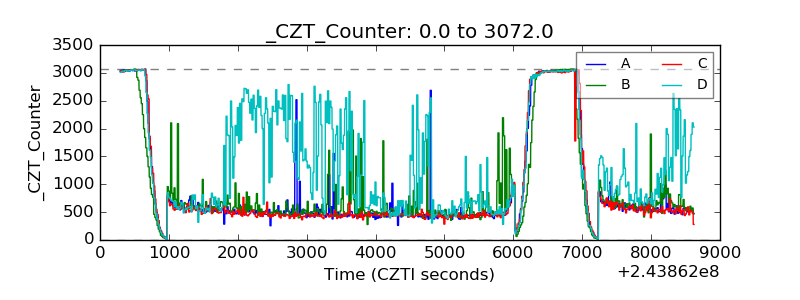 |
| +2.5 Volts monitor |  |
| +5 Volts monitor |  |
| _ROLL_ROT | 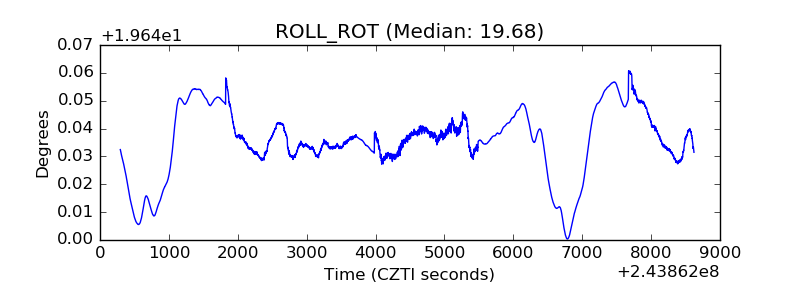 |
| _Roll_DEC | 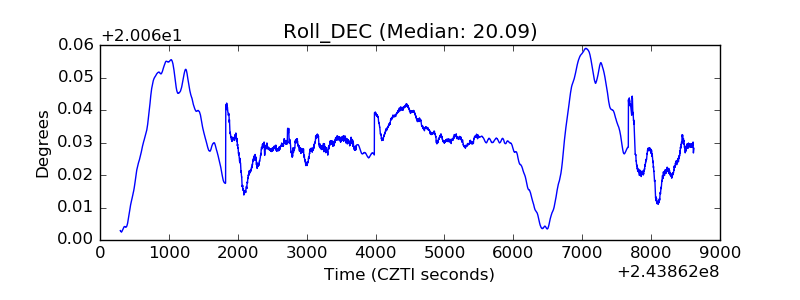 |
| _Roll_RA | 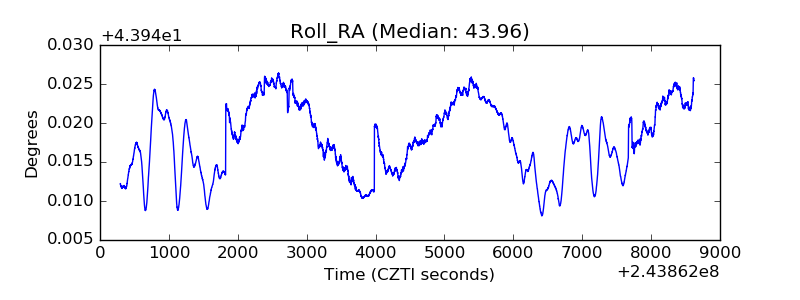 |
| Veto Counter | 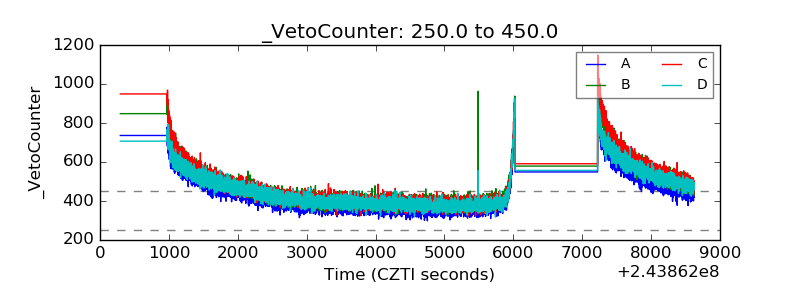 |