| Param | Original file | Final file |
|---|---|---|
| Filename | modeM0/AS1A03_064T01_9000001548_10753cztM0_level2.evt | modeM0/AS1A03_064T01_9000001548_10753cztM0_level2_quad_clean.evt |
| Size (bytes) | 639,941,760 | 73,411,200 |
| Size | 610.3 MB | 70.0 MB |
| Events in quadrant A | 3,792,536 | 449,736 |
| Events in quadrant B | 4,485,786 | 453,155 |
| Events in quadrant C | 3,241,917 | 459,674 |
| Events in quadrant D | 7,433,555 | 419,211 |
| Mode M0 | |||
|---|---|---|---|
| Quadrant | BADHDUFLAG | Total packets | Discarded packets |
| A | 0 | 15393 | 3 |
| B | 0 | 17609 | 2 |
| C | 0 | 13654 | 2 |
| D | 0 | 26450 | 2 |
| Mode M9 | |||
|---|---|---|---|
| Quadrant | BADHDUFLAG | Total packets | Discarded packets |
| A | 0 | 17 | 0 |
| B | 0 | 17 | 0 |
| C | 0 | 17 | 0 |
| D | 0 | 18 | 0 |
| Mode SS | |||
|---|---|---|---|
| Quadrant | BADHDUFLAG | Total packets | Discarded packets |
| A | 0 | 128 | 0 |
| B | 0 | 128 | 0 |
| C | 0 | 128 | 0 |
| D | 0 | 128 | 0 |
| Quadrant | Total seconds | Saturated seconds | Saturation percentage |
|---|---|---|---|
| A | 6309 | 187 | 2.964020% |
| B | 6309 | 235 | 3.724838% |
| C | 6309 | 60 | 0.951022% |
| D | 6309 | 1031 | 16.341734% |
Noise dominated data is calculated using 1-second bins in cleaned event files. If a bin has >2000 counts, and if more than 50% of those come from <1% of pixels, then it is considered to be noise-dominated and hence unusable.
| Quadrant | # 1 sec bins | Bins with >0 counts | Bins with >2000 counts | High rate bins dominated by noise | Noise dominated (total time) | Noise dominated (detector-on time) | Marked lightcurve |
|---|---|---|---|---|---|---|---|
| A | 7594 | 6309 | 99 | 99 | 1.30% | 1.57% | 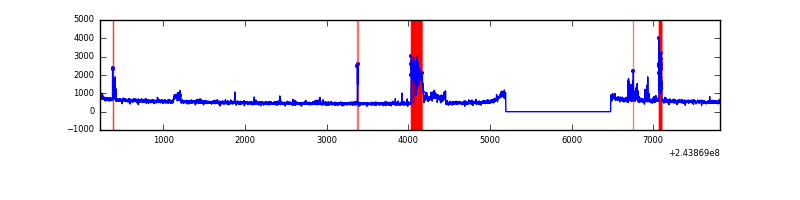 |
| B | 7594 | 6309 | 96 | 96 | 1.26% | 1.52% | 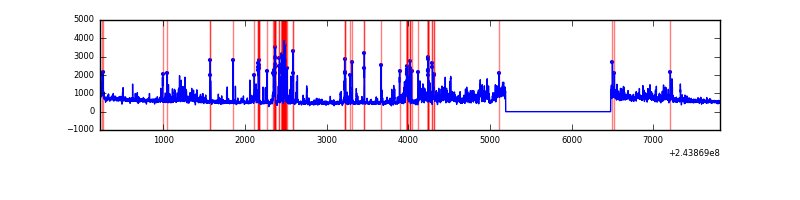 |
| C | 7594 | 6309 | 0 | 0 | 0.00% | 0.00% | 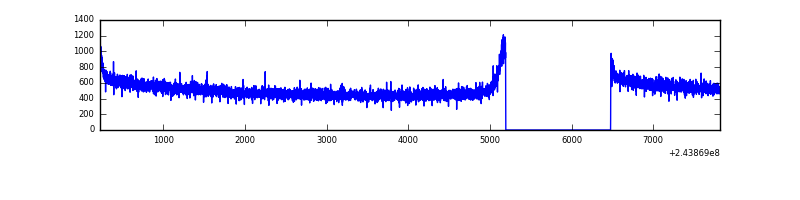 |
| D | 7594 | 6309 | 873 | 873 | 11.50% | 13.84% | 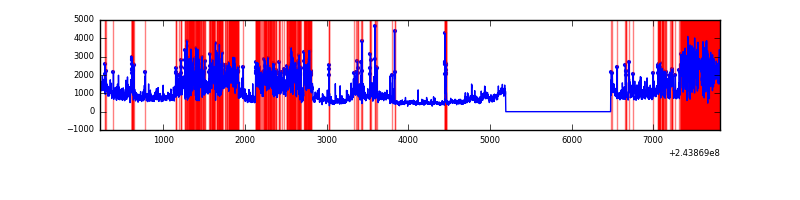 |
Top three noisy pixels from each quadrant. If the there are fewer than three noisy pixels in the level2.evt file, extra rows are filled as -1
| Pixel properties | Quadrant properties | ||||||
|---|---|---|---|---|---|---|---|
| Quadrant | DetID | PixID | Counts | Sigma | Mean | Median | Sigma |
| A | 15 | 239 | 356507 | 2133.51 | 840 | 825 | 166.7 |
| A | 15 | 174 | 134628 | 802.6 | 840 | 825 | 166.7 |
| A | 15 | 223 | 28913 | 168.48 | 840 | 825 | 166.7 |
| B | 4 | 239 | 551398 | 3478.18 | 842 | 825 | 158.3 |
| B | 0 | 85 | 484952 | 3058.42 | 842 | 825 | 158.3 |
| B | 0 | 214 | 43566 | 270.01 | 842 | 825 | 158.3 |
| C | 13 | 61 | 6078 | 27.51 | 830 | 836 | 190.6 |
| C | 14 | 234 | 4187 | 17.58 | 830 | 836 | 190.6 |
| C | 8 | 222 | 2294 | 7.65 | 830 | 836 | 190.6 |
| D | 2 | 16 | 3867937 | 20464.94 | 783 | 761 | 189.0 |
| D | 10 | 199 | 201870 | 1064.26 | 783 | 761 | 189.0 |
| D | 1 | 52 | 167562 | 882.7 | 783 | 761 | 189.0 |
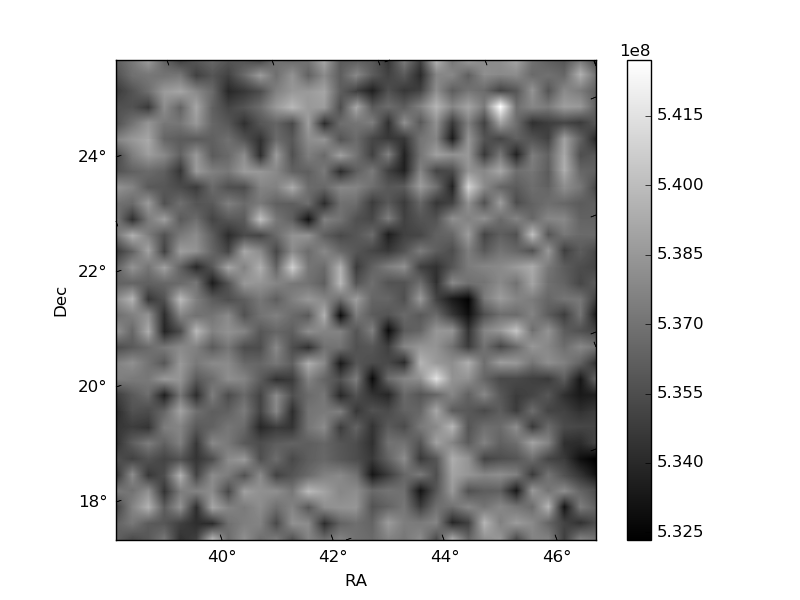
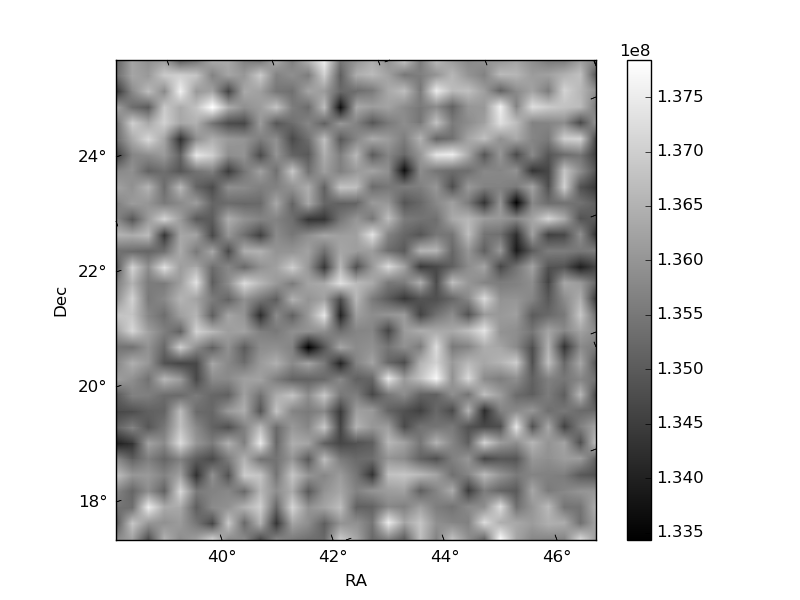
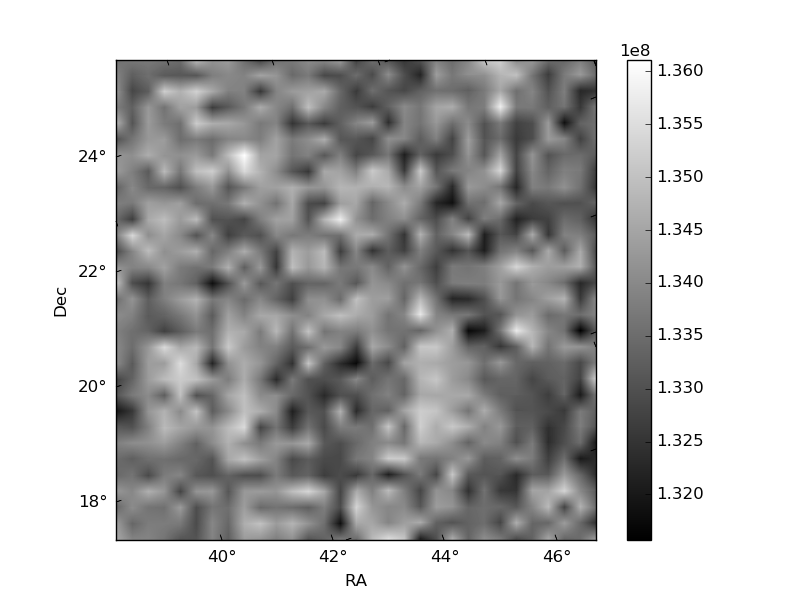
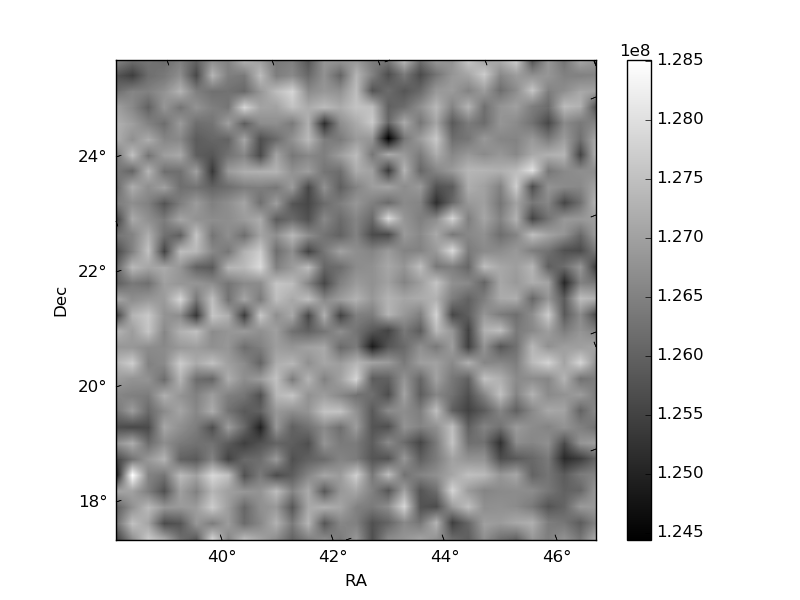
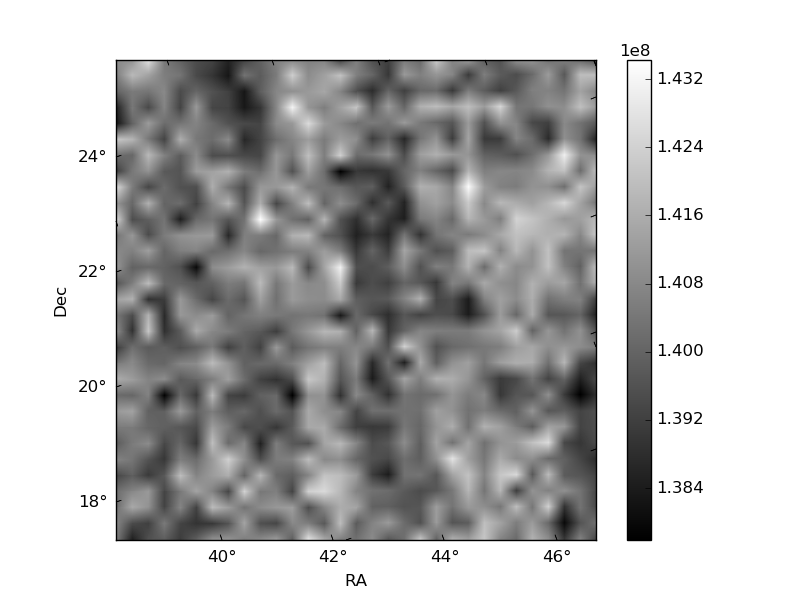
Histogram calculated using DETX and DETY for each event in the final _common_clean file
| Quadrant A | 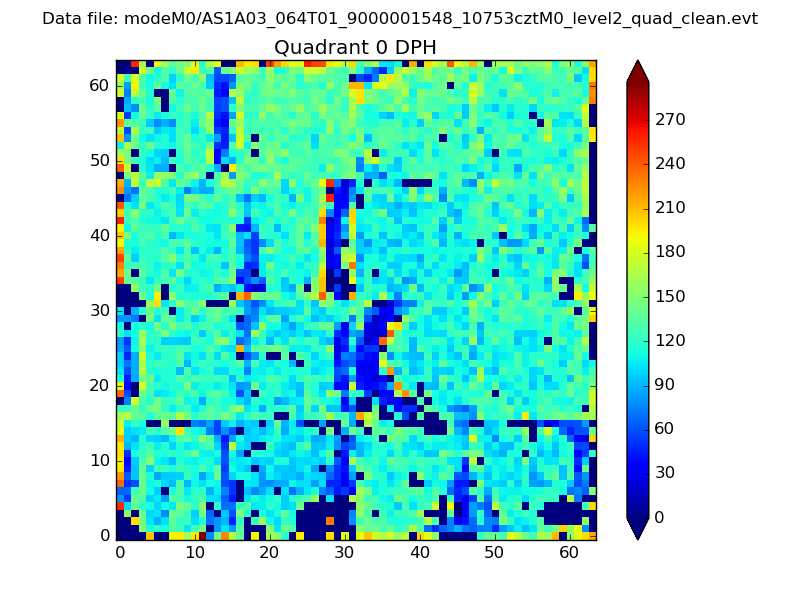 |
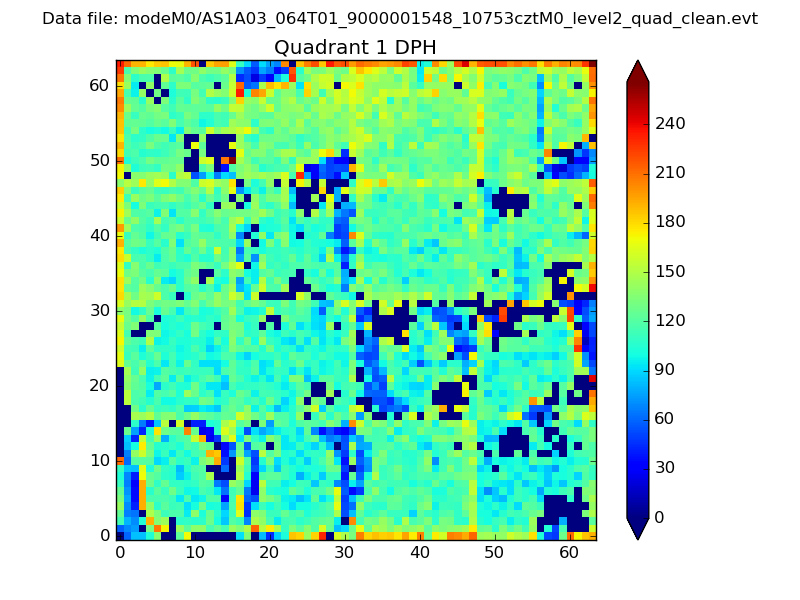 |
Quadrant B |
|---|---|---|---|
| Quadrant D | 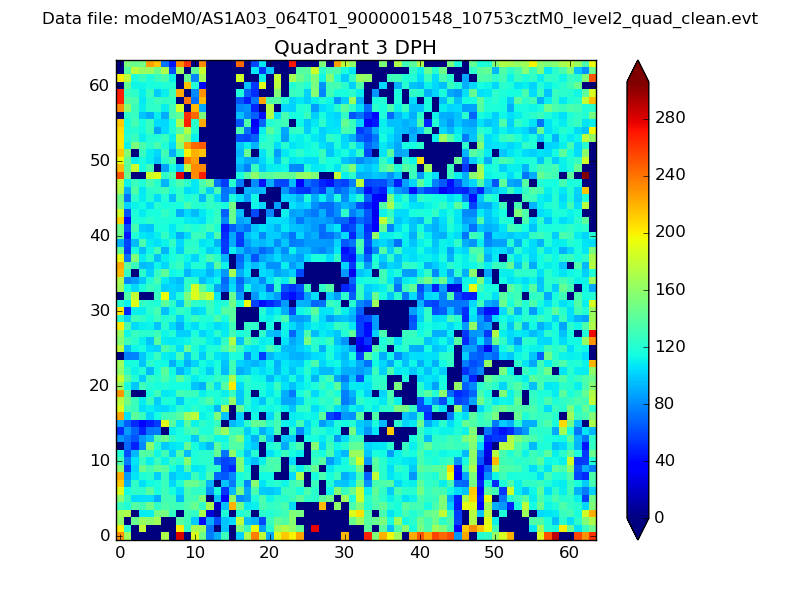 |
 |
Quadrant C |
| Plot type | Count rate plots | Images |
|---|---|---|
| Comparison with Poisson distribution Blue bars denote a histogram of data divided into 1 sec bins. Red curve is a Poisson curve with rate = median count rate of data. |
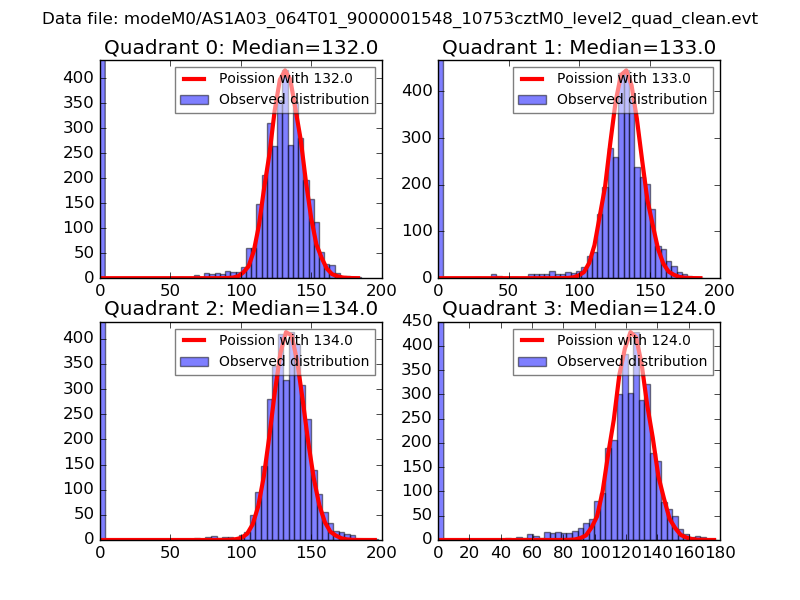 |
 |
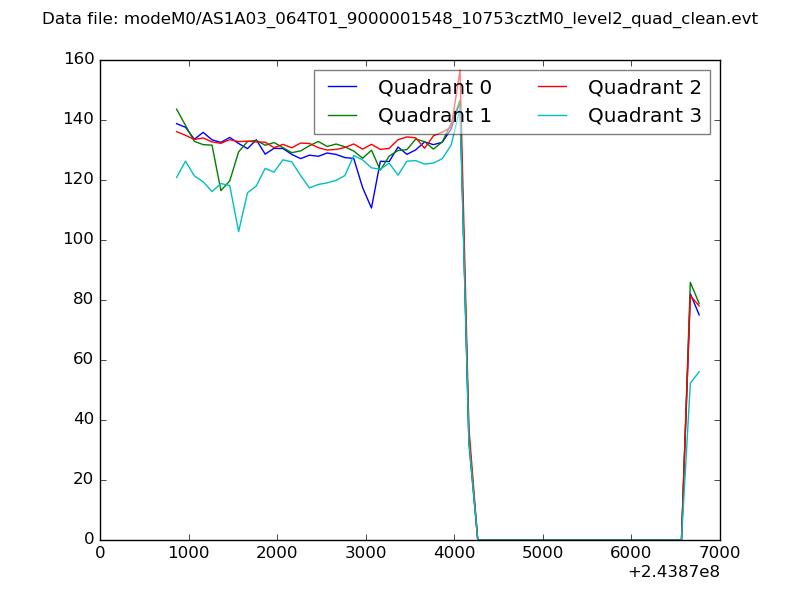
| Quadrant-wise count rates Data is divided into 100 sec bins |
 |
|
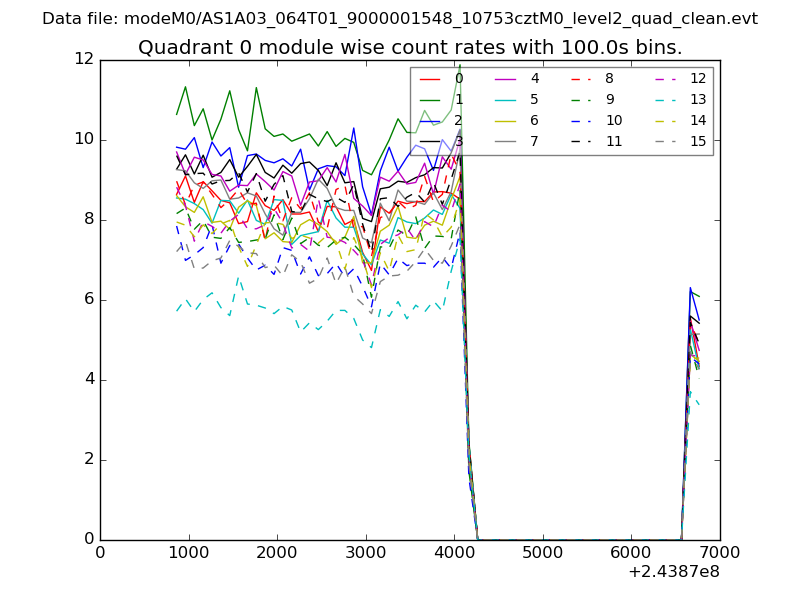
| Module-wise count rates for Quadrant A Data is divided into 100 sec bins |
 |
 |
| Module-wise count rates for Quadrant B Data is divided into 100 sec bins |
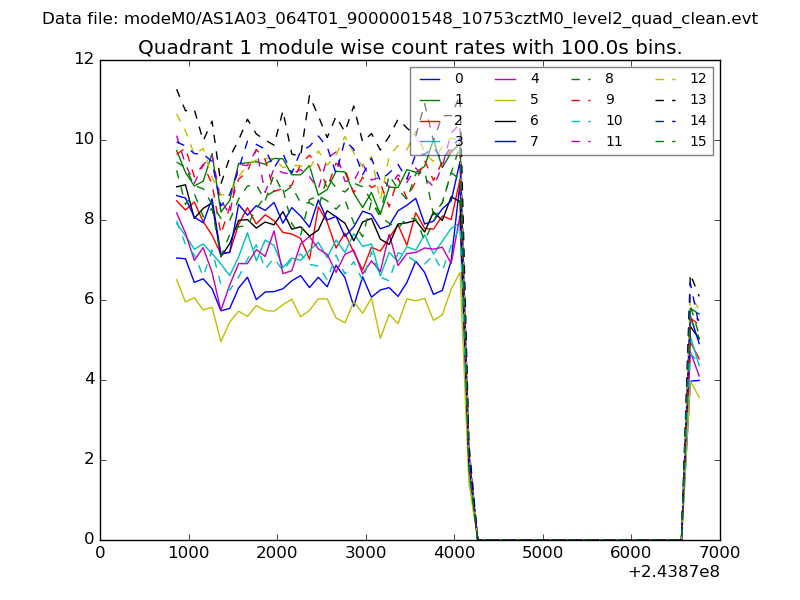 |
 |
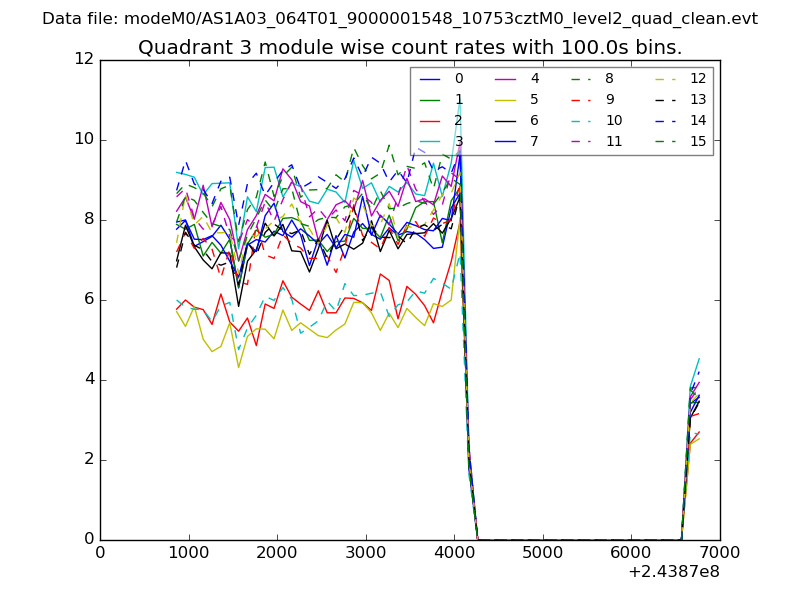
| Module-wise count rates for Quadrant C Data is divided into 100 sec bins |
 |
 |
| Module-wise count rates for Quadrant D Data is divided into 100 sec bins |
 |
 |
| Parameter | Plot |
|---|---|
| CZT HV Monitor | 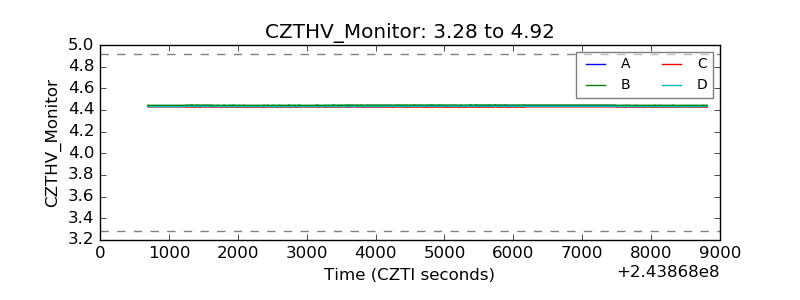 |
| D_VDD | 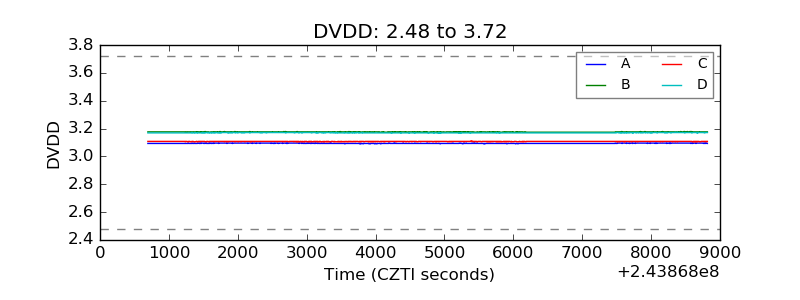 |
| Temperature 1 |  |
| Veto HV Monitor | 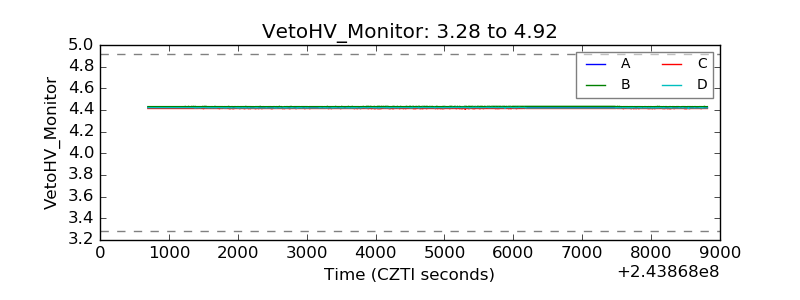 |
| Veto LLD | 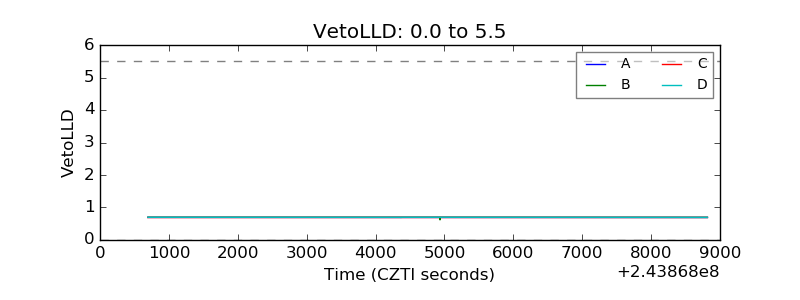 |
| Alpha Counter | 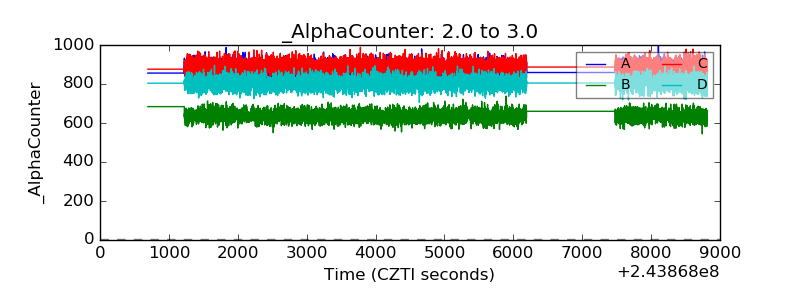 |
| _CPM_Rate | 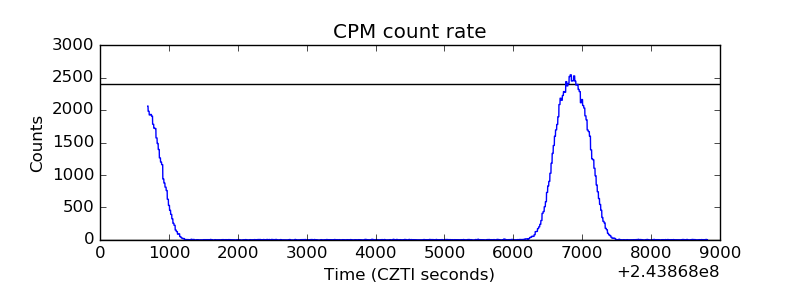 |
| CZT Counter |  |
| +2.5 Volts monitor |  |
| +5 Volts monitor | 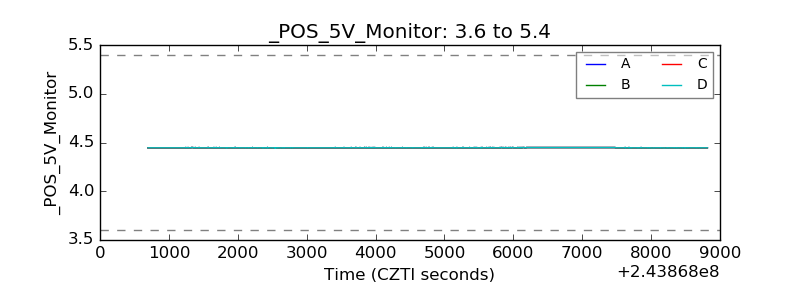 |
| _ROLL_ROT | 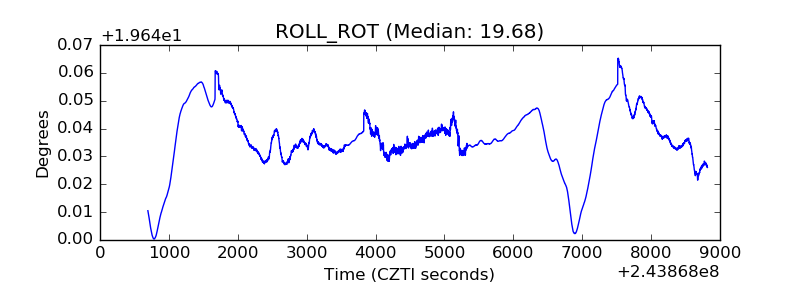 |
| _Roll_DEC | 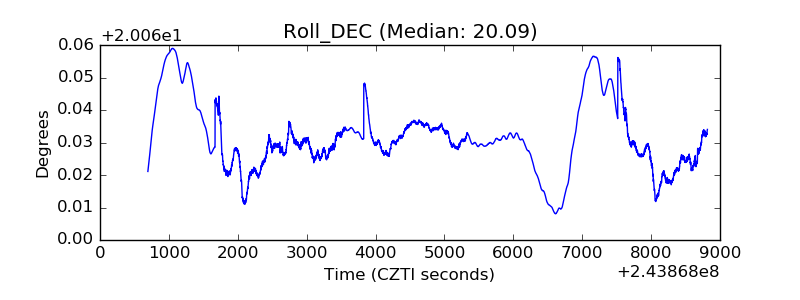 |
| _Roll_RA | 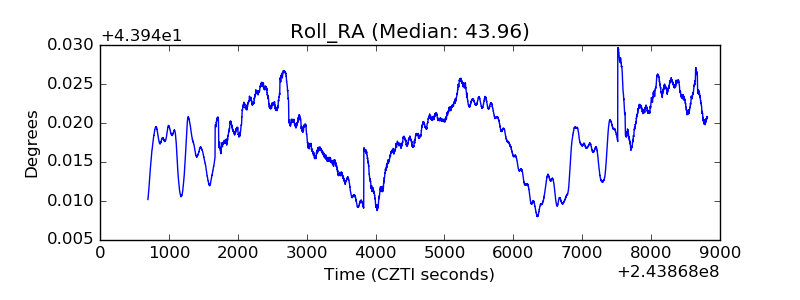 |
| Veto Counter | 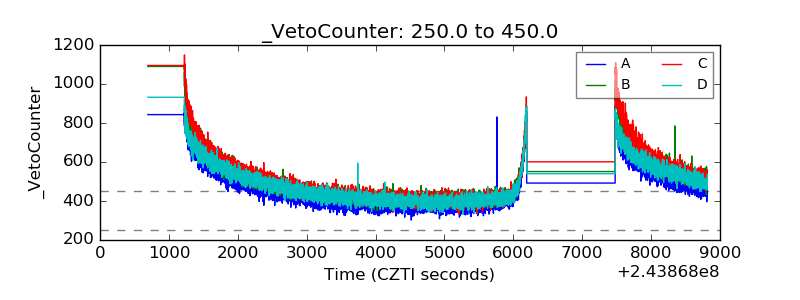 |