| Param | Original file | Final file |
|---|---|---|
| Filename | modeM0/AS1G07_051T01_9000001550cztM0_level2.fits | modeM0/AS1G07_051T01_9000001550cztM0_level2_quad_clean.evt |
| Size (bytes) | 456,131,520 | 434,151,360 |
| Size | 435.0 MB | 414.0 MB |
| Events in quadrant A | 2,750,774 | 2,583,285 |
| Events in quadrant B | 2,593,046 | 2,489,984 |
| Events in quadrant C | 2,738,170 | 2,508,319 |
| Events in quadrant D | 2,299,510 | 2,136,075 |
| Mode SS | |||
|---|---|---|---|
| Quadrant | BADHDUFLAG | Total packets | Discarded packets |
| A | 0 | 1020 | 0 |
| B | 0 | 1020 | 0 |
| C | 0 | 1020 | 0 |
| D | 0 | 1020 | 0 |
| Mode M9 | |||
|---|---|---|---|
| Quadrant | BADHDUFLAG | Total packets | Discarded packets |
| A | 0 | 60 | 0 |
| B | 0 | 60 | 0 |
| C | 0 | 60 | 0 |
| D | 0 | 60 | 0 |
| Mode M0 | |||
|---|---|---|---|
| Quadrant | BADHDUFLAG | Total packets | Discarded packets |
| A | 0 | 105702 | 0 |
| B | 0 | 141848 | 0 |
| C | 0 | 102372 | 0 |
| D | 0 | 142228 | 0 |
| Quadrant | Total seconds | Saturated seconds | Saturation percentage |
|---|---|---|---|
| A | 49980 | 618 | 1.236495% |
| B | 49979 | 3601 | 7.205026% |
| C | 49978 | 315 | 0.630277% |
| D | 49979 | 3214 | 6.430701% |
Noise dominated data is calculated using 1-second bins in cleaned event files. If a bin has >2000 counts, and if more than 50% of those come from <1% of pixels, then it is considered to be noise-dominated and hence unusable.
| Quadrant | # 1 sec bins | Bins with >0 counts | Bins with >2000 counts | High rate bins dominated by noise | Noise dominated (total time) | Noise dominated (detector-on time) | Marked lightcurve |
|---|---|---|---|---|---|---|---|
| A | 56011 | 49978 | 0 | 0 | 0.00% | 0.00% |  |
| B | 56011 | 49979 | 0 | 0 | 0.00% | 0.00% |  |
| C | 56011 | 49981 | 0 | 0 | 0.00% | 0.00% | 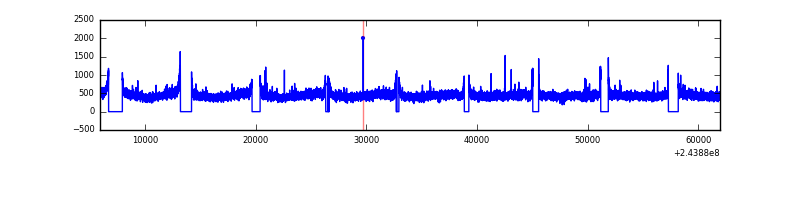 |
| D | 56011 | 49965 | 0 | 0 | 0.00% | 0.00% | 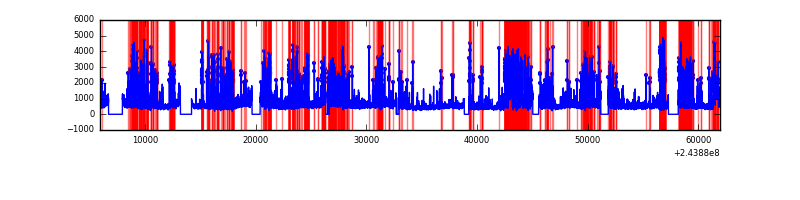 |
Top three noisy pixels from each quadrant. If the there are fewer than three noisy pixels in the level2.evt file, extra rows are filled as -1
| Pixel properties | Quadrant properties | ||||||
|---|---|---|---|---|---|---|---|
| Quadrant | DetID | PixID | Counts | Sigma | Mean | Median | Sigma |
| A | 0 | 29 | 2559 | 10.37 | 716 | 665 | 182.6 |
| A | 7 | 110 | 2221 | 8.52 | 716 | 665 | 182.6 |
| A | 9 | 19 | 2119 | 7.96 | 716 | 665 | 182.6 |
| B | 2 | 9 | 2252 | 11.6 | 683 | 647 | 138.3 |
| B | 3 | 17 | 1673 | 7.42 | 683 | 647 | 138.3 |
| B | 14 | 254 | 1664 | 7.35 | 683 | 647 | 138.3 |
| C | 1 | 80 | 2038 | 7.2 | 723 | 670 | 190.1 |
| C | 1 | 81 | 1932 | 6.64 | 723 | 670 | 190.1 |
| C | 12 | 241 | 1923 | 6.59 | 723 | 670 | 190.1 |
| D | 6 | 231 | 1695 | 6.21 | 655 | 593 | 177.3 |
| D | 3 | 14 | 1693 | 6.2 | 655 | 593 | 177.3 |
| D | 3 | 31 | 1682 | 6.14 | 655 | 593 | 177.3 |
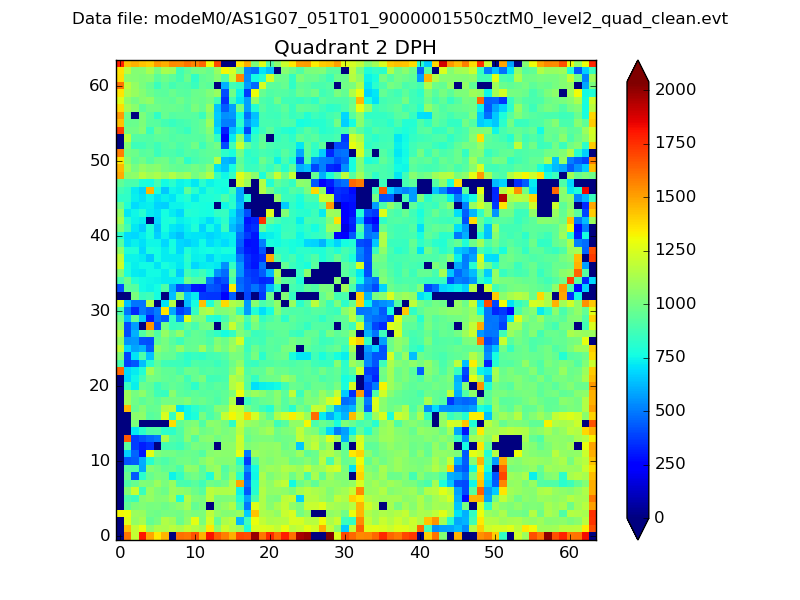
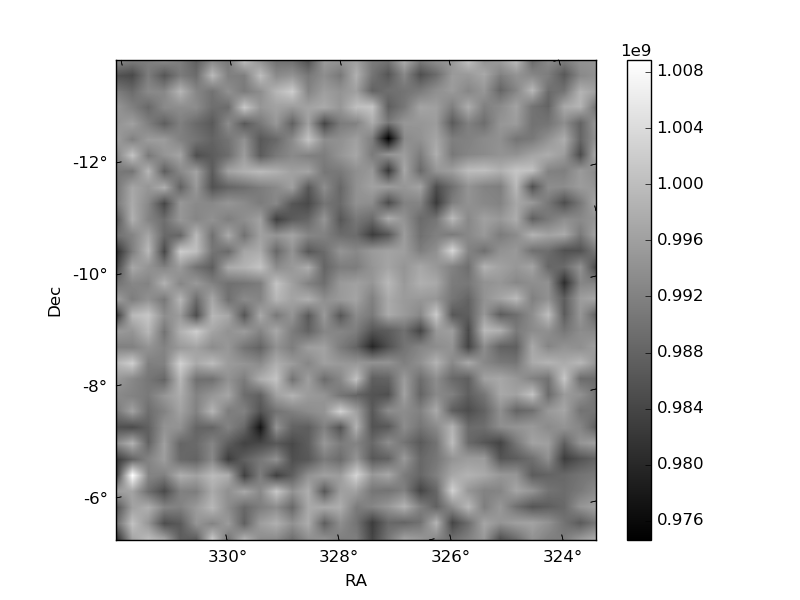
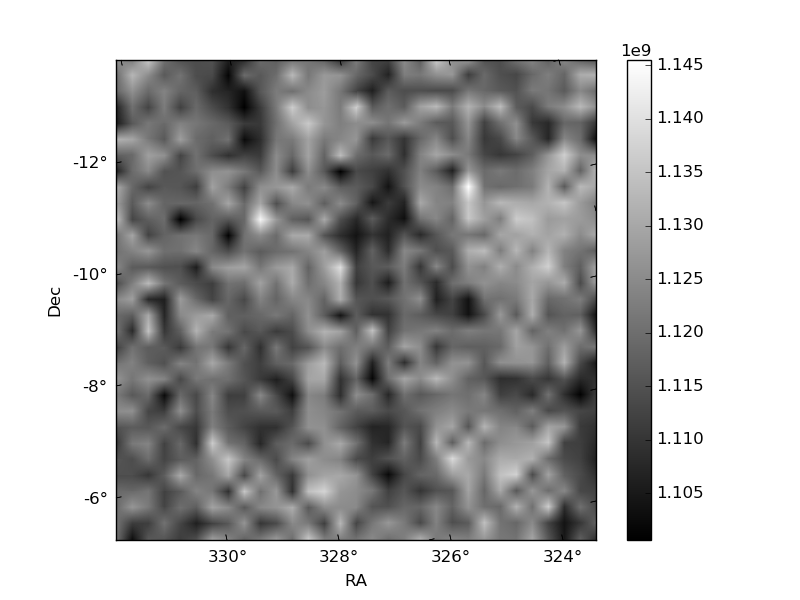
Histogram calculated using DETX and DETY for each event in the final _common_clean file
| Quadrant A | 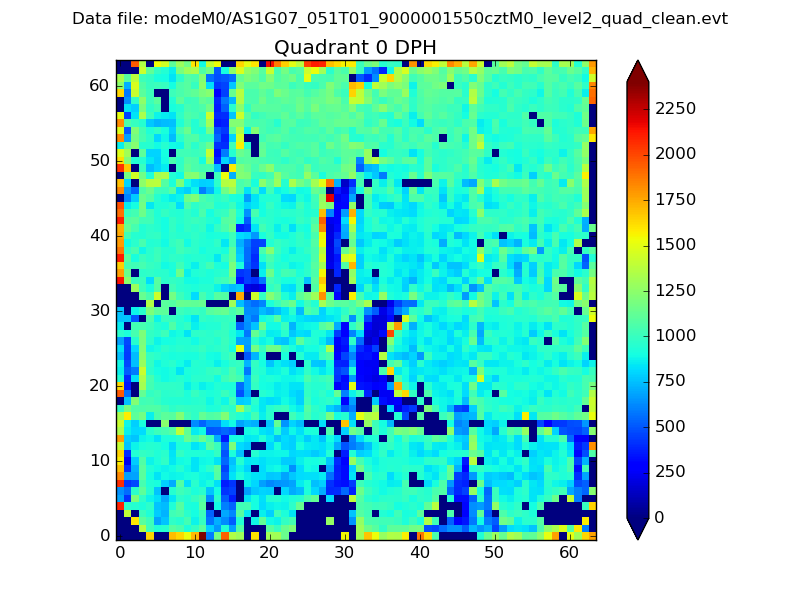 |
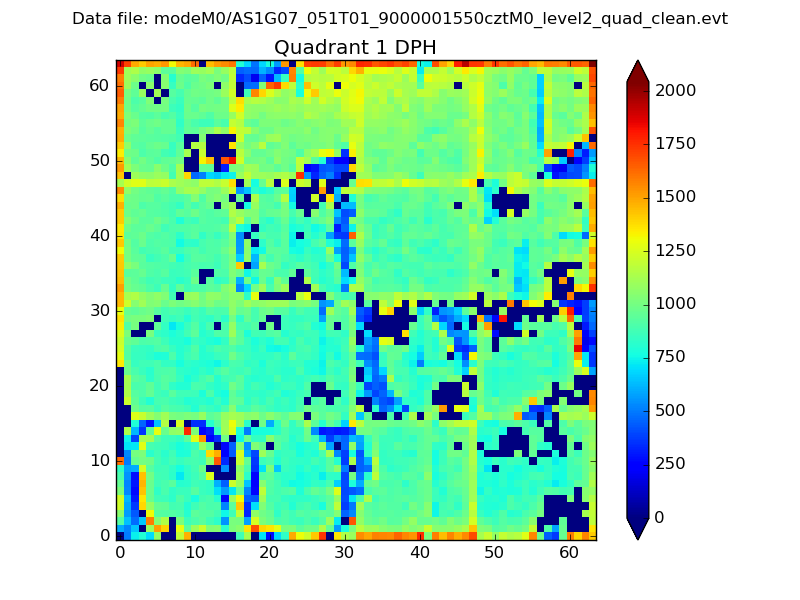 |
Quadrant B |
|---|---|---|---|
| Quadrant D | 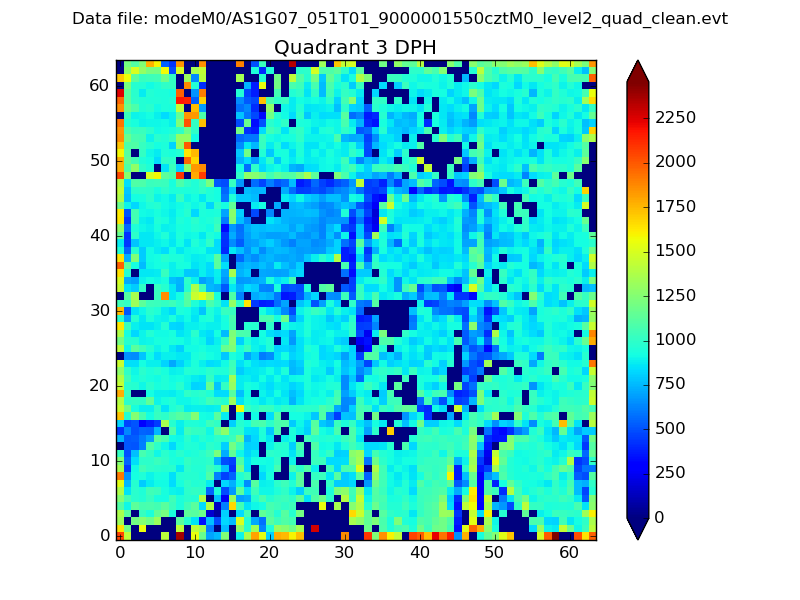 |
 |
Quadrant C |
| Plot type | Count rate plots | Images |
|---|---|---|
| Comparison with Poisson distribution Blue bars denote a histogram of data divided into 1 sec bins. Red curve is a Poisson curve with rate = median count rate of data. |
 |
 |
| Quadrant-wise count rates Data is divided into 100 sec bins |
 |
|
| Module-wise count rates for Quadrant A Data is divided into 100 sec bins |
 |
 |
| Module-wise count rates for Quadrant B Data is divided into 100 sec bins |
 |
 |
| Module-wise count rates for Quadrant C Data is divided into 100 sec bins |
 |
 |
| Module-wise count rates for Quadrant D Data is divided into 100 sec bins |
 |
 |
| Parameter | Plot |
|---|---|
| CZT HV Monitor |  |
| D_VDD |  |
| Temperature 1 |  |
| Veto HV Monitor |  |
| Veto LLD | 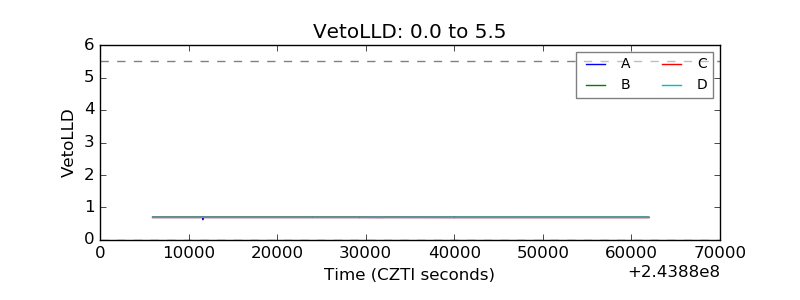 |
| Alpha Counter |  |
| _CPM_Rate | 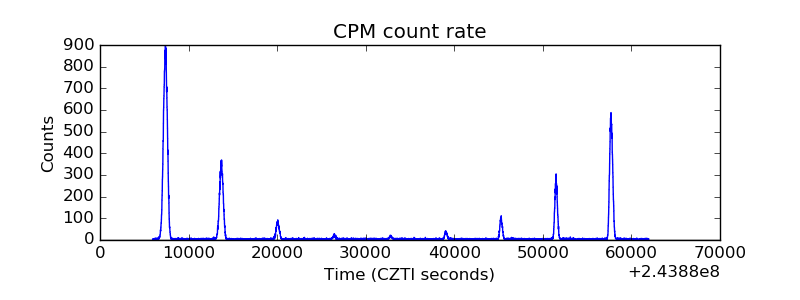 |
| CZT Counter | 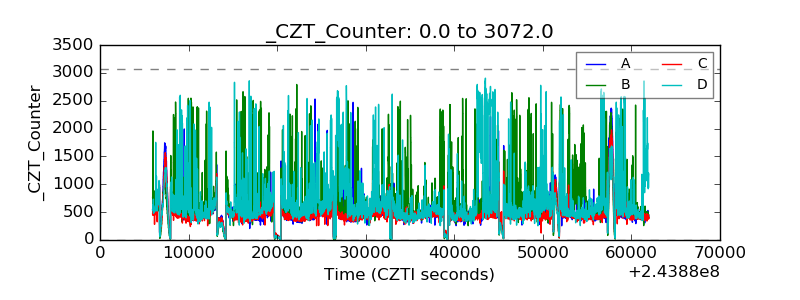 |
| +2.5 Volts monitor |  |
| +5 Volts monitor |  |
| _ROLL_ROT |  |
| _Roll_DEC |  |
| _Roll_RA |  |
| Veto Counter | 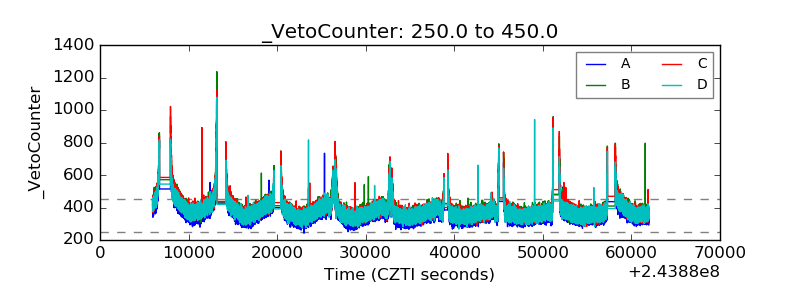 |