| Param | Original file | Final file |
|---|---|---|
| Filename | modeM0/AS1G07_051T01_9000001550_10755cztM0_level2.evt | modeM0/AS1G07_051T01_9000001550_10755cztM0_level2_quad_clean.evt |
| Size (bytes) | 199,523,520 | 32,302,080 |
| Size | 190.3 MB | 30.8 MB |
| Events in quadrant A | 1,267,022 | 207,733 |
| Events in quadrant B | 1,788,341 | 202,802 |
| Events in quadrant C | 1,185,113 | 208,410 |
| Events in quadrant D | 1,645,184 | 194,246 |
| Mode SS | |||
|---|---|---|---|
| Quadrant | BADHDUFLAG | Total packets | Discarded packets |
| A | 0 | 48 | 0 |
| B | 0 | 48 | 0 |
| C | 0 | 48 | 0 |
| D | 0 | 48 | 0 |
| Mode M9 | |||
|---|---|---|---|
| Quadrant | BADHDUFLAG | Total packets | Discarded packets |
| A | 0 | 12 | 0 |
| B | 0 | 12 | 0 |
| C | 0 | 12 | 0 |
| D | 0 | 12 | 0 |
| Mode M0 | |||
|---|---|---|---|
| Quadrant | BADHDUFLAG | Total packets | Discarded packets |
| A | 0 | 5131 | 2 |
| B | 0 | 6870 | 1 |
| C | 0 | 4952 | 1 |
| D | 0 | 6414 | 1 |
| Quadrant | Total seconds | Saturated seconds | Saturation percentage |
|---|---|---|---|
| A | 2278 | 88 | 3.863038% |
| B | 2278 | 246 | 10.798946% |
| C | 2278 | 38 | 1.668130% |
| D | 2278 | 121 | 5.311677% |
Noise dominated data is calculated using 1-second bins in cleaned event files. If a bin has >2000 counts, and if more than 50% of those come from <1% of pixels, then it is considered to be noise-dominated and hence unusable.
| Quadrant | # 1 sec bins | Bins with >0 counts | Bins with >2000 counts | High rate bins dominated by noise | Noise dominated (total time) | Noise dominated (detector-on time) | Marked lightcurve |
|---|---|---|---|---|---|---|---|
| A | 3528 | 2279 | 3 | 3 | 0.09% | 0.13% | 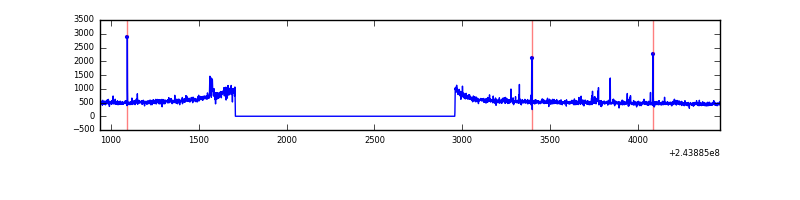 |
| B | 3528 | 2279 | 82 | 82 | 2.32% | 3.60% | 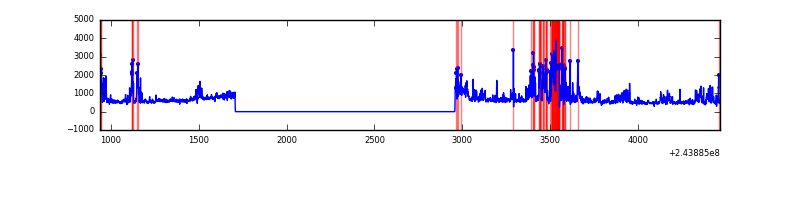 |
| C | 3528 | 2279 | 0 | 0 | 0.00% | 0.00% | 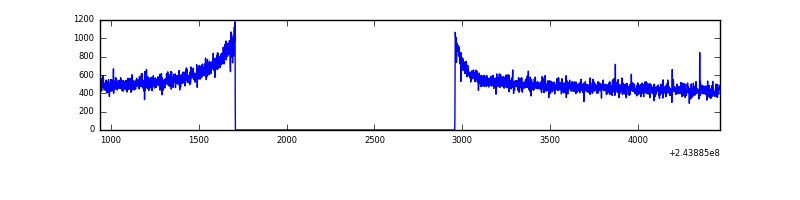 |
| D | 3528 | 2279 | 56 | 56 | 1.59% | 2.46% | 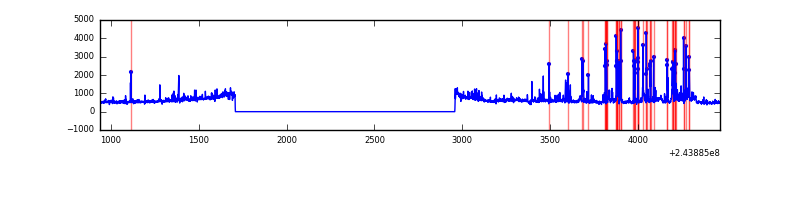 |
Top three noisy pixels from each quadrant. If the there are fewer than three noisy pixels in the level2.evt file, extra rows are filled as -1
| Pixel properties | Quadrant properties | ||||||
|---|---|---|---|---|---|---|---|
| Quadrant | DetID | PixID | Counts | Sigma | Mean | Median | Sigma |
| A | 15 | 223 | 16536 | 248.6 | 315 | 307 | 65.3 |
| A | 15 | 174 | 13511 | 202.26 | 315 | 307 | 65.3 |
| A | 15 | 239 | 5750 | 83.38 | 315 | 307 | 65.3 |
| B | 0 | 85 | 254912 | 4173.56 | 306 | 299 | 61.0 |
| B | 4 | 239 | 245378 | 4017.28 | 306 | 299 | 61.0 |
| B | 4 | 81 | 41445 | 674.46 | 306 | 299 | 61.0 |
| C | 13 | 61 | 2258 | 27.41 | 303 | 304 | 71.3 |
| C | 14 | 234 | 1221 | 12.86 | 303 | 304 | 71.3 |
| C | 3 | 202 | 779 | 6.66 | 303 | 304 | 71.3 |
| D | 10 | 157 | 262146 | 3584.42 | 300 | 291 | 73.1 |
| D | 1 | 52 | 154784 | 2114.79 | 300 | 291 | 73.1 |
| D | 5 | 222 | 52413 | 713.47 | 300 | 291 | 73.1 |
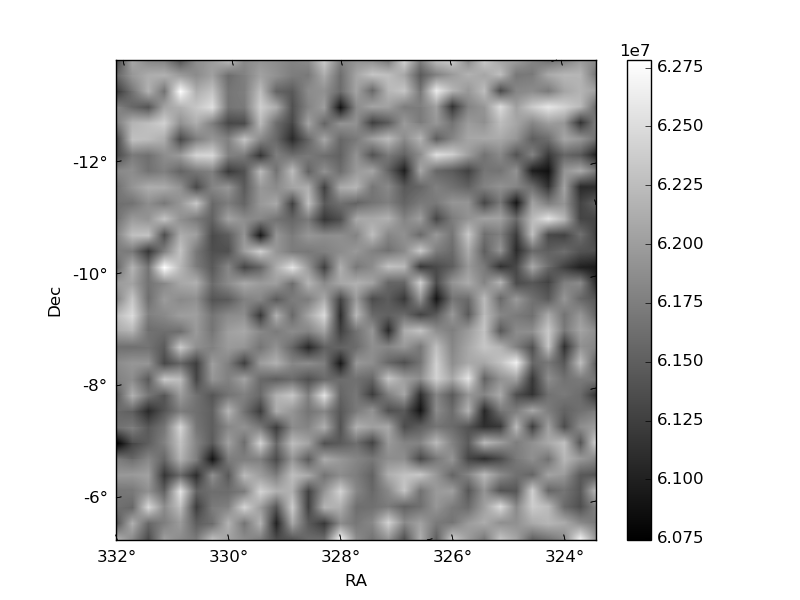
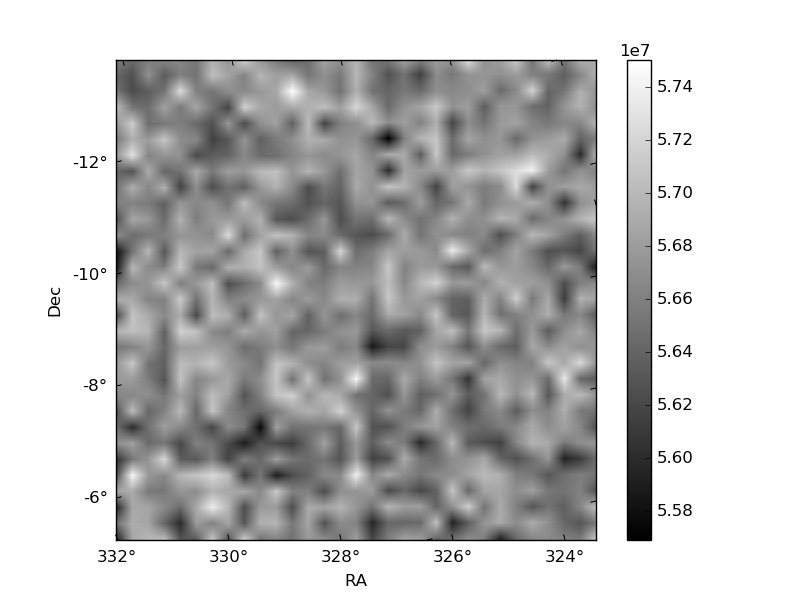
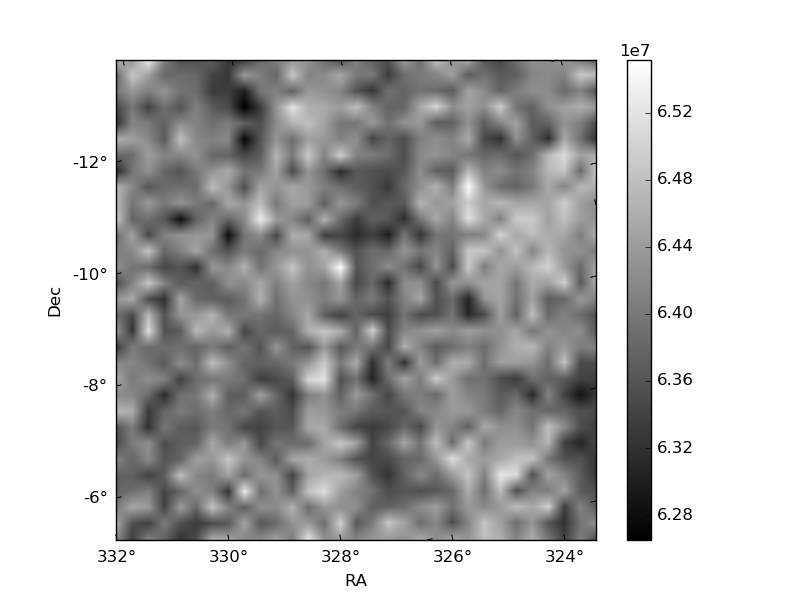
Histogram calculated using DETX and DETY for each event in the final _common_clean file
| Quadrant A | 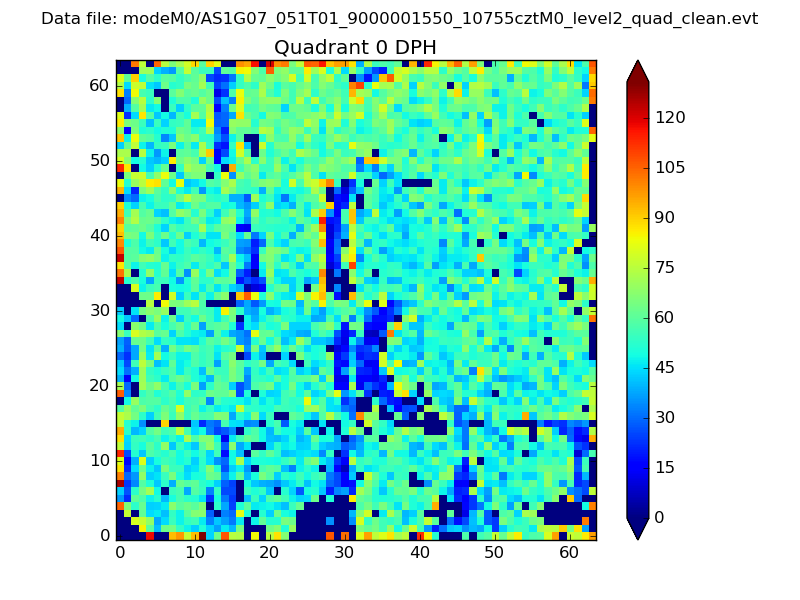 |
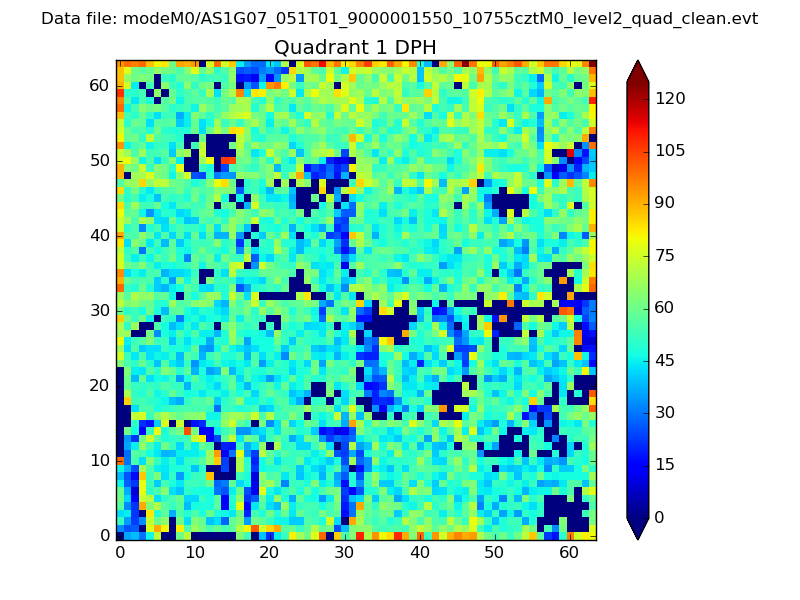 |
Quadrant B |
|---|---|---|---|
| Quadrant D | 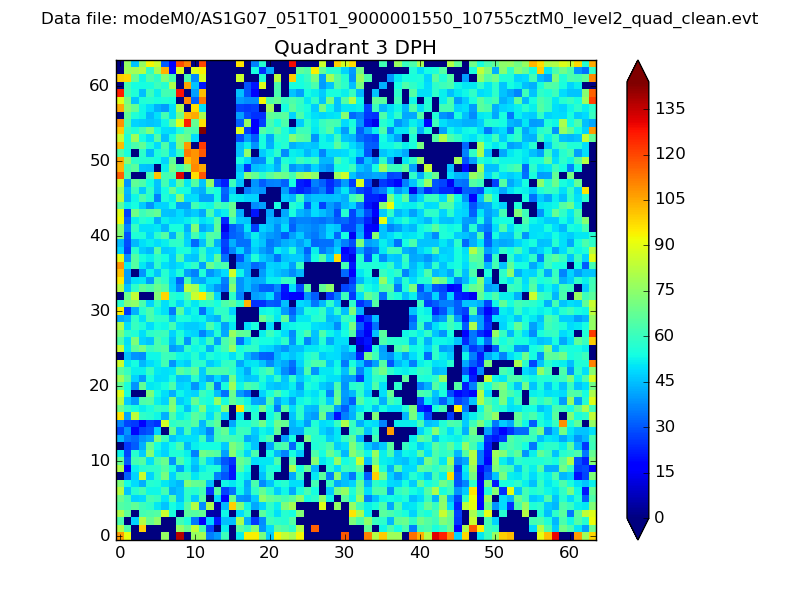 |
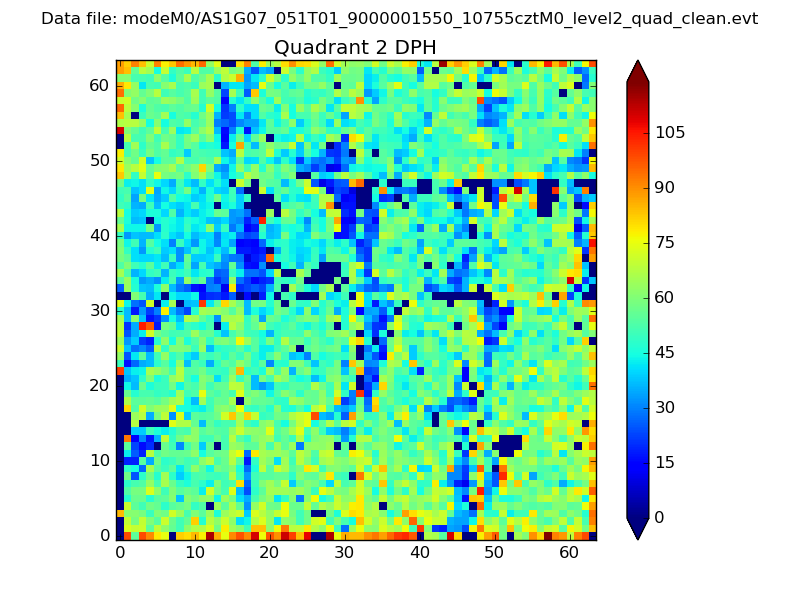 |
Quadrant C |
| Plot type | Count rate plots | Images |
|---|---|---|
| Comparison with Poisson distribution Blue bars denote a histogram of data divided into 1 sec bins. Red curve is a Poisson curve with rate = median count rate of data. |
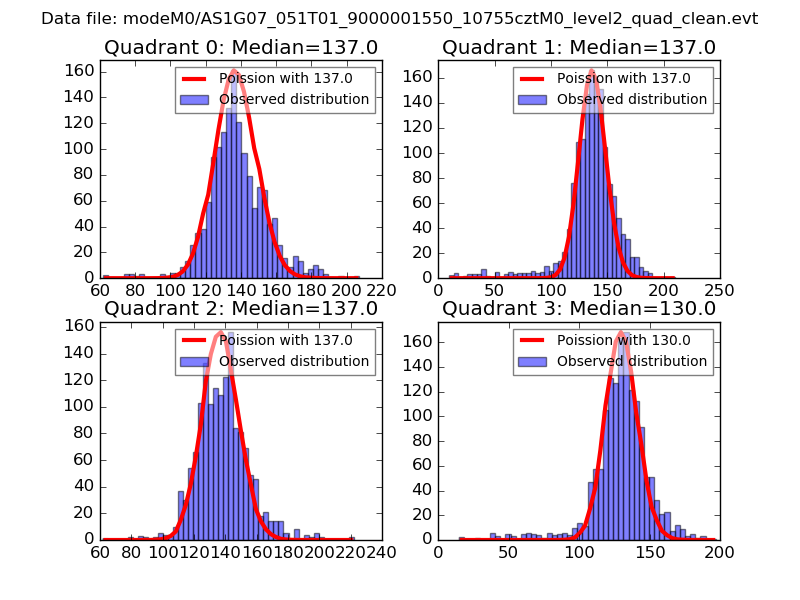 |
 |
| Quadrant-wise count rates Data is divided into 100 sec bins |
 |
|
| Module-wise count rates for Quadrant A Data is divided into 100 sec bins |
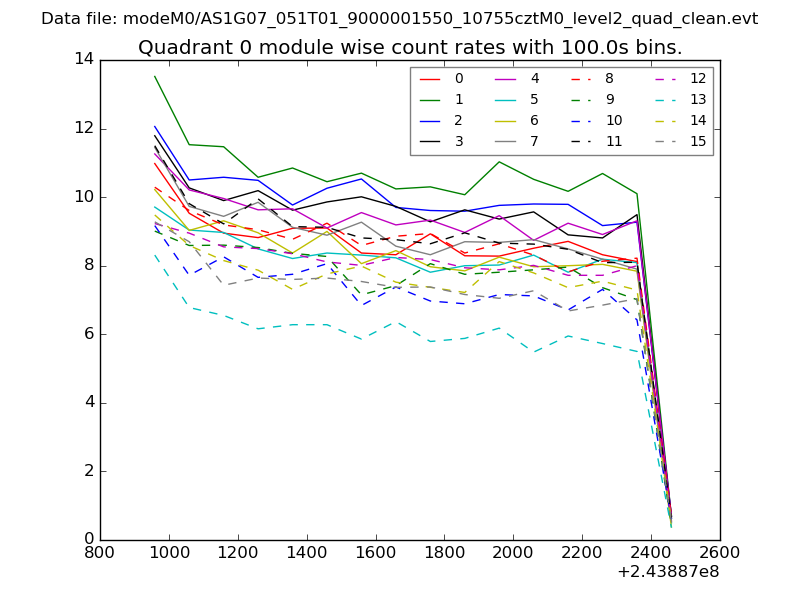 |
 |
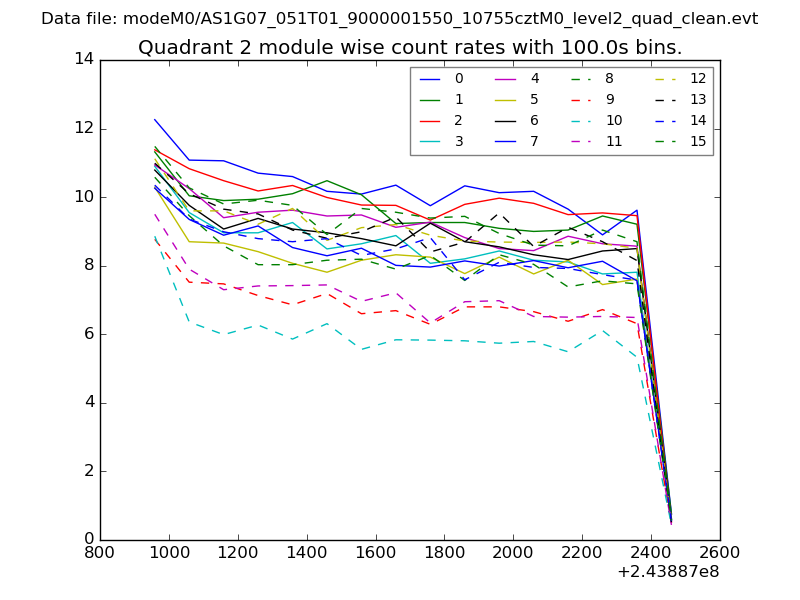
| Module-wise count rates for Quadrant B Data is divided into 100 sec bins |
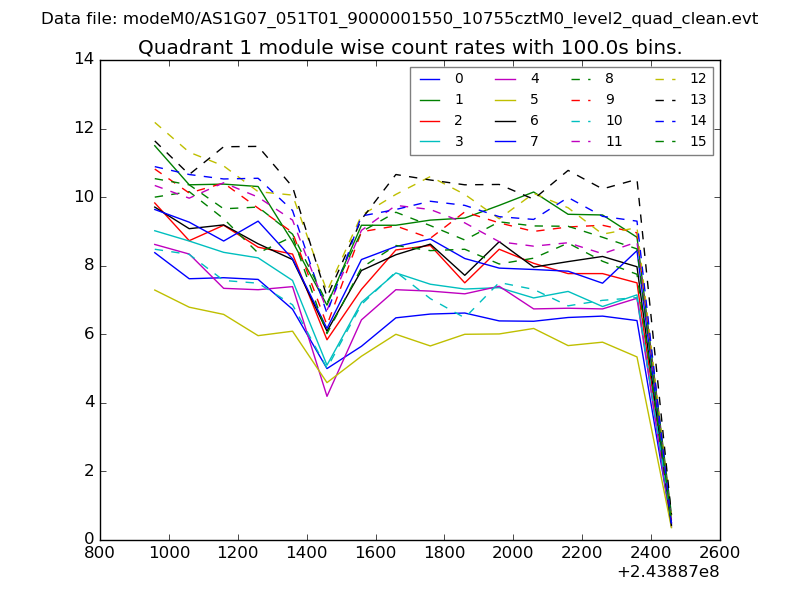 |
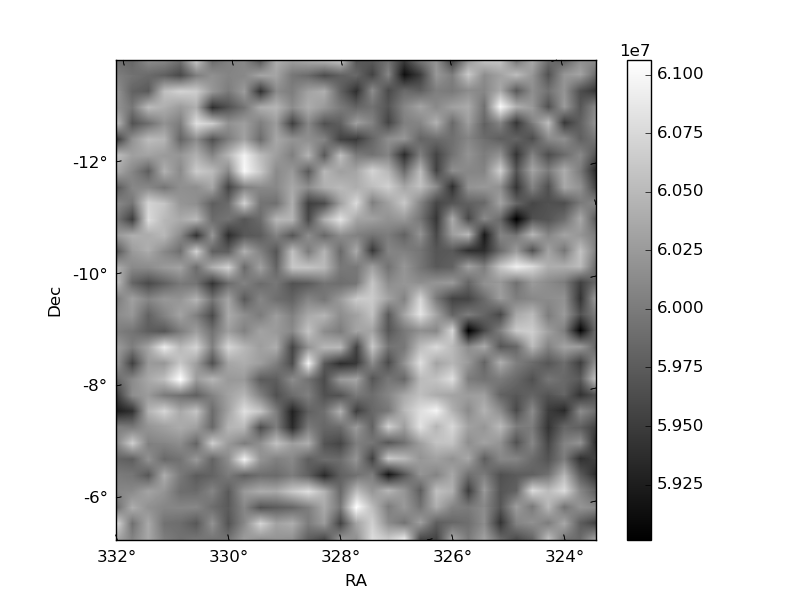 |
| Module-wise count rates for Quadrant C Data is divided into 100 sec bins |
 |
 |
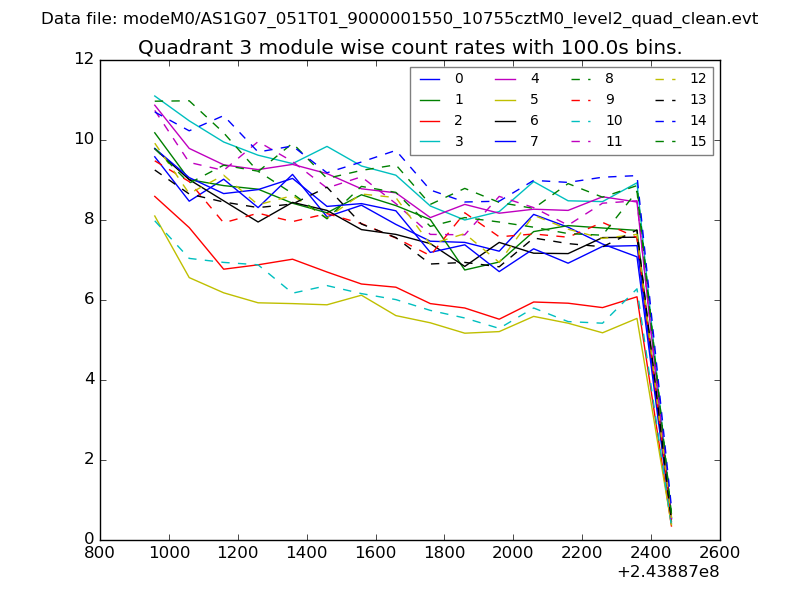
| Module-wise count rates for Quadrant D Data is divided into 100 sec bins |
 |
 |
| Parameter | Plot |
|---|---|
| CZT HV Monitor | 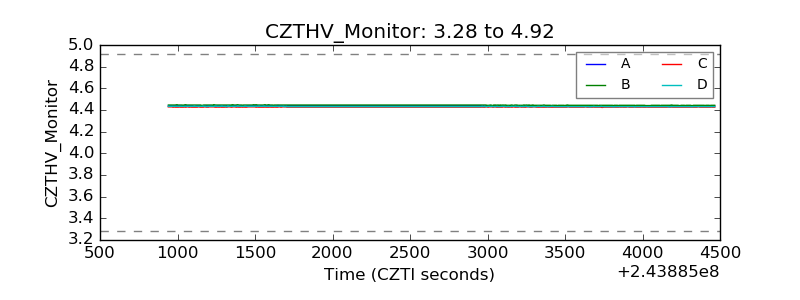 |
| D_VDD | 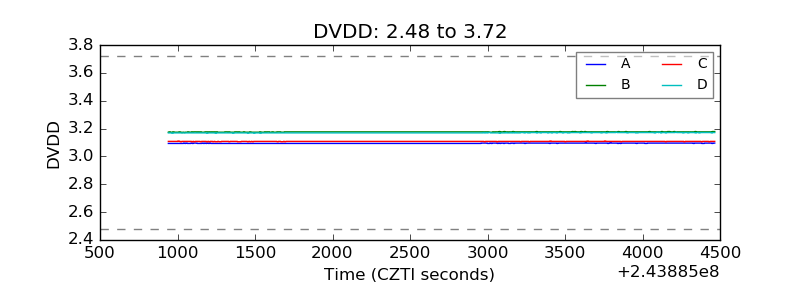 |
| Temperature 1 | 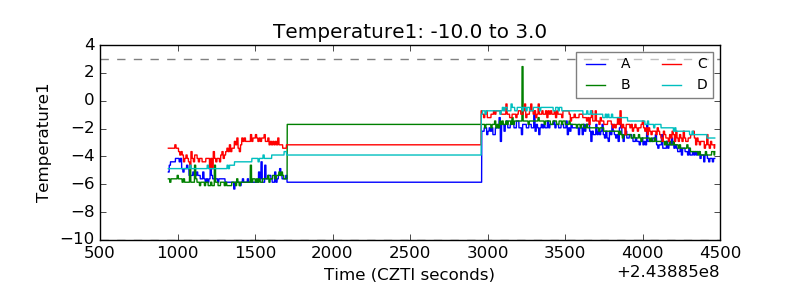 |
| Veto HV Monitor | 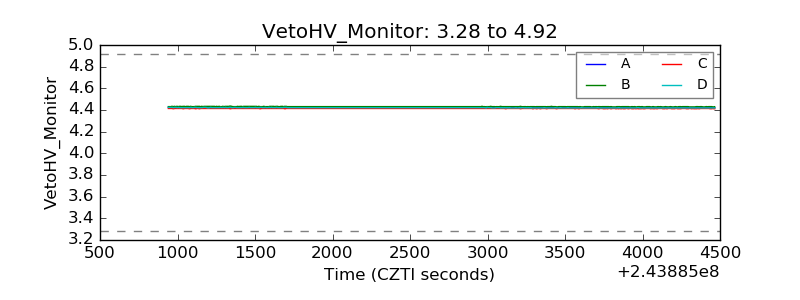 |
| Veto LLD | 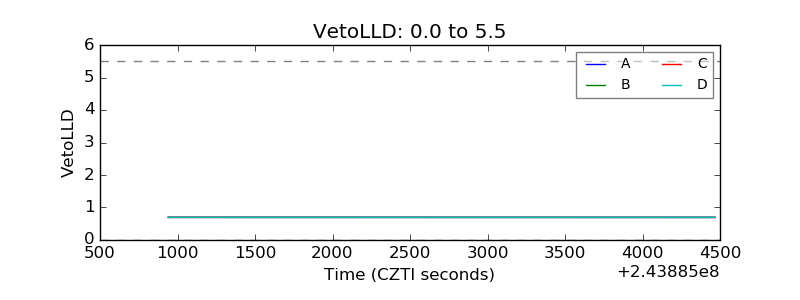 |
| Alpha Counter | 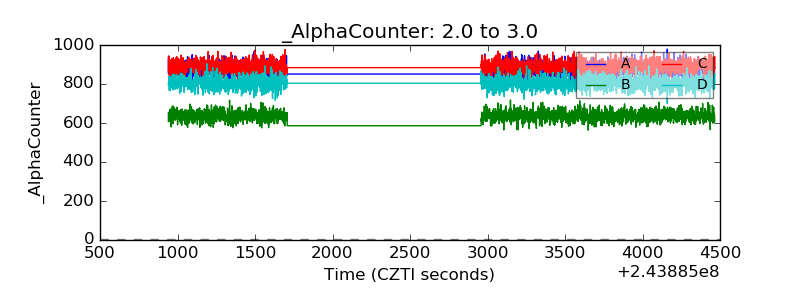 |
| _CPM_Rate | 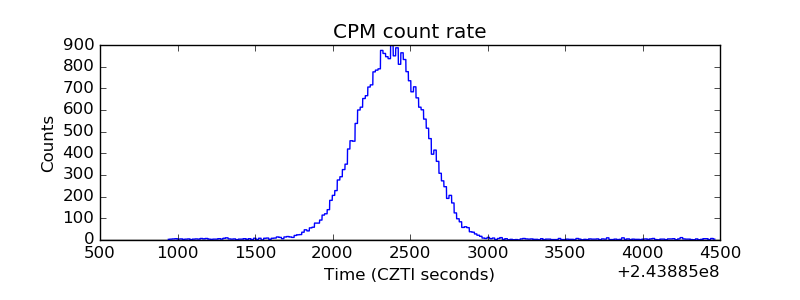 |
| CZT Counter |  |
| +2.5 Volts monitor |  |
| +5 Volts monitor |  |
| _ROLL_ROT | 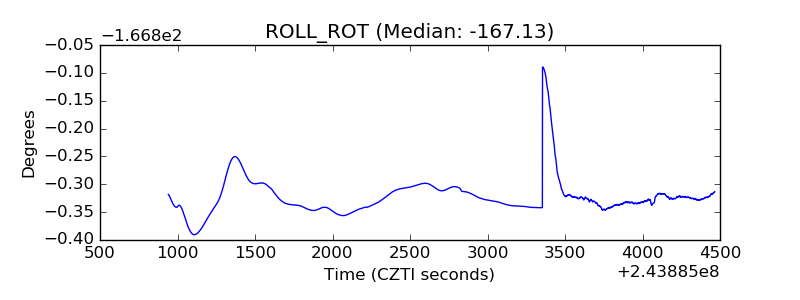 |
| _Roll_DEC | 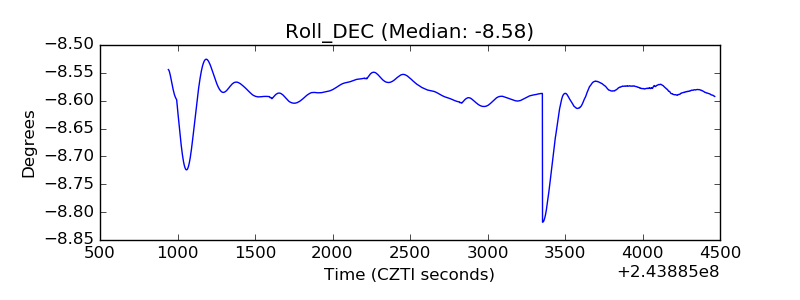 |
| _Roll_RA |  |
| Veto Counter | 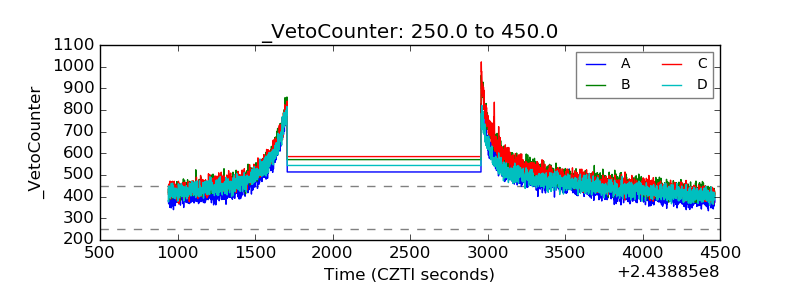 |