| Param | Original file | Final file |
|---|---|---|
| Filename | modeM0/AS1G07_051T01_9000001550_10758cztM0_level2.evt | modeM0/AS1G07_051T01_9000001550_10758cztM0_level2_quad_clean.evt |
| Size (bytes) | 632,848,320 | 102,173,760 |
| Size | 603.5 MB | 97.4 MB |
| Events in quadrant A | 3,721,800 | 655,063 |
| Events in quadrant B | 4,853,446 | 652,769 |
| Events in quadrant C | 3,437,774 | 659,455 |
| Events in quadrant D | 6,639,085 | 599,191 |
| Mode SS | |||
|---|---|---|---|
| Quadrant | BADHDUFLAG | Total packets | Discarded packets |
| A | 0 | 156 | 0 |
| B | 0 | 156 | 0 |
| C | 0 | 156 | 0 |
| D | 0 | 156 | 0 |
| Mode M9 | |||
|---|---|---|---|
| Quadrant | BADHDUFLAG | Total packets | Discarded packets |
| A | 0 | 11 | 0 |
| B | 0 | 11 | 0 |
| C | 0 | 11 | 0 |
| D | 0 | 11 | 0 |
| Mode M0 | |||
|---|---|---|---|
| Quadrant | BADHDUFLAG | Total packets | Discarded packets |
| A | 0 | 16307 | 3 |
| B | 0 | 19494 | 2 |
| C | 0 | 15644 | 2 |
| D | 0 | 24992 | 2 |
| Quadrant | Total seconds | Saturated seconds | Saturation percentage |
|---|---|---|---|
| A | 7589 | 104 | 1.370405% |
| B | 7589 | 336 | 4.427461% |
| C | 7589 | 41 | 0.540256% |
| D | 7589 | 703 | 9.263408% |
Noise dominated data is calculated using 1-second bins in cleaned event files. If a bin has >2000 counts, and if more than 50% of those come from <1% of pixels, then it is considered to be noise-dominated and hence unusable.
| Quadrant | # 1 sec bins | Bins with >0 counts | Bins with >2000 counts | High rate bins dominated by noise | Noise dominated (total time) | Noise dominated (detector-on time) | Marked lightcurve |
|---|---|---|---|---|---|---|---|
| A | 8599 | 7593 | 26 | 26 | 0.30% | 0.34% | 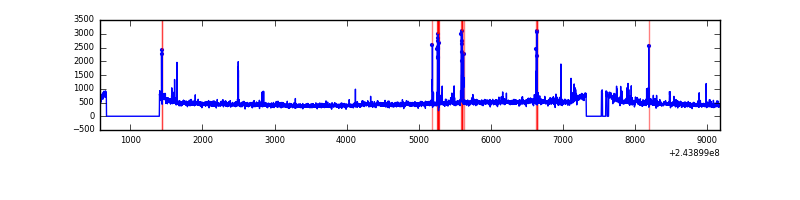 |
| B | 8599 | 7593 | 168 | 168 | 1.95% | 2.21% | 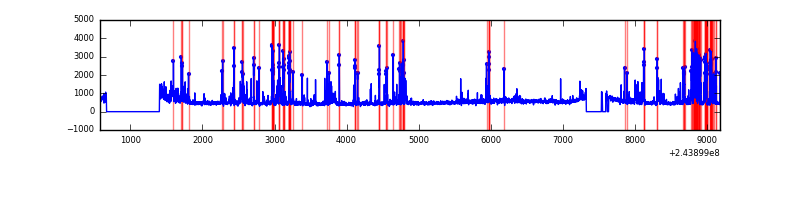 |
| C | 8599 | 7593 | 0 | 0 | 0.00% | 0.00% | 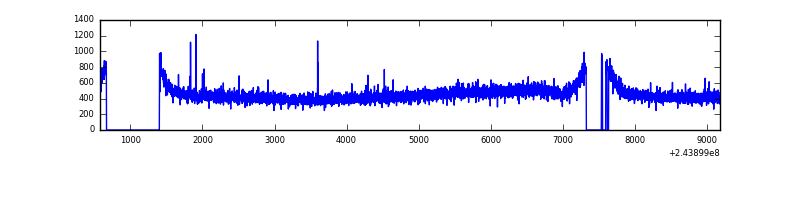 |
| D | 8599 | 7593 | 545 | 545 | 6.34% | 7.18% | 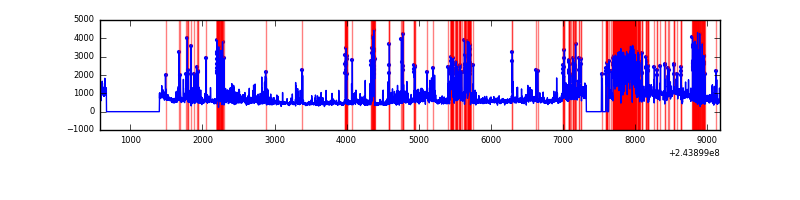 |
Top three noisy pixels from each quadrant. If the there are fewer than three noisy pixels in the level2.evt file, extra rows are filled as -1
| Pixel properties | Quadrant properties | ||||||
|---|---|---|---|---|---|---|---|
| Quadrant | DetID | PixID | Counts | Sigma | Mean | Median | Sigma |
| A | 15 | 223 | 59370 | 317.3 | 902 | 882 | 184.3 |
| A | 13 | 248 | 58969 | 315.13 | 902 | 882 | 184.3 |
| A | 15 | 239 | 46761 | 248.9 | 902 | 882 | 184.3 |
| B | 4 | 239 | 1065004 | 6161.06 | 901 | 879 | 172.7 |
| B | 0 | 214 | 79568 | 455.59 | 901 | 879 | 172.7 |
| B | 4 | 81 | 53159 | 302.69 | 901 | 879 | 172.7 |
| C | 13 | 61 | 6600 | 28.04 | 877 | 882 | 203.9 |
| C | 1 | 0 | 4944 | 19.92 | 877 | 882 | 203.9 |
| C | 8 | 128 | 3929 | 14.94 | 877 | 882 | 203.9 |
| D | 1 | 52 | 1959681 | 9600.2 | 843 | 818 | 204.0 |
| D | 5 | 222 | 798214 | 3907.96 | 843 | 818 | 204.0 |
| D | 8 | 195 | 539215 | 2638.63 | 843 | 818 | 204.0 |
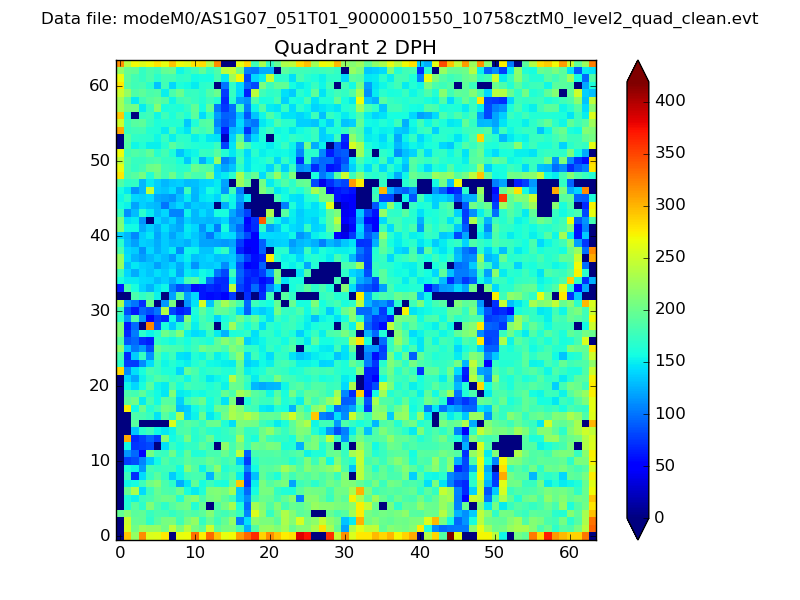
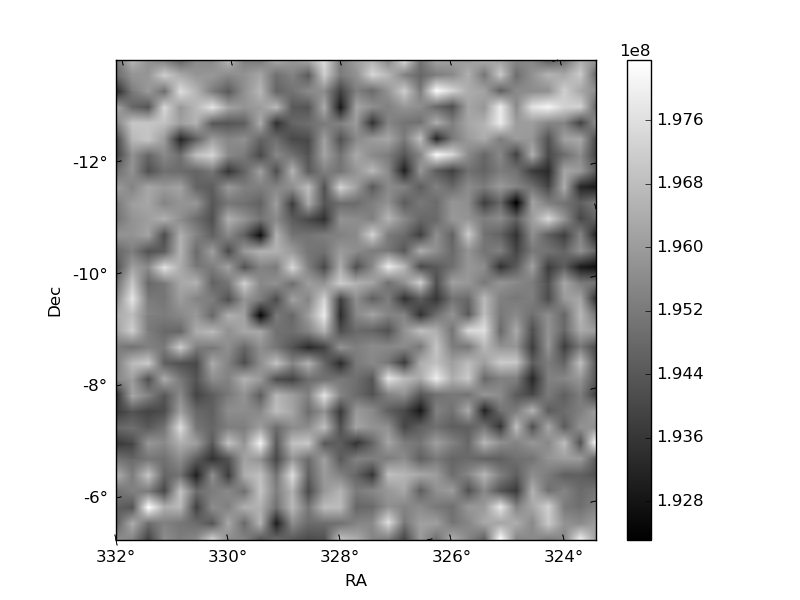
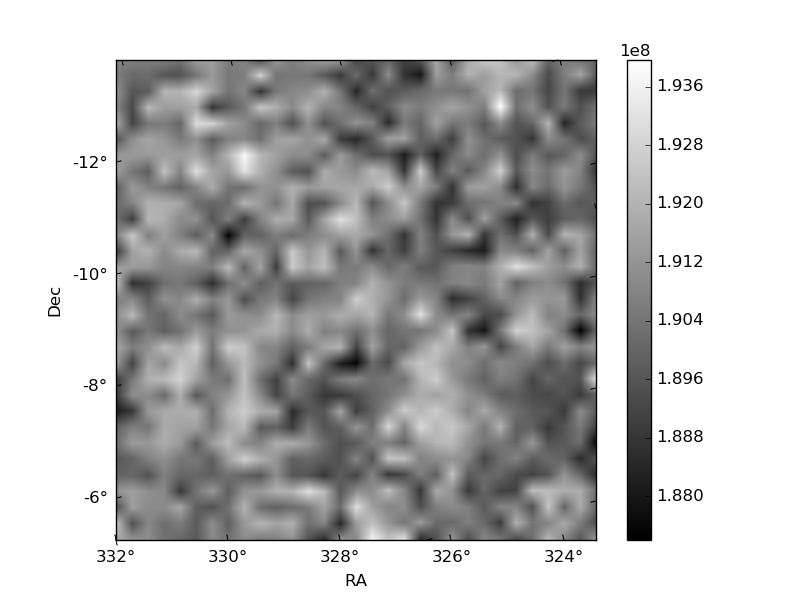
Histogram calculated using DETX and DETY for each event in the final _common_clean file
| Quadrant A | 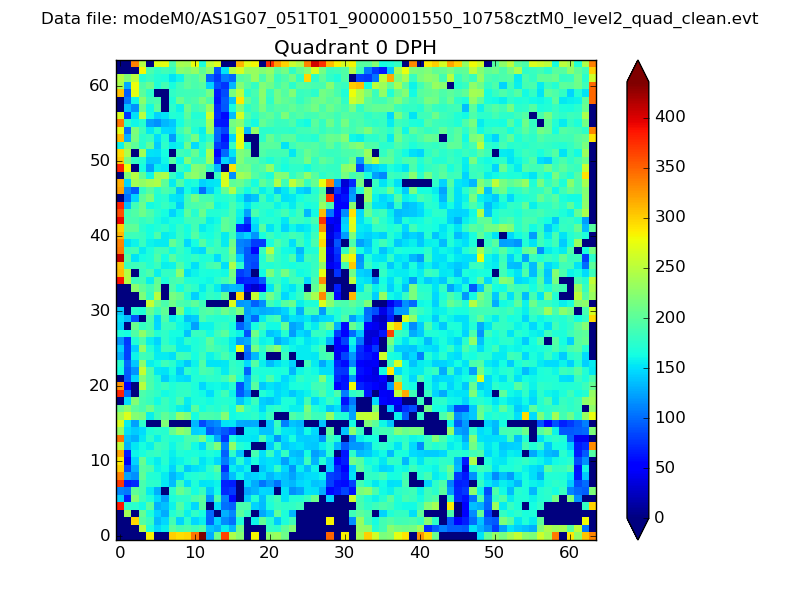 |
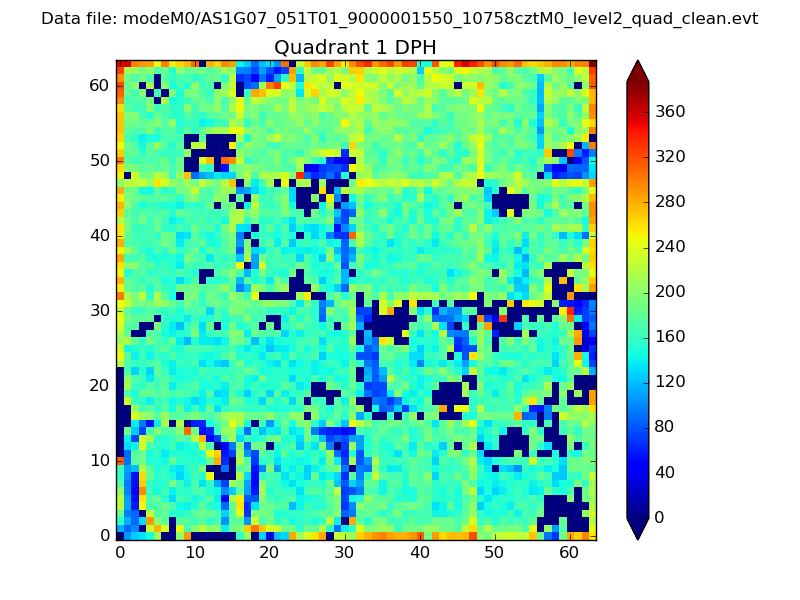 |
Quadrant B |
|---|---|---|---|
| Quadrant D | 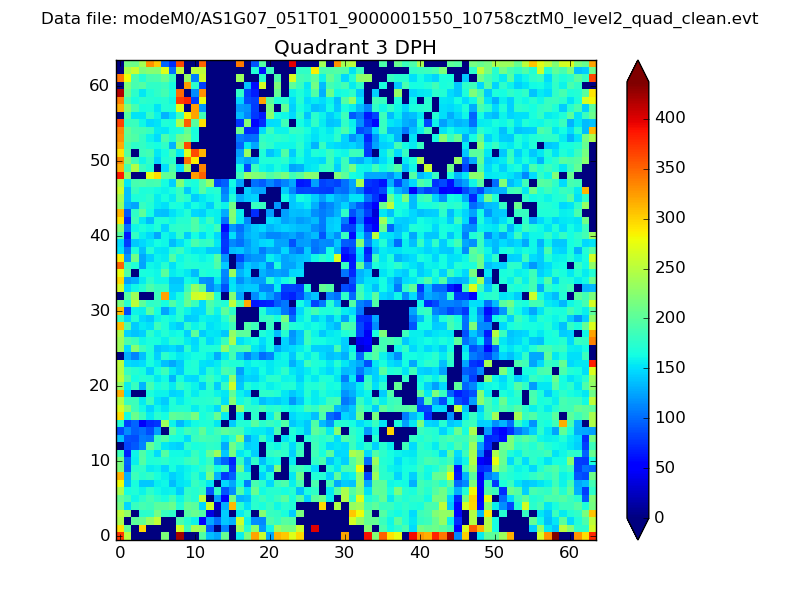 |
 |
Quadrant C |
| Plot type | Count rate plots | Images |
|---|---|---|
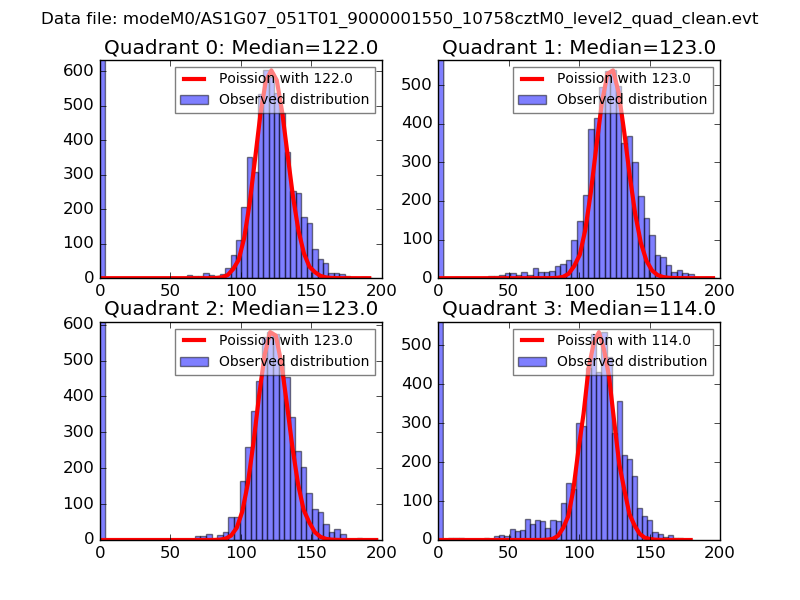
| Comparison with Poisson distribution Blue bars denote a histogram of data divided into 1 sec bins. Red curve is a Poisson curve with rate = median count rate of data. |
 |
 |
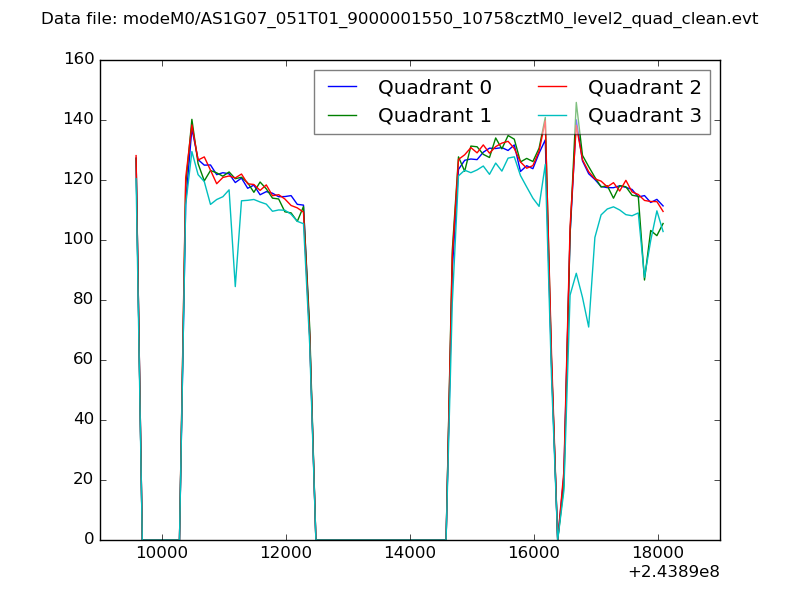
| Quadrant-wise count rates Data is divided into 100 sec bins |
 |
|
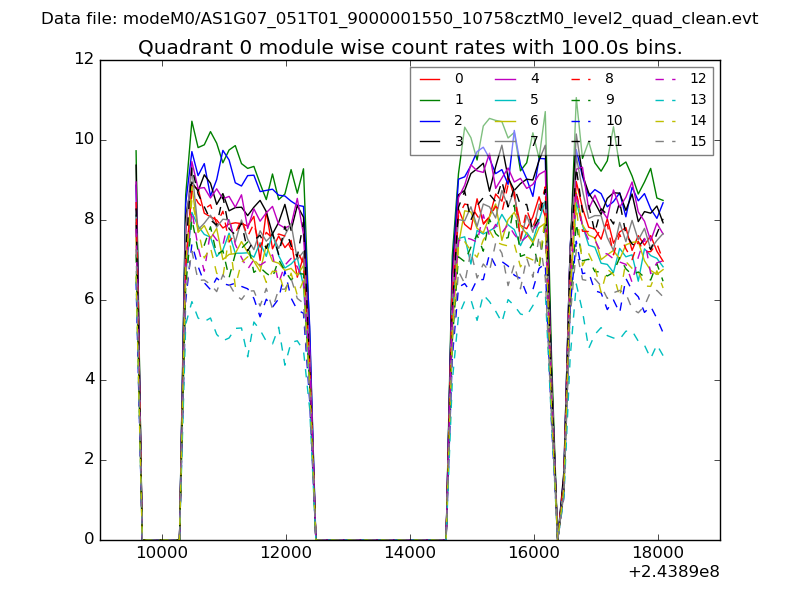
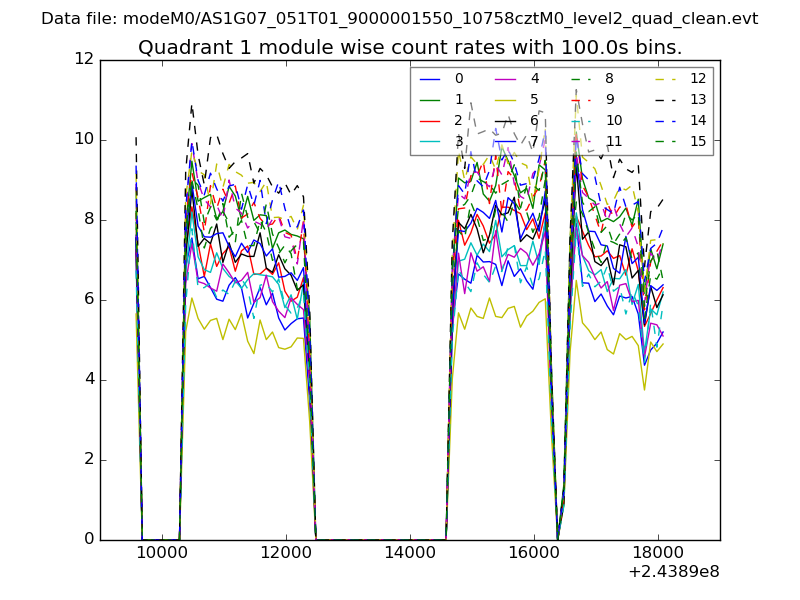
| Module-wise count rates for Quadrant A Data is divided into 100 sec bins |
 |
 |
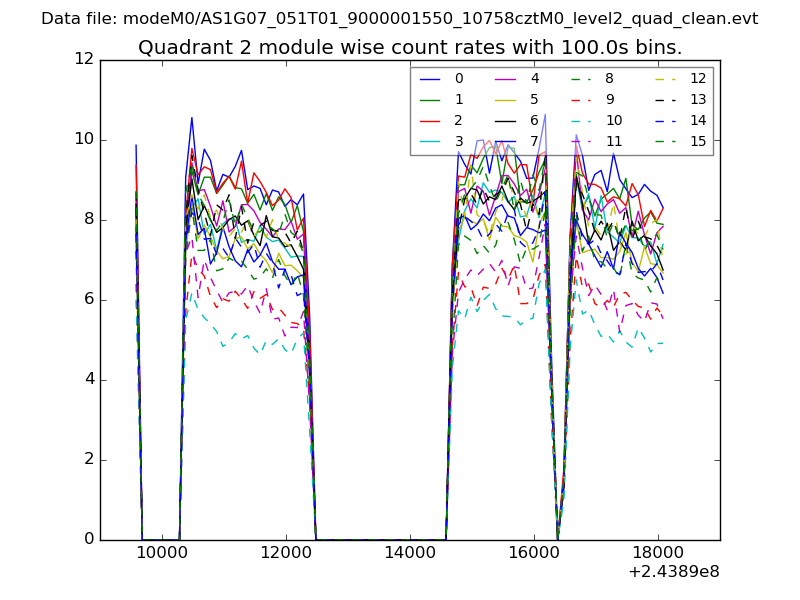
| Module-wise count rates for Quadrant B Data is divided into 100 sec bins |
 |
 |
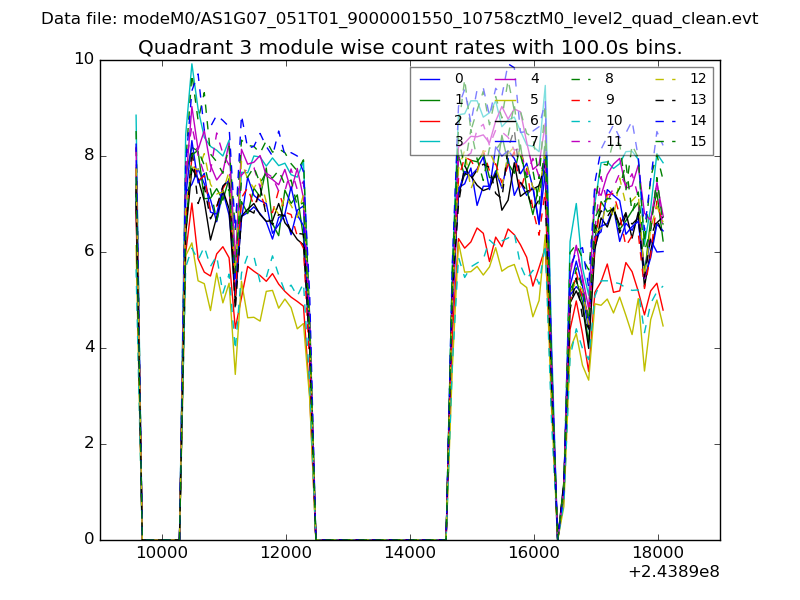
| Module-wise count rates for Quadrant C Data is divided into 100 sec bins |
 |
 |
| Module-wise count rates for Quadrant D Data is divided into 100 sec bins |
 |
 |
| Parameter | Plot |
|---|---|
| CZT HV Monitor | 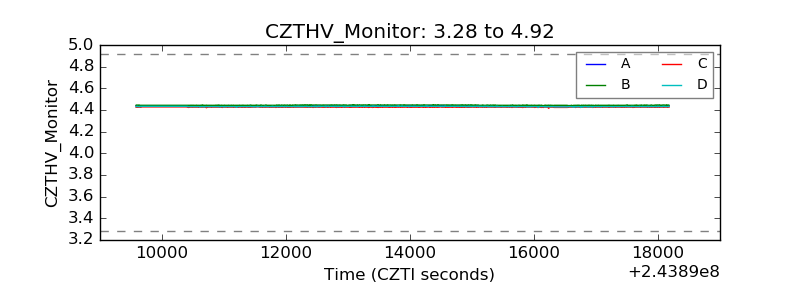 |
| D_VDD | 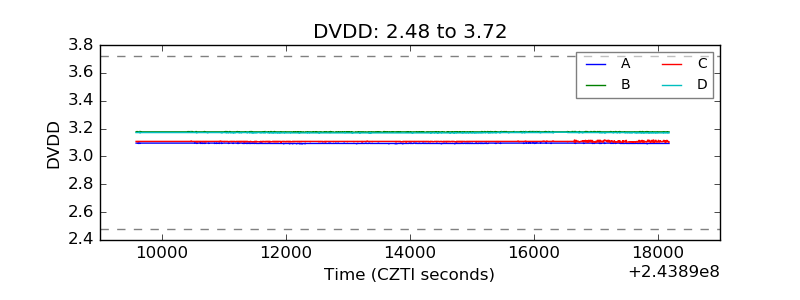 |
| Temperature 1 | 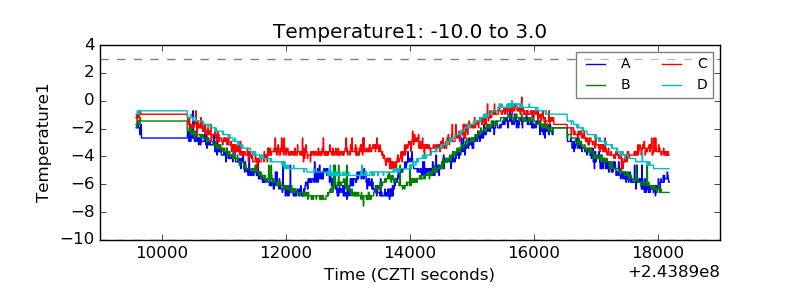 |
| Veto HV Monitor | 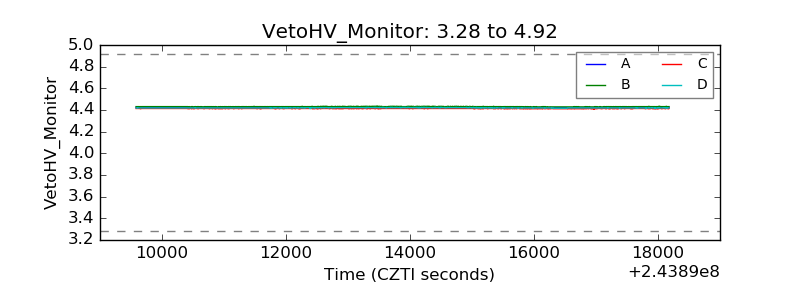 |
| Veto LLD | 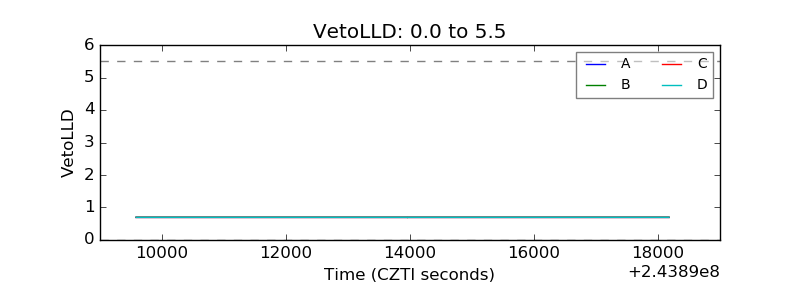 |
| Alpha Counter | 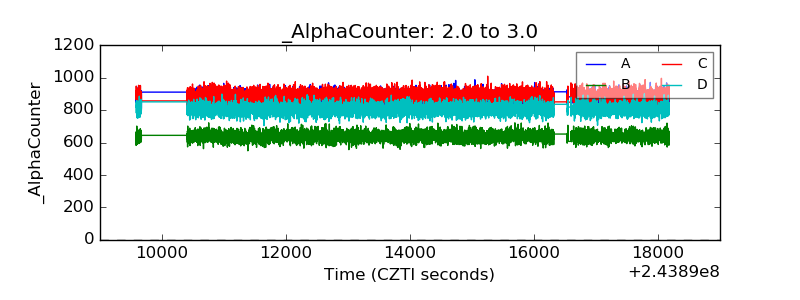 |
| _CPM_Rate | 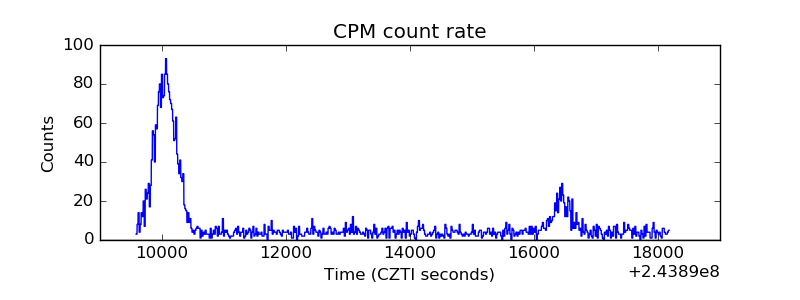 |
| CZT Counter | 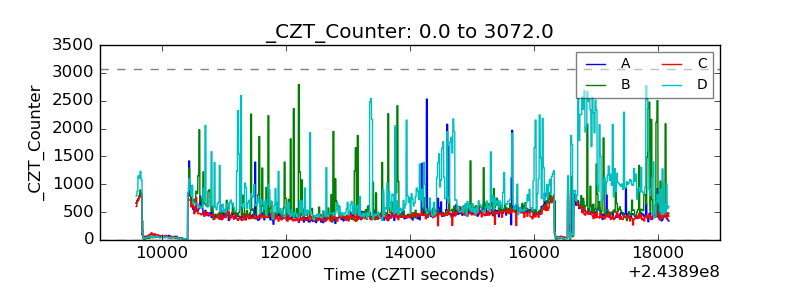 |
| +2.5 Volts monitor | 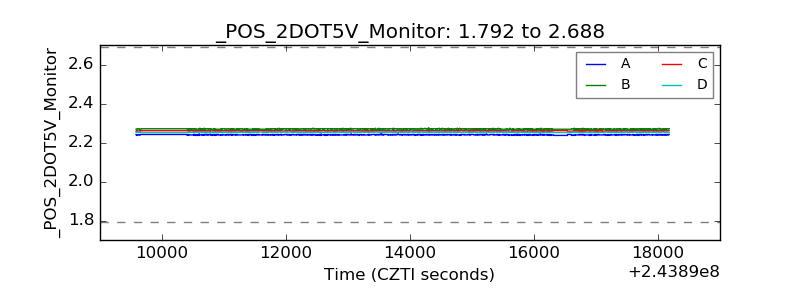 |
| +5 Volts monitor | 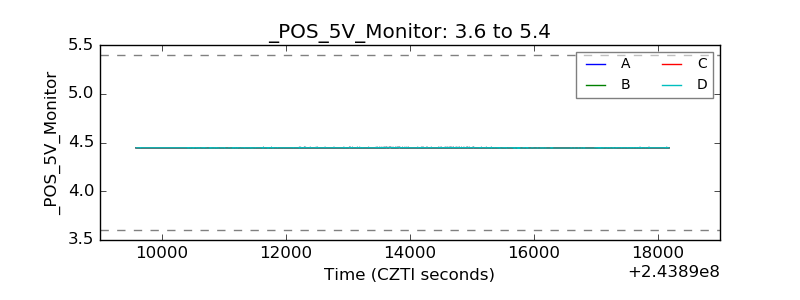 |
| _ROLL_ROT | 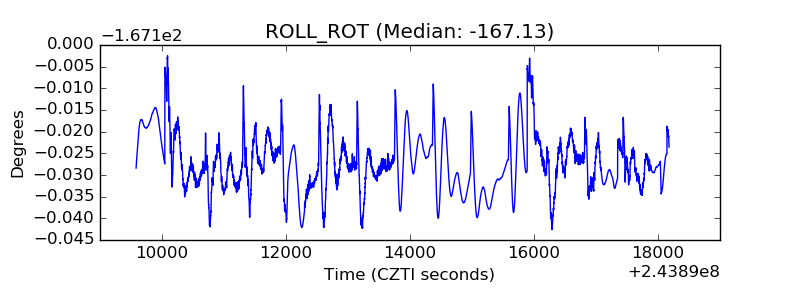 |
| _Roll_DEC | 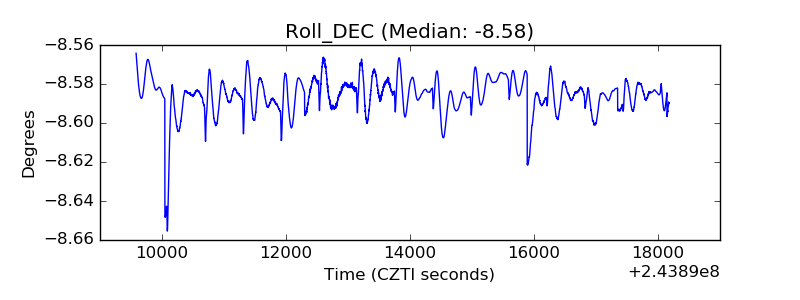 |
| _Roll_RA | 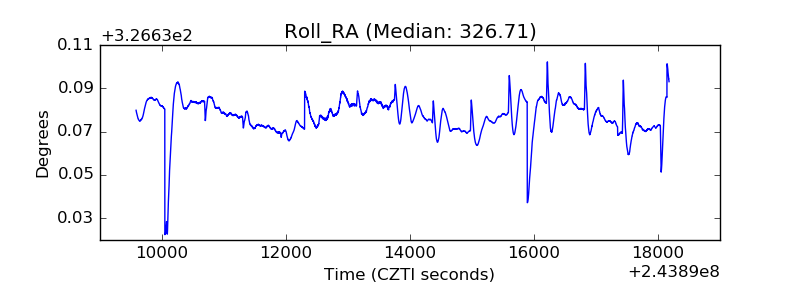 |
| Veto Counter | 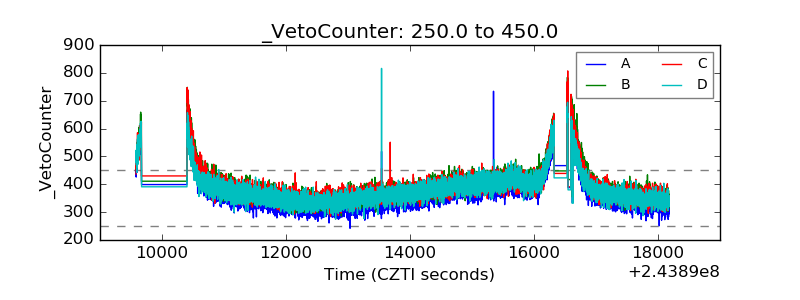 |