| Param | Original file | Final file |
|---|---|---|
| Filename | modeM0/AS1G07_051T01_9000001550_10759cztM0_level2.evt | modeM0/AS1G07_051T01_9000001550_10759cztM0_level2_quad_clean.evt |
| Size (bytes) | 716,250,240 | 115,099,200 |
| Size | 683.1 MB | 109.8 MB |
| Events in quadrant A | 4,373,570 | 736,683 |
| Events in quadrant B | 5,957,459 | 726,220 |
| Events in quadrant C | 3,959,151 | 742,429 |
| Events in quadrant D | 6,814,288 | 677,746 |
| Mode SS | |||
|---|---|---|---|
| Quadrant | BADHDUFLAG | Total packets | Discarded packets |
| A | 0 | 180 | 0 |
| B | 0 | 180 | 0 |
| C | 0 | 180 | 0 |
| D | 0 | 180 | 0 |
| Mode M9 | |||
|---|---|---|---|
| Quadrant | BADHDUFLAG | Total packets | Discarded packets |
| A | 0 | 5 | 0 |
| B | 0 | 5 | 0 |
| C | 0 | 5 | 0 |
| D | 0 | 5 | 0 |
| Mode M0 | |||
|---|---|---|---|
| Quadrant | BADHDUFLAG | Total packets | Discarded packets |
| A | 0 | 18859 | 3 |
| B | 0 | 23464 | 2 |
| C | 0 | 17851 | 2 |
| D | 0 | 26085 | 2 |
| Quadrant | Total seconds | Saturated seconds | Saturation percentage |
|---|---|---|---|
| A | 8673 | 125 | 1.441254% |
| B | 8673 | 562 | 6.479880% |
| C | 8673 | 59 | 0.680272% |
| D | 8673 | 649 | 7.482993% |
Noise dominated data is calculated using 1-second bins in cleaned event files. If a bin has >2000 counts, and if more than 50% of those come from <1% of pixels, then it is considered to be noise-dominated and hence unusable.
| Quadrant | # 1 sec bins | Bins with >0 counts | Bins with >2000 counts | High rate bins dominated by noise | Noise dominated (total time) | Noise dominated (detector-on time) | Marked lightcurve |
|---|---|---|---|---|---|---|---|
| A | 9173 | 8678 | 23 | 23 | 0.25% | 0.27% | 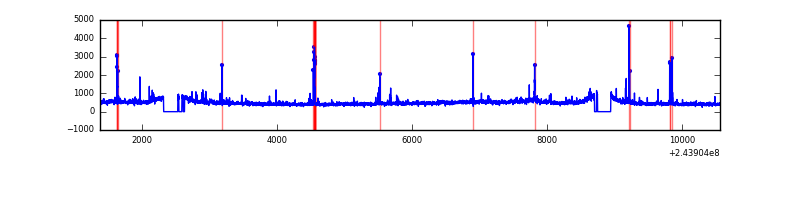 |
| B | 9173 | 8678 | 269 | 269 | 2.93% | 3.10% | 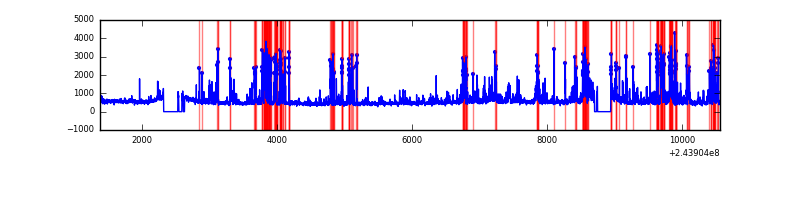 |
| C | 9173 | 8678 | 1 | 1 | 0.01% | 0.01% | 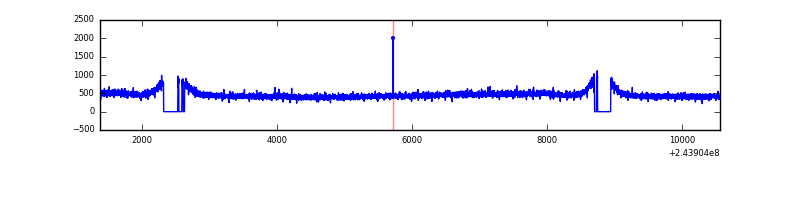 |
| D | 9173 | 8678 | 446 | 446 | 4.86% | 5.14% | 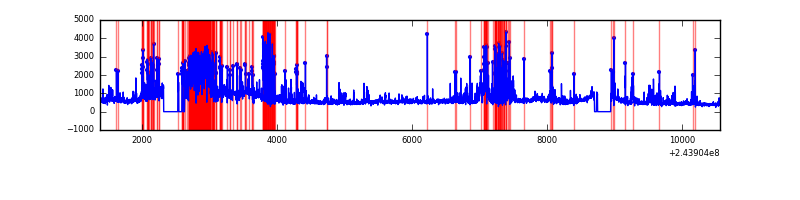 |
Top three noisy pixels from each quadrant. If the there are fewer than three noisy pixels in the level2.evt file, extra rows are filled as -1
| Pixel properties | Quadrant properties | ||||||
|---|---|---|---|---|---|---|---|
| Quadrant | DetID | PixID | Counts | Sigma | Mean | Median | Sigma |
| A | 15 | 239 | 173358 | 807.74 | 1037 | 1014 | 213.4 |
| A | 13 | 248 | 80581 | 372.91 | 1037 | 1014 | 213.4 |
| A | 15 | 223 | 52487 | 241.24 | 1037 | 1014 | 213.4 |
| B | 4 | 239 | 1391469 | 6969.29 | 1027 | 998 | 199.5 |
| B | 0 | 85 | 373267 | 1865.88 | 1027 | 998 | 199.5 |
| B | 0 | 214 | 85566 | 423.87 | 1027 | 998 | 199.5 |
| C | 8 | 128 | 11343 | 44.08 | 1008 | 1012 | 234.4 |
| C | 13 | 61 | 7737 | 28.69 | 1008 | 1012 | 234.4 |
| C | 8 | 112 | 7007 | 25.58 | 1008 | 1012 | 234.4 |
| D | 1 | 52 | 2096816 | 8715.72 | 980 | 949 | 240.5 |
| D | 8 | 195 | 558808 | 2319.87 | 980 | 949 | 240.5 |
| D | 5 | 222 | 124473 | 513.68 | 980 | 949 | 240.5 |
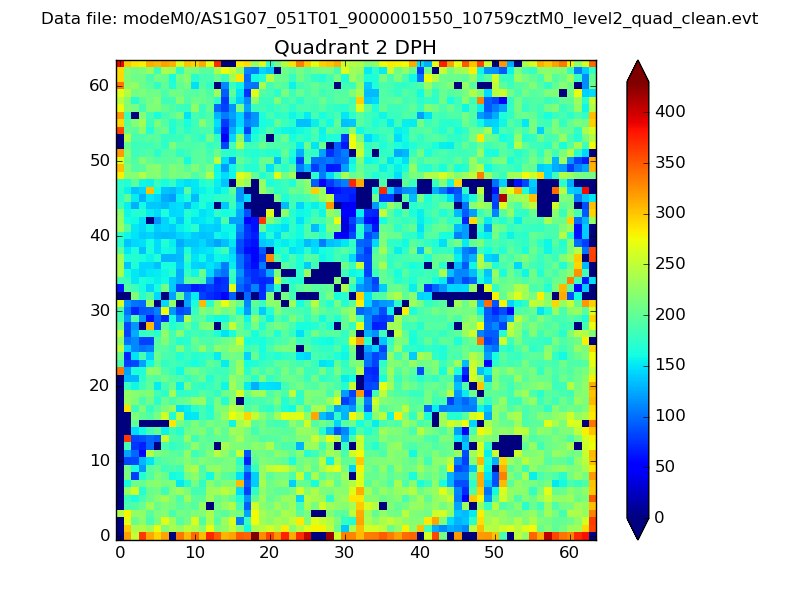
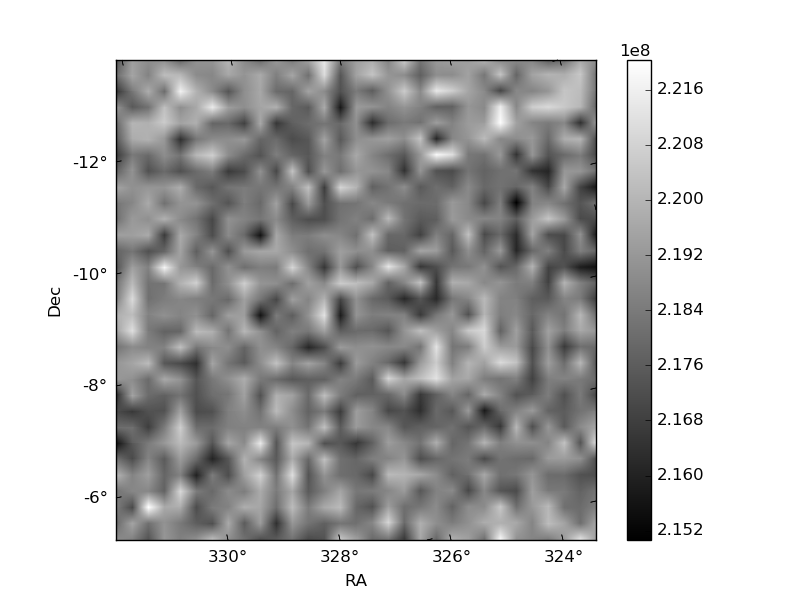
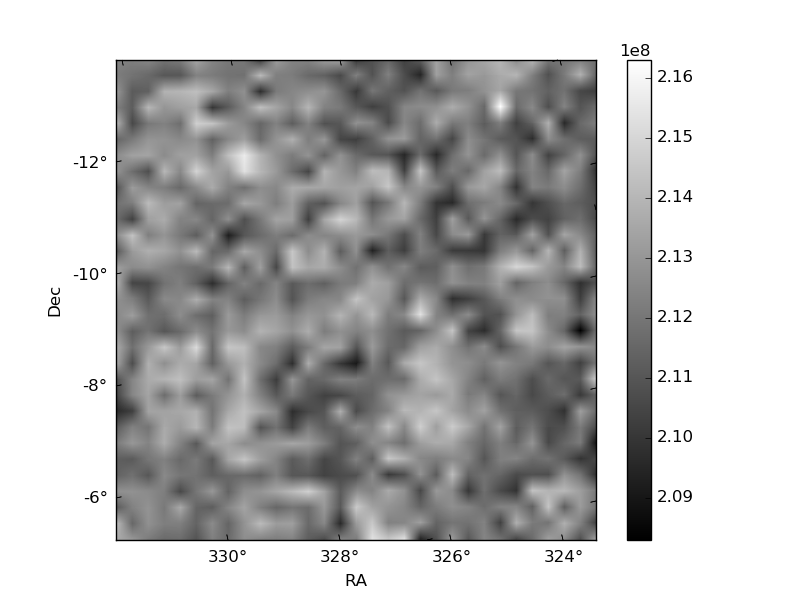
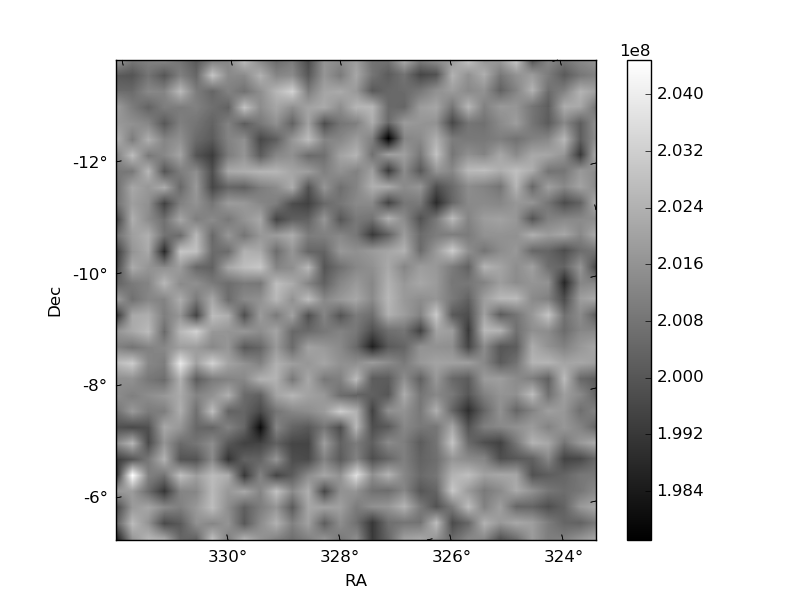
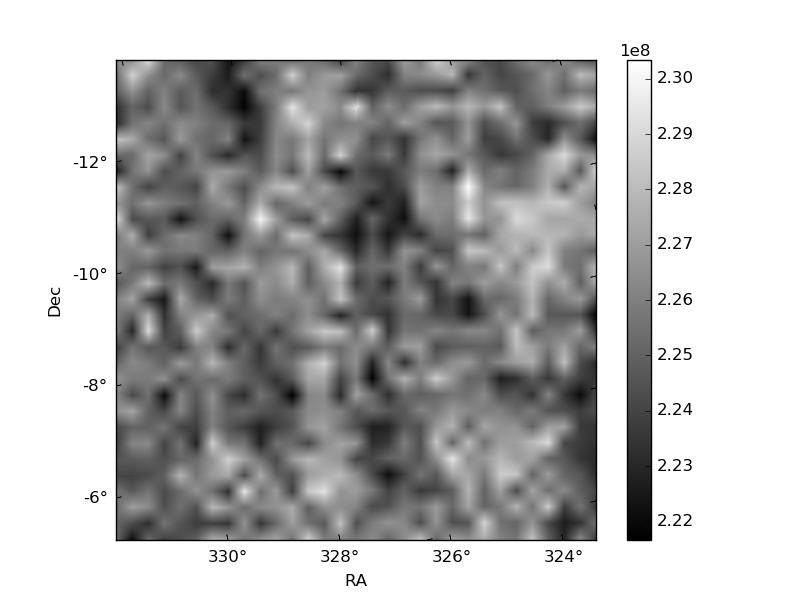
Histogram calculated using DETX and DETY for each event in the final _common_clean file
| Quadrant A | 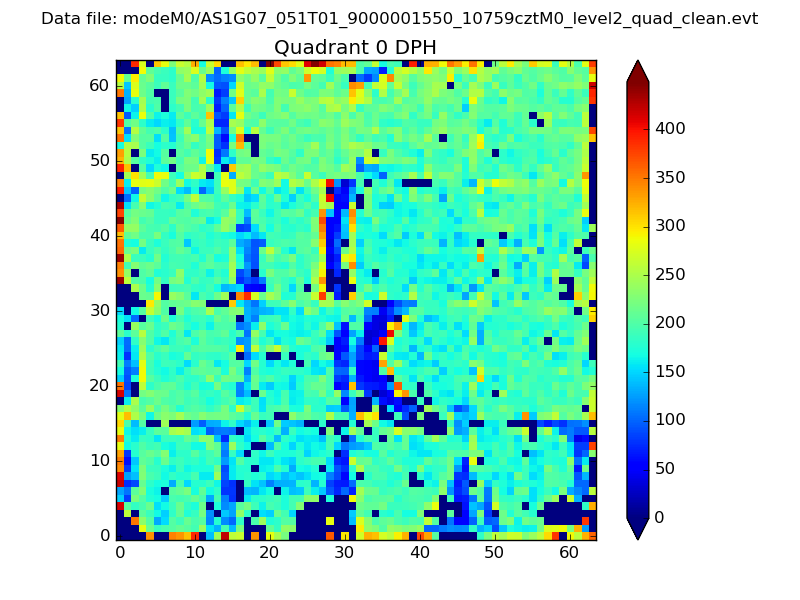 |
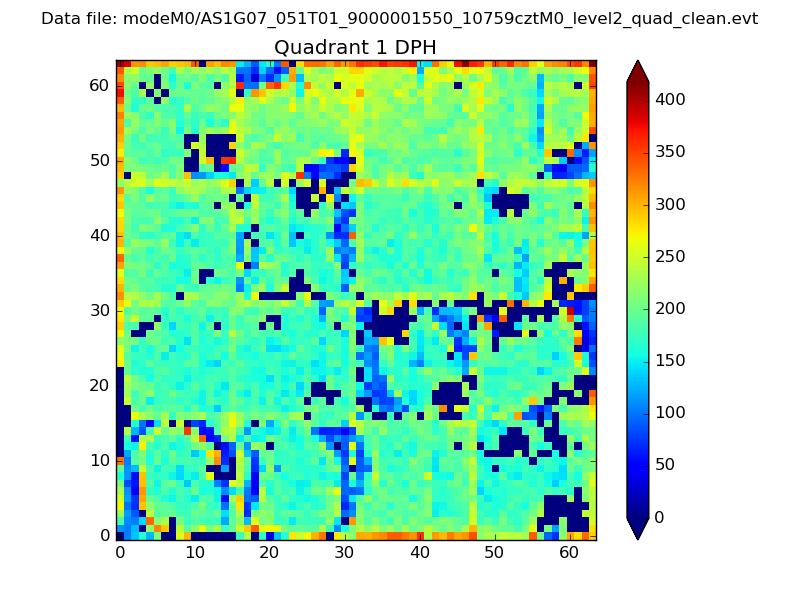 |
Quadrant B |
|---|---|---|---|
| Quadrant D | 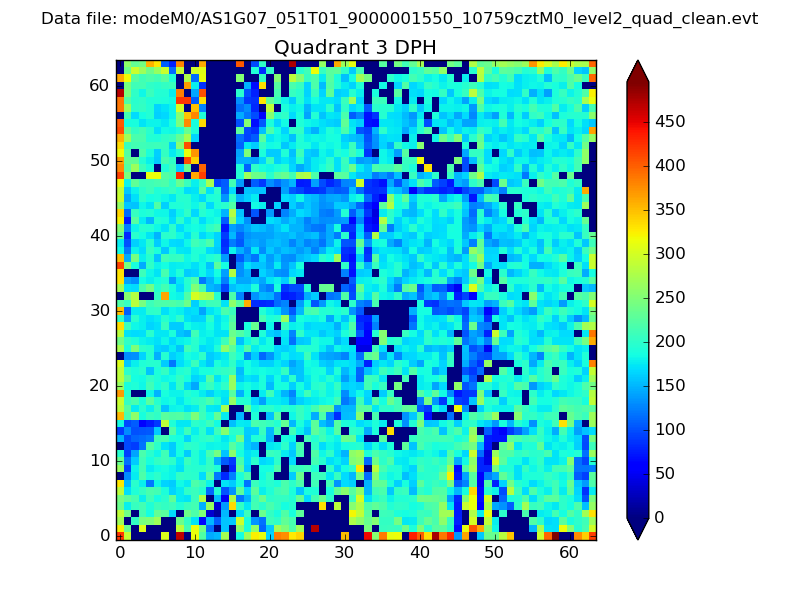 |
 |
Quadrant C |
| Plot type | Count rate plots | Images |
|---|---|---|
| Comparison with Poisson distribution Blue bars denote a histogram of data divided into 1 sec bins. Red curve is a Poisson curve with rate = median count rate of data. |
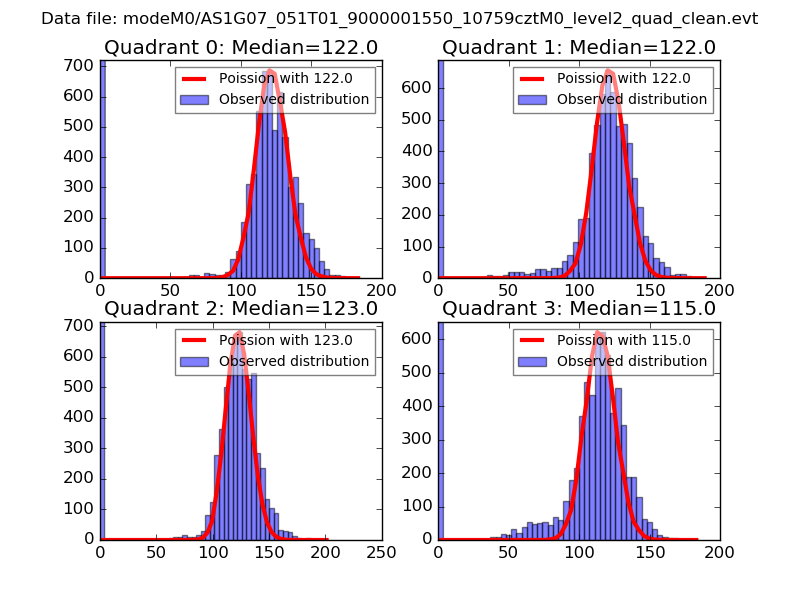 |
 |
| Quadrant-wise count rates Data is divided into 100 sec bins |
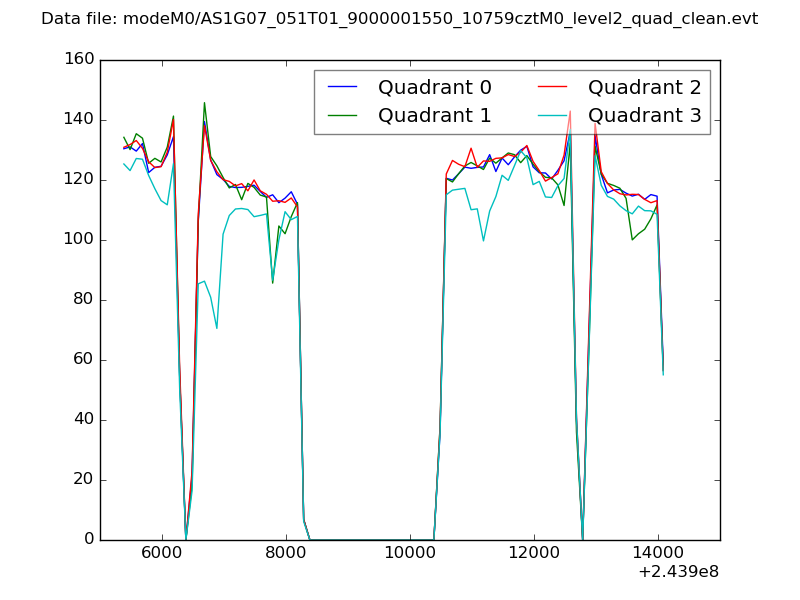 |
|
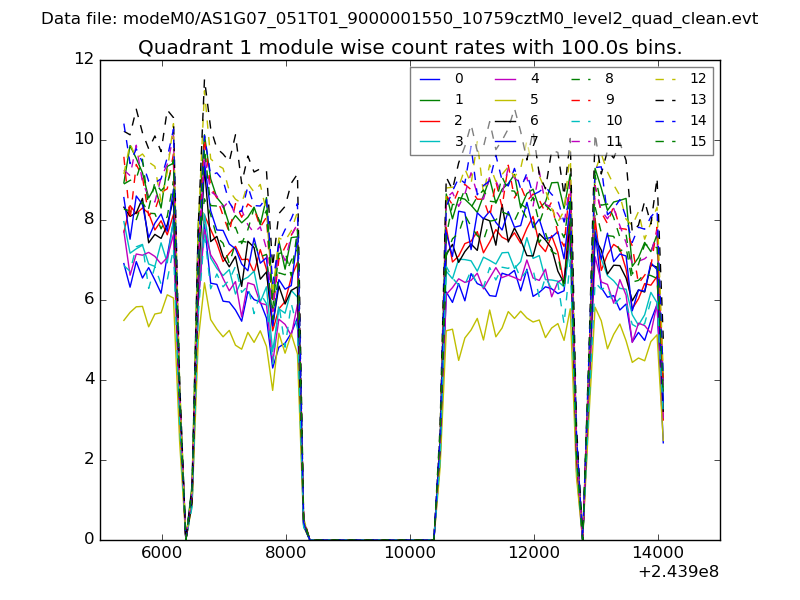
| Module-wise count rates for Quadrant A Data is divided into 100 sec bins |
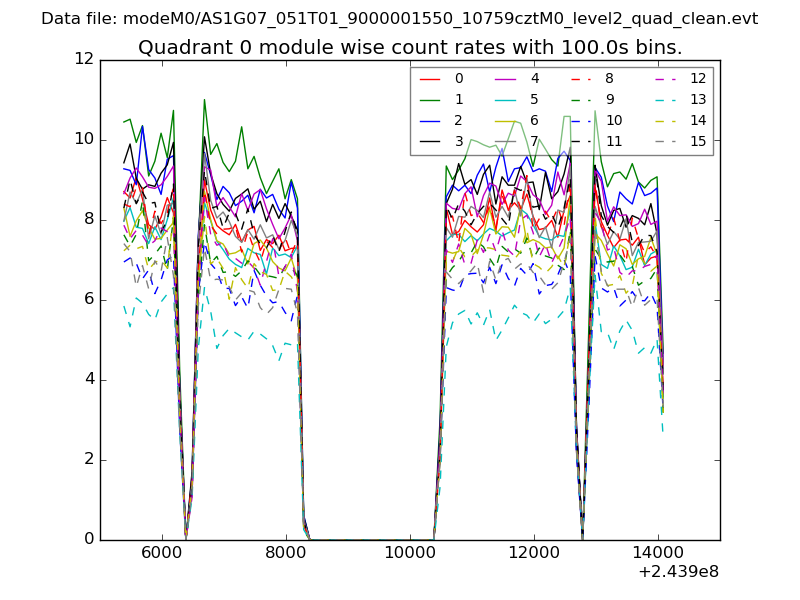 |
 |
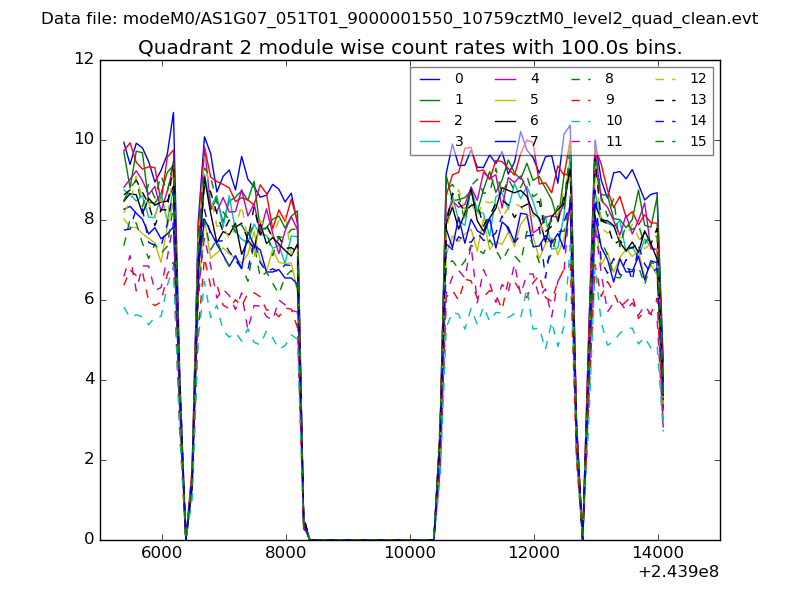
| Module-wise count rates for Quadrant B Data is divided into 100 sec bins |
 |
 |
| Module-wise count rates for Quadrant C Data is divided into 100 sec bins |
 |
 |
| Module-wise count rates for Quadrant D Data is divided into 100 sec bins |
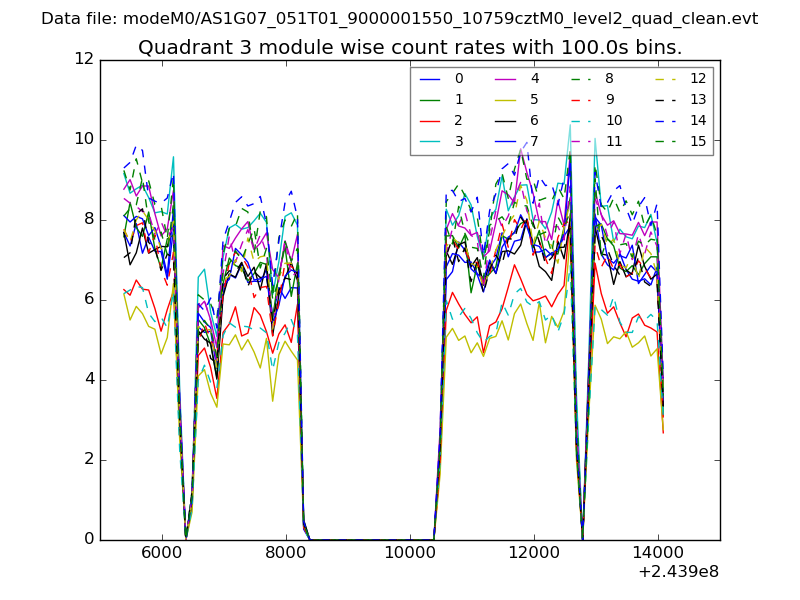 |
 |
| Parameter | Plot |
|---|---|
| CZT HV Monitor | 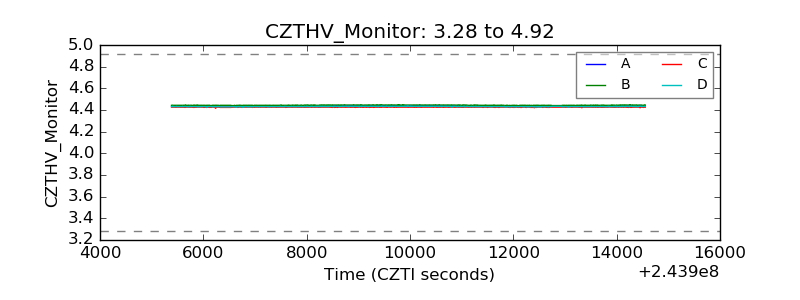 |
| D_VDD | 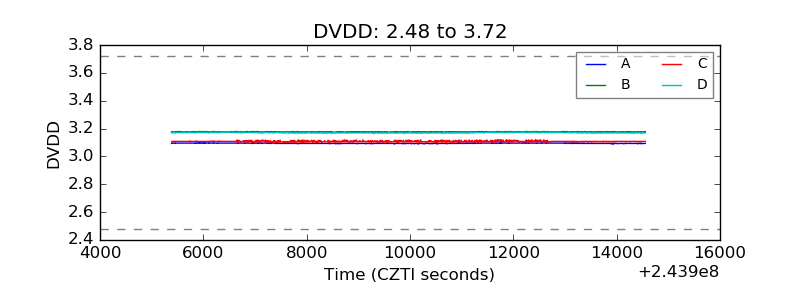 |
| Temperature 1 | 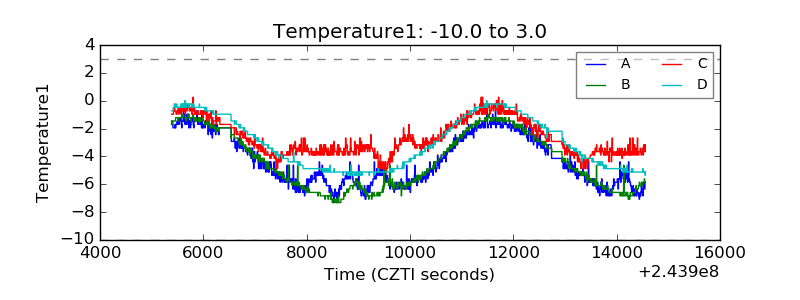 |
| Veto HV Monitor | 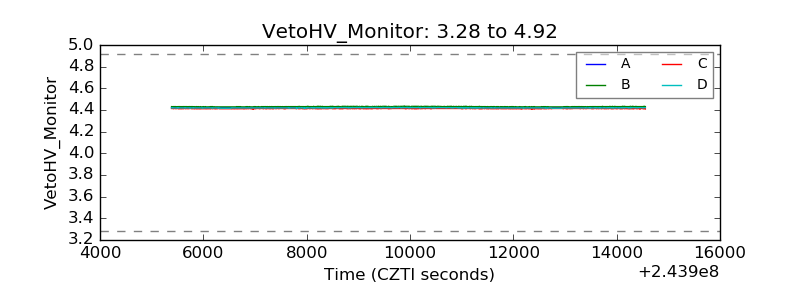 |
| Veto LLD | 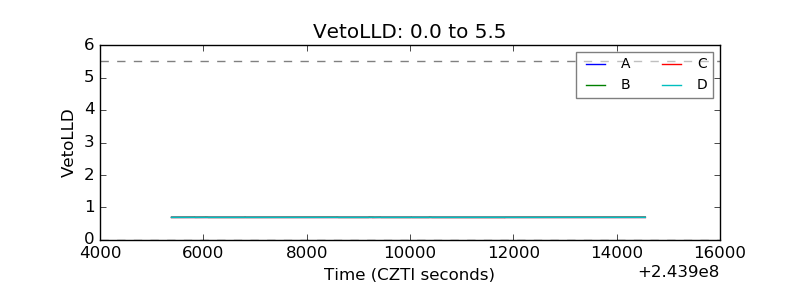 |
| Alpha Counter | 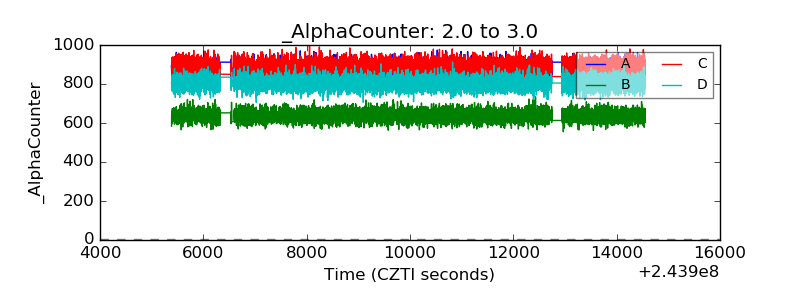 |
| _CPM_Rate | 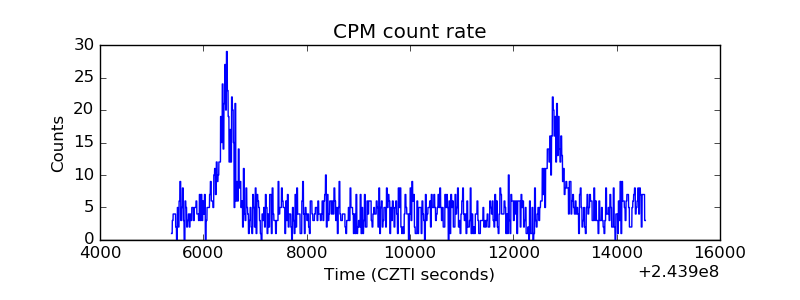 |
| CZT Counter |  |
| +2.5 Volts monitor |  |
| +5 Volts monitor |  |
| _ROLL_ROT | 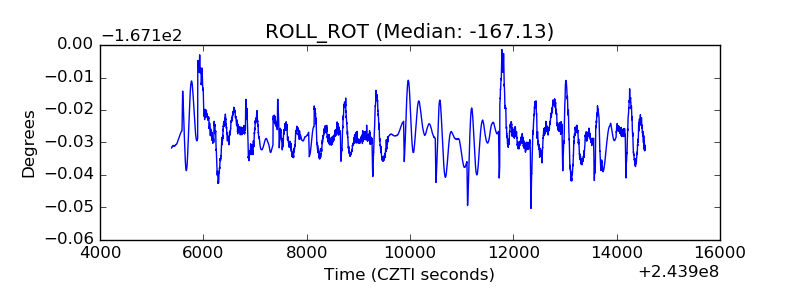 |
| _Roll_DEC | 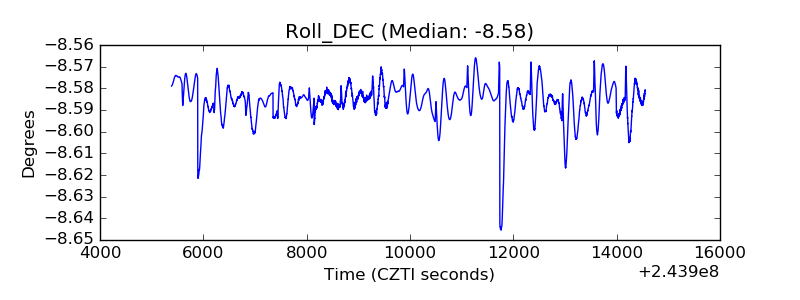 |
| _Roll_RA |  |
| Veto Counter | 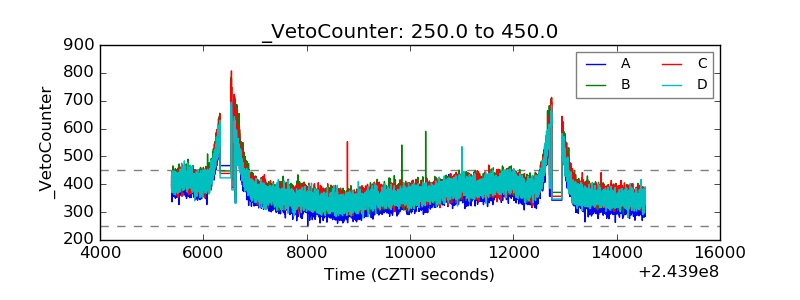 |