| Param | Original file | Final file |
|---|---|---|
| Filename | modeM0/AS1G07_051T01_9000001550_10760cztM0_level2.evt | modeM0/AS1G07_051T01_9000001550_10760cztM0_level2_quad_clean.evt |
| Size (bytes) | 599,212,800 | 97,770,240 |
| Size | 571.5 MB | 93.2 MB |
| Events in quadrant A | 3,856,737 | 607,267 |
| Events in quadrant B | 5,771,401 | 591,941 |
| Events in quadrant C | 3,646,044 | 610,191 |
| Events in quadrant D | 4,320,112 | 584,622 |
| Mode SS | |||
|---|---|---|---|
| Quadrant | BADHDUFLAG | Total packets | Discarded packets |
| A | 0 | 168 | 0 |
| B | 0 | 168 | 0 |
| C | 0 | 168 | 0 |
| D | 0 | 168 | 0 |
| Mode M9 | |||
|---|---|---|---|
| Quadrant | BADHDUFLAG | Total packets | Discarded packets |
| A | 0 | 6 | 0 |
| B | 0 | 6 | 0 |
| C | 0 | 6 | 0 |
| D | 0 | 6 | 0 |
| Mode M0 | |||
|---|---|---|---|
| Quadrant | BADHDUFLAG | Total packets | Discarded packets |
| A | 0 | 17112 | 10 |
| B | 0 | 22503 | 5 |
| C | 0 | 16688 | 8 |
| D | 0 | 18471 | 2 |
| Quadrant | Total seconds | Saturated seconds | Saturation percentage |
|---|---|---|---|
| A | 8148 | 84 | 1.030928% |
| B | 8150 | 624 | 7.656442% |
| C | 8148 | 31 | 0.380461% |
| D | 8151 | 73 | 0.895596% |
Noise dominated data is calculated using 1-second bins in cleaned event files. If a bin has >2000 counts, and if more than 50% of those come from <1% of pixels, then it is considered to be noise-dominated and hence unusable.
| Quadrant | # 1 sec bins | Bins with >0 counts | Bins with >2000 counts | High rate bins dominated by noise | Noise dominated (total time) | Noise dominated (detector-on time) | Marked lightcurve |
|---|---|---|---|---|---|---|---|
| A | 8791 | 8154 | 13 | 13 | 0.15% | 0.16% | 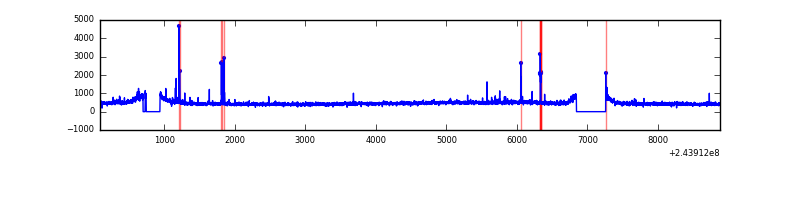 |
| B | 8791 | 8154 | 329 | 329 | 3.74% | 4.03% | 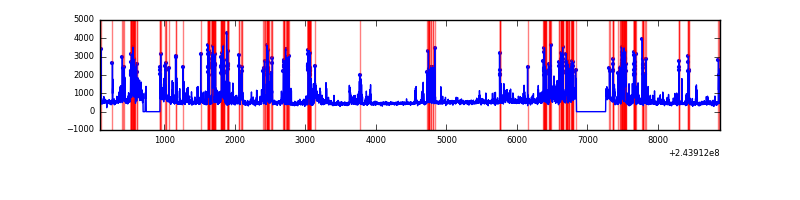 |
| C | 8791 | 8154 | 0 | 0 | 0.00% | 0.00% | 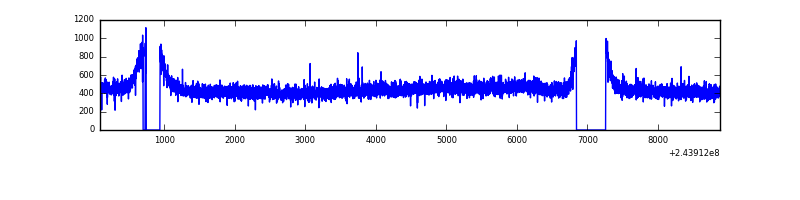 |
| D | 8791 | 8154 | 37 | 37 | 0.42% | 0.45% | 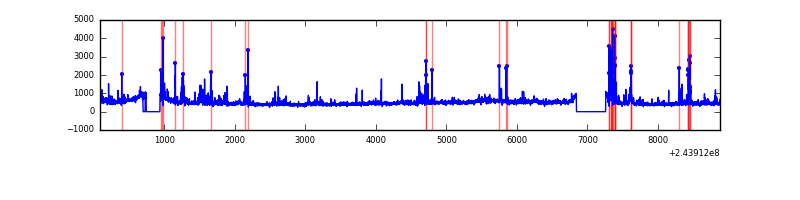 |
Top three noisy pixels from each quadrant. If the there are fewer than three noisy pixels in the level2.evt file, extra rows are filled as -1
| Pixel properties | Quadrant properties | ||||||
|---|---|---|---|---|---|---|---|
| Quadrant | DetID | PixID | Counts | Sigma | Mean | Median | Sigma |
| A | 13 | 248 | 46630 | 233.32 | 956 | 935 | 195.8 |
| A | 15 | 239 | 41429 | 206.76 | 956 | 935 | 195.8 |
| A | 15 | 174 | 34082 | 169.25 | 956 | 935 | 195.8 |
| B | 4 | 239 | 1544984 | 8434.47 | 941 | 916 | 183.1 |
| B | 0 | 85 | 447574 | 2439.87 | 941 | 916 | 183.1 |
| B | 0 | 214 | 32214 | 170.97 | 941 | 916 | 183.1 |
| C | 13 | 61 | 7049 | 27.75 | 934 | 935 | 220.3 |
| C | 8 | 222 | 2717 | 8.09 | 934 | 935 | 220.3 |
| C | 3 | 254 | 2602 | 7.57 | 934 | 935 | 220.3 |
| D | 8 | 195 | 247714 | 1088.02 | 926 | 896 | 226.9 |
| D | 1 | 52 | 170943 | 749.6 | 926 | 896 | 226.9 |
| D | 10 | 157 | 116625 | 510.15 | 926 | 896 | 226.9 |
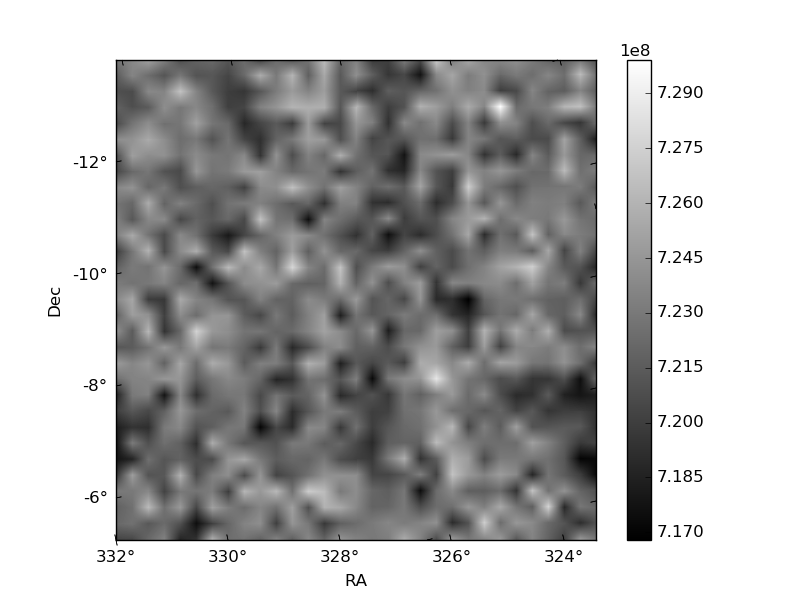
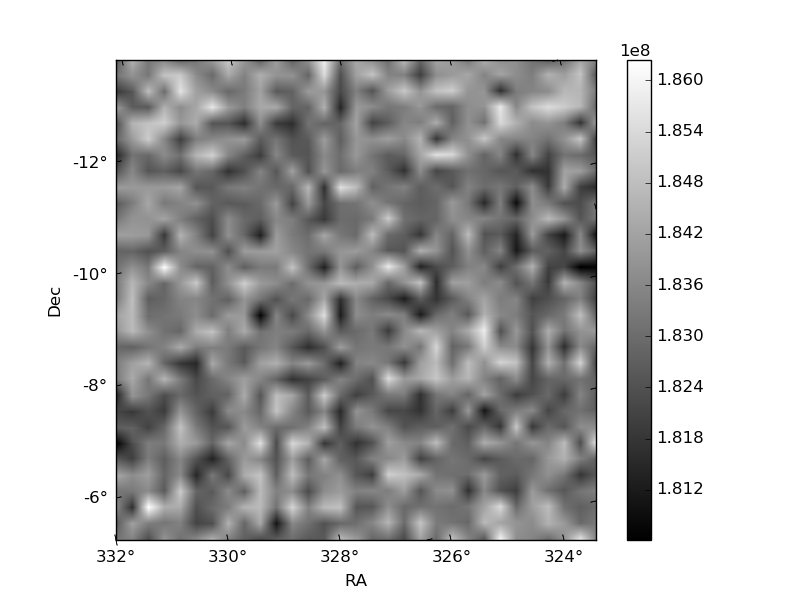
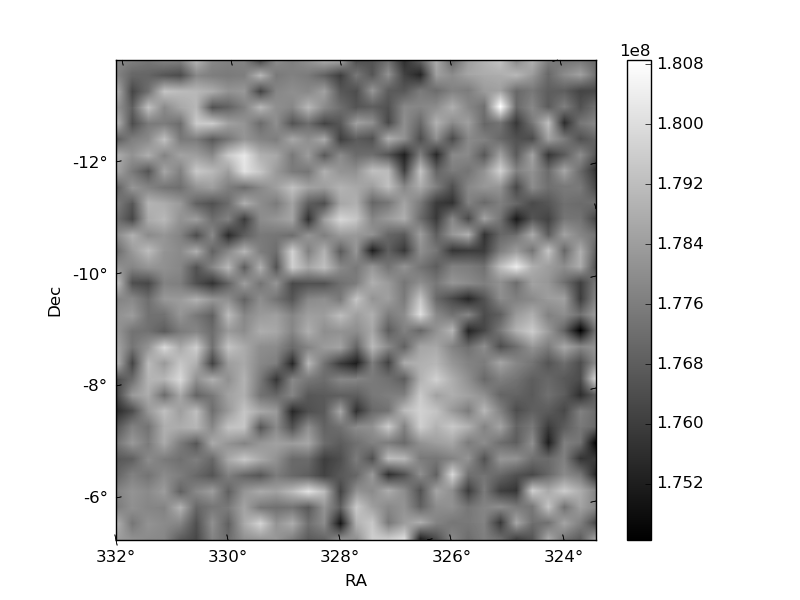
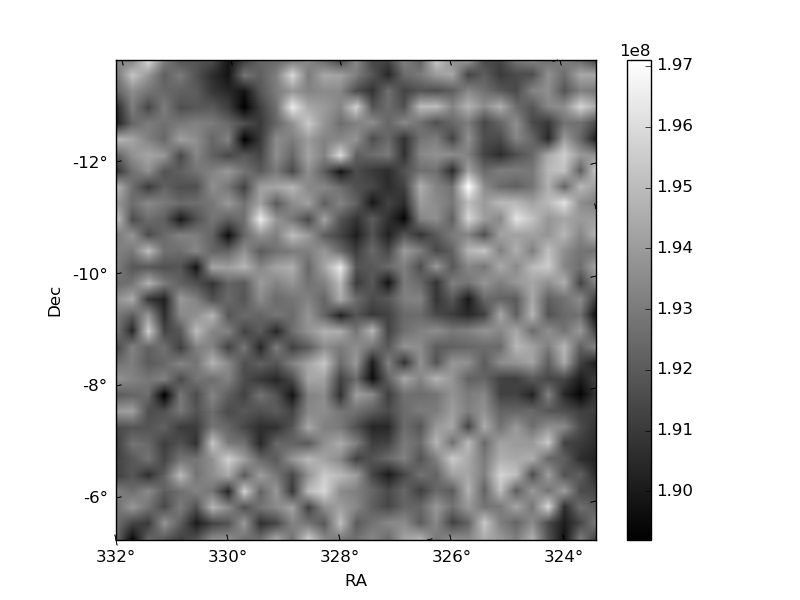
Histogram calculated using DETX and DETY for each event in the final _common_clean file
| Quadrant A | 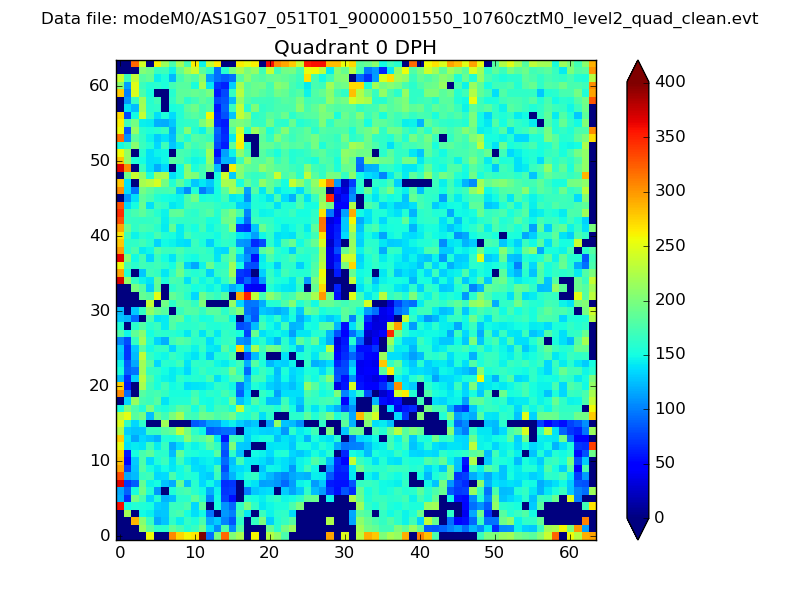 |
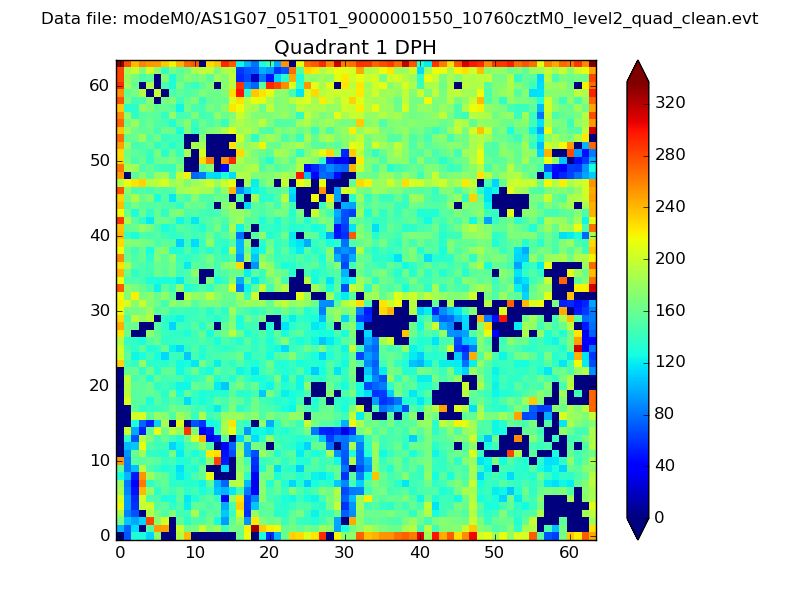 |
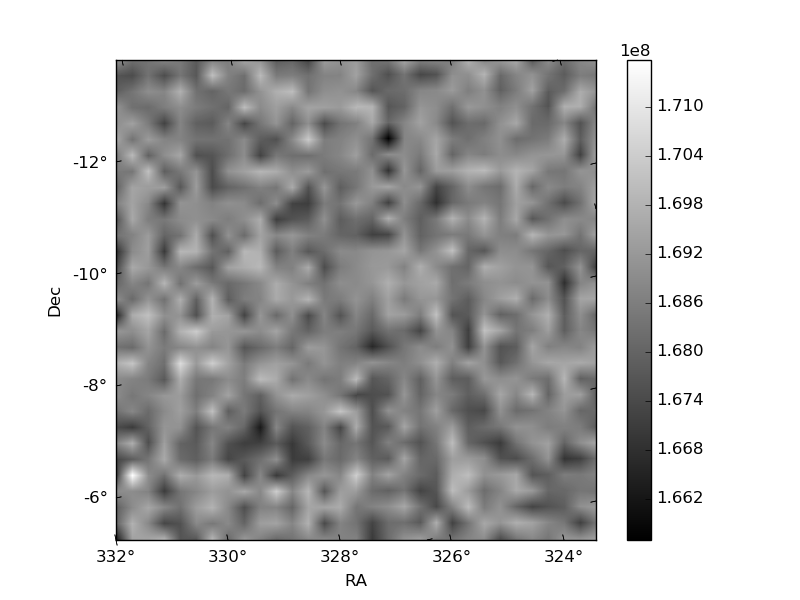
Quadrant B |
|---|---|---|---|
| Quadrant D | 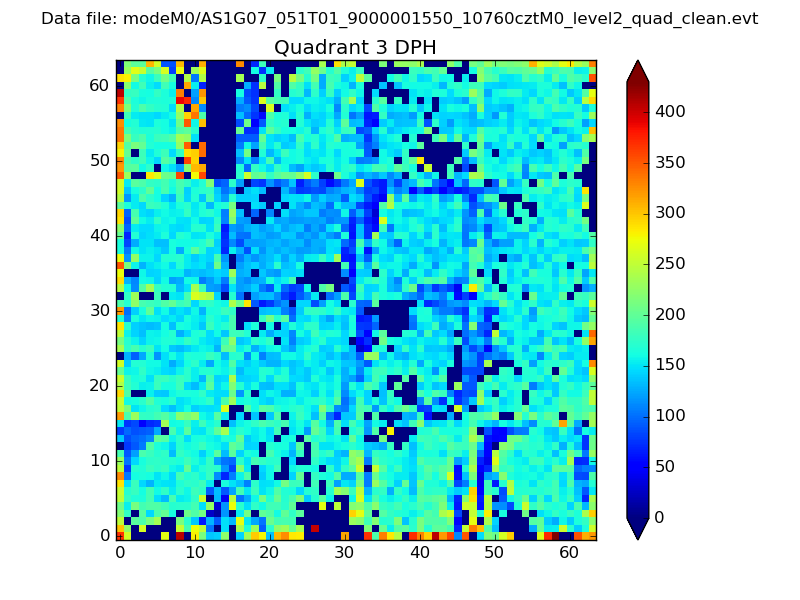 |
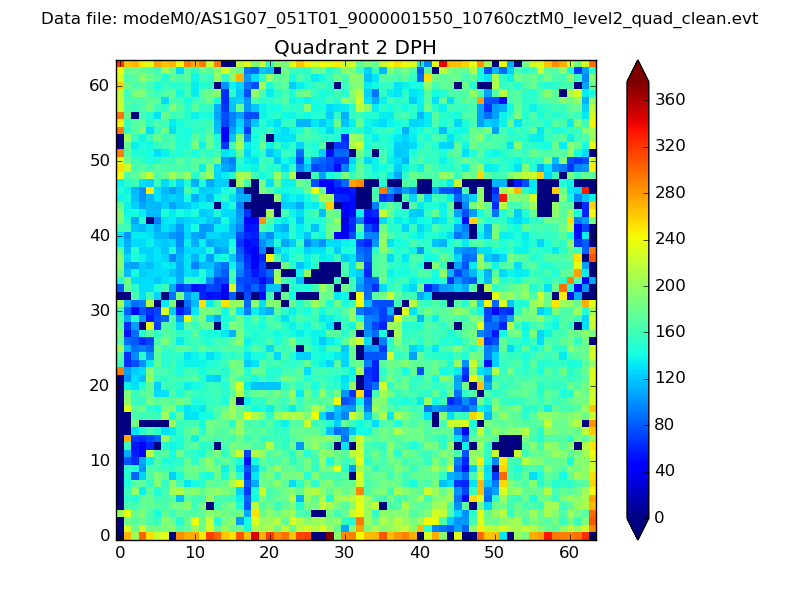 |
Quadrant C |
| Plot type | Count rate plots | Images |
|---|---|---|
| Comparison with Poisson distribution Blue bars denote a histogram of data divided into 1 sec bins. Red curve is a Poisson curve with rate = median count rate of data. |
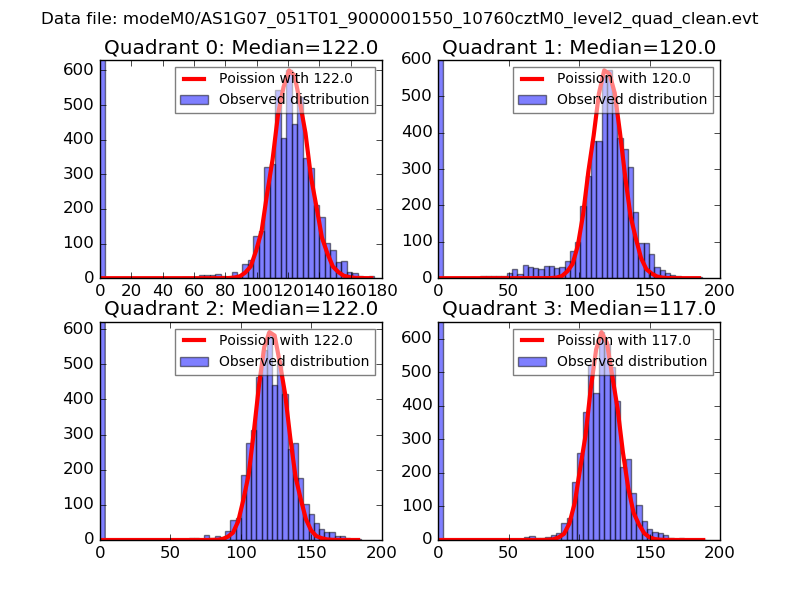 |
 |
| Quadrant-wise count rates Data is divided into 100 sec bins |
 |
|
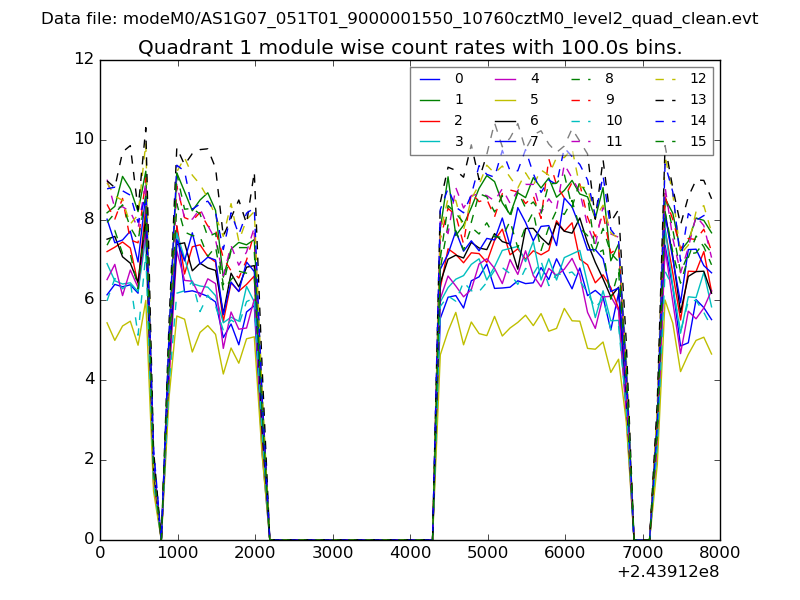
| Module-wise count rates for Quadrant A Data is divided into 100 sec bins |
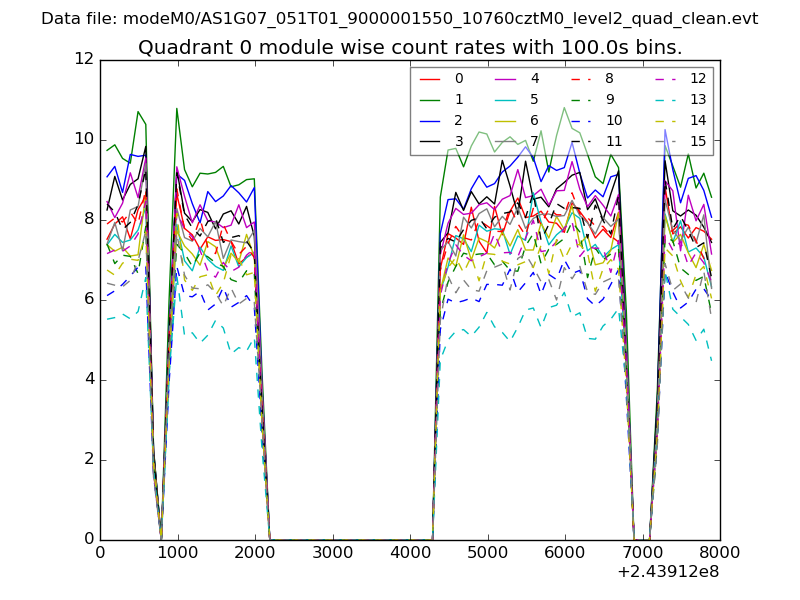 |
 |
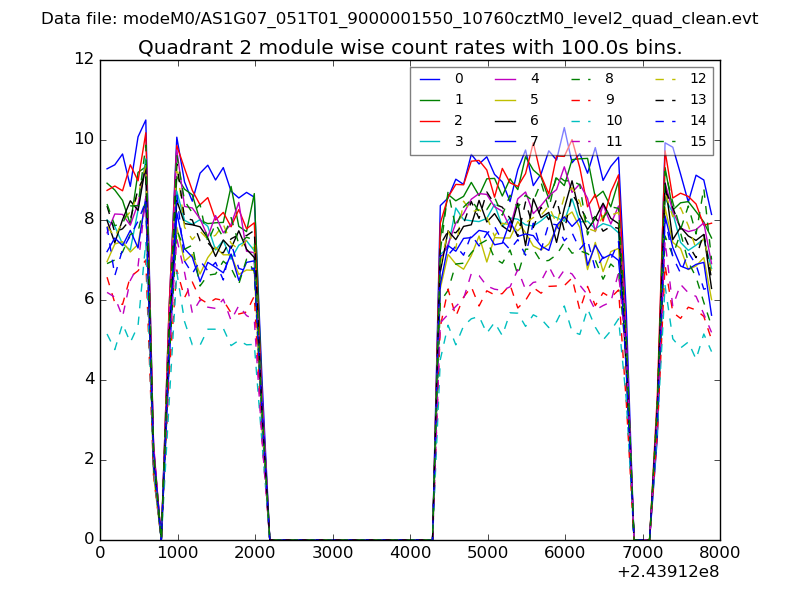
| Module-wise count rates for Quadrant B Data is divided into 100 sec bins |
 |
 |
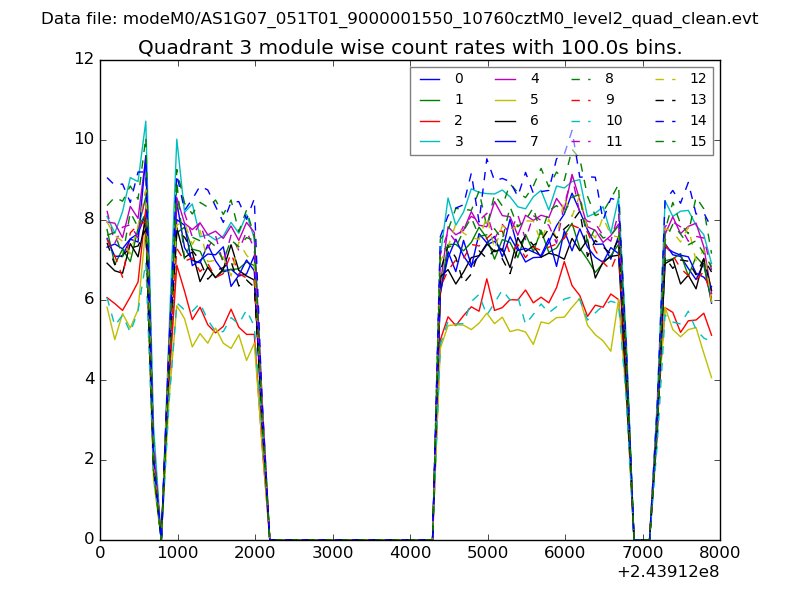
| Module-wise count rates for Quadrant C Data is divided into 100 sec bins |
 |
 |
| Module-wise count rates for Quadrant D Data is divided into 100 sec bins |
 |
 |
| Parameter | Plot |
|---|---|
| CZT HV Monitor | 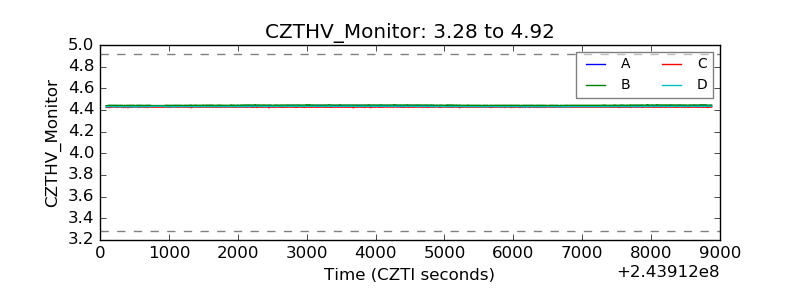 |
| D_VDD | 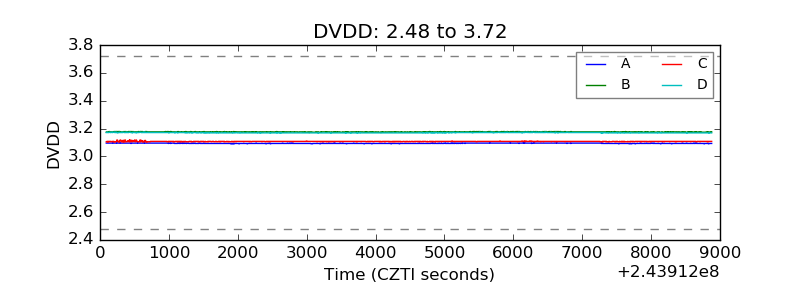 |
| Temperature 1 | 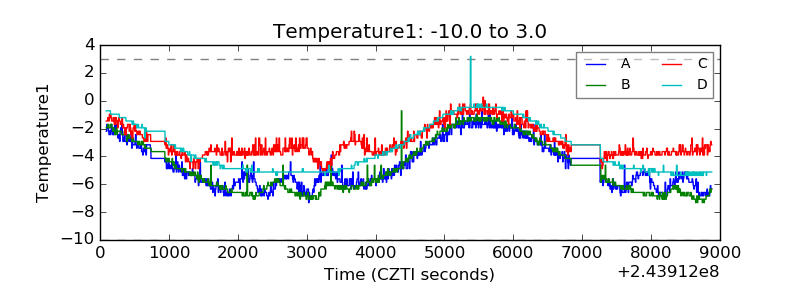 |
| Veto HV Monitor |  |
| Veto LLD | 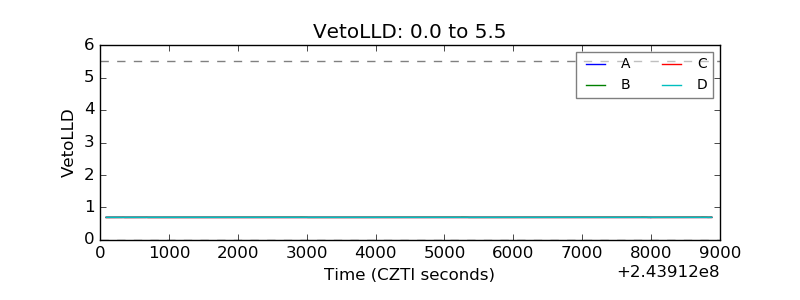 |
| Alpha Counter |  |
| _CPM_Rate | 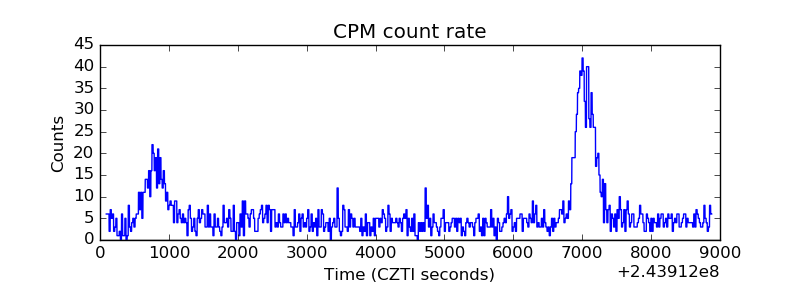 |
| CZT Counter | 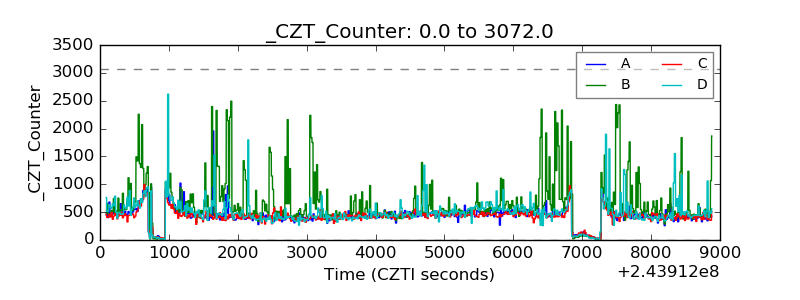 |
| +2.5 Volts monitor |  |
| +5 Volts monitor |  |
| _ROLL_ROT | 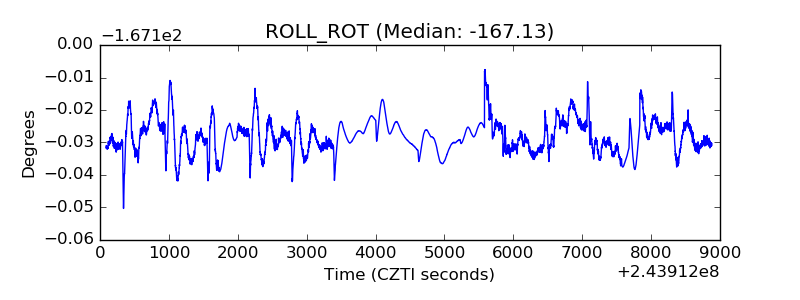 |
| _Roll_DEC | 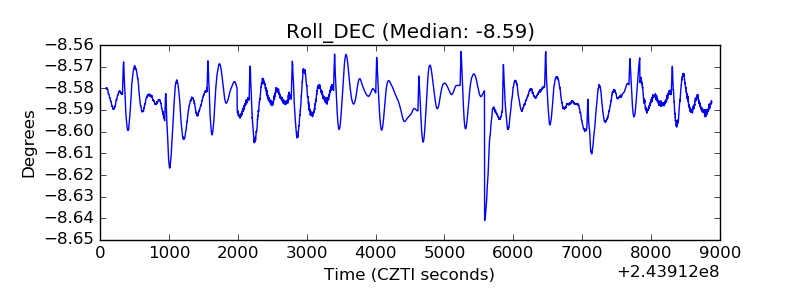 |
| _Roll_RA | 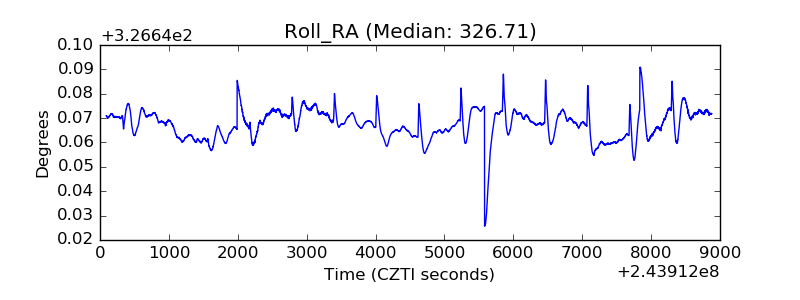 |
| Veto Counter | 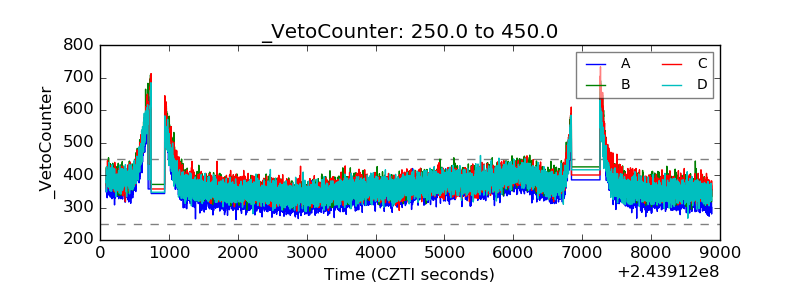 |