| Param | Original file | Final file |
|---|---|---|
| Filename | modeM0/AS1G07_051T01_9000001550_10762cztM0_level2.evt | modeM0/AS1G07_051T01_9000001550_10762cztM0_level2_quad_clean.evt |
| Size (bytes) | 1,070,159,040 | 130,576,320 |
| Size | 1020.6 MB | 124.5 MB |
| Events in quadrant A | 6,262,221 | 793,252 |
| Events in quadrant B | 9,534,176 | 783,199 |
| Events in quadrant C | 5,629,158 | 804,268 |
| Events in quadrant D | 10,128,620 | 697,363 |
| Mode SS | |||
|---|---|---|---|
| Quadrant | BADHDUFLAG | Total packets | Discarded packets |
| A | 0 | 258 | 0 |
| B | 0 | 258 | 0 |
| C | 0 | 258 | 0 |
| D | 0 | 258 | 0 |
| Mode M9 | |||
|---|---|---|---|
| Quadrant | BADHDUFLAG | Total packets | Discarded packets |
| A | 0 | 12 | 0 |
| B | 0 | 12 | 0 |
| C | 0 | 12 | 0 |
| D | 0 | 12 | 0 |
| Mode M0 | |||
|---|---|---|---|
| Quadrant | BADHDUFLAG | Total packets | Discarded packets |
| A | 0 | 26745 | 3 |
| B | 0 | 36654 | 9 |
| C | 0 | 25768 | 6 |
| D | 0 | 38694 | 8 |
| Quadrant | Total seconds | Saturated seconds | Saturation percentage |
|---|---|---|---|
| A | 12661 | 173 | 1.366401% |
| B | 12659 | 1083 | 8.555178% |
| C | 12659 | 101 | 0.797851% |
| D | 12659 | 1352 | 10.680149% |
Noise dominated data is calculated using 1-second bins in cleaned event files. If a bin has >2000 counts, and if more than 50% of those come from <1% of pixels, then it is considered to be noise-dominated and hence unusable.
| Quadrant | # 1 sec bins | Bins with >0 counts | Bins with >2000 counts | High rate bins dominated by noise | Noise dominated (total time) | Noise dominated (detector-on time) | Marked lightcurve |
|---|---|---|---|---|---|---|---|
| A | 13886 | 12661 | 30 | 30 | 0.22% | 0.24% | 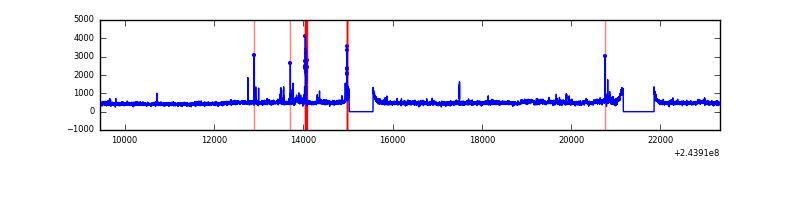 |
| B | 13886 | 12662 | 588 | 588 | 4.23% | 4.64% | 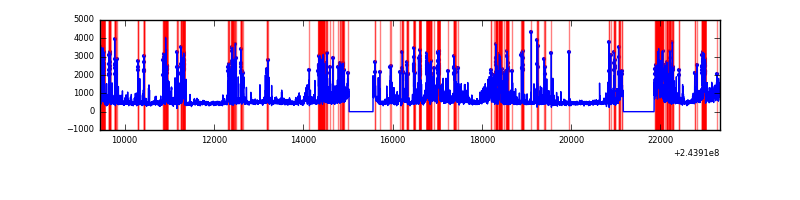 |
| C | 13886 | 12663 | 0 | 0 | 0.00% | 0.00% | 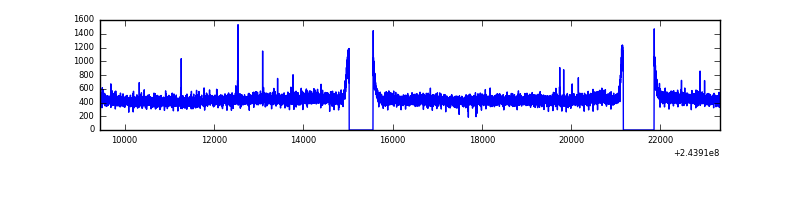 |
| D | 13886 | 12663 | 1106 | 1106 | 7.96% | 8.73% | 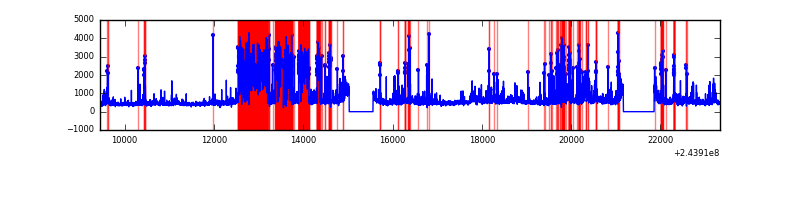 |
Top three noisy pixels from each quadrant. If the there are fewer than three noisy pixels in the level2.evt file, extra rows are filled as -1
| Pixel properties | Quadrant properties | ||||||
|---|---|---|---|---|---|---|---|
| Quadrant | DetID | PixID | Counts | Sigma | Mean | Median | Sigma |
| A | 15 | 239 | 378403 | 1263.72 | 1471 | 1436 | 298.3 |
| A | 15 | 174 | 132828 | 440.47 | 1471 | 1436 | 298.3 |
| A | 13 | 248 | 41300 | 133.64 | 1471 | 1436 | 298.3 |
| B | 4 | 239 | 2012021 | 7235.56 | 1444 | 1408 | 277.9 |
| B | 0 | 85 | 1666333 | 5991.54 | 1444 | 1408 | 277.9 |
| B | 0 | 214 | 77828 | 275.01 | 1444 | 1408 | 277.9 |
| C | 13 | 61 | 10717 | 27.63 | 1440 | 1446 | 335.5 |
| C | 12 | 4 | 6659 | 15.54 | 1440 | 1446 | 335.5 |
| C | 8 | 222 | 6181 | 14.11 | 1440 | 1446 | 335.5 |
| D | 10 | 157 | 2892871 | 8780.22 | 1367 | 1330 | 329.3 |
| D | 1 | 52 | 844770 | 2561.12 | 1367 | 1330 | 329.3 |
| D | 8 | 195 | 462933 | 1401.67 | 1367 | 1330 | 329.3 |
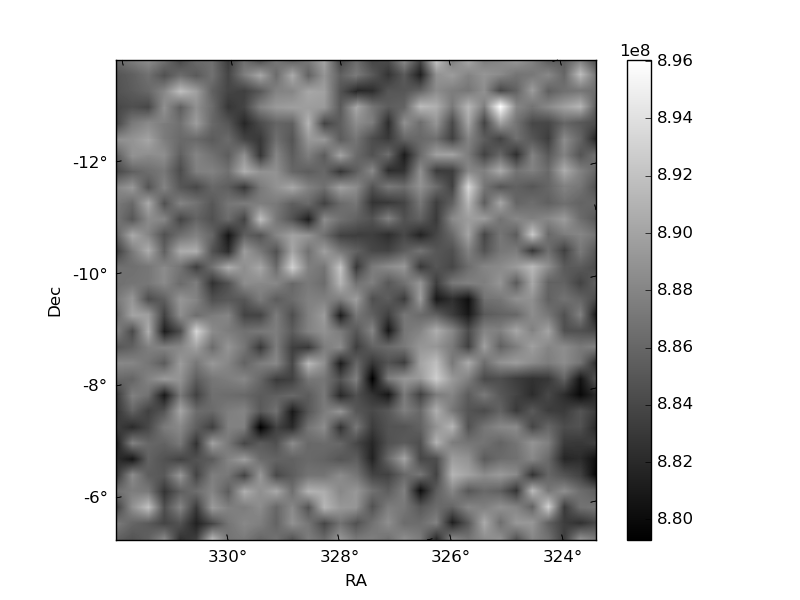
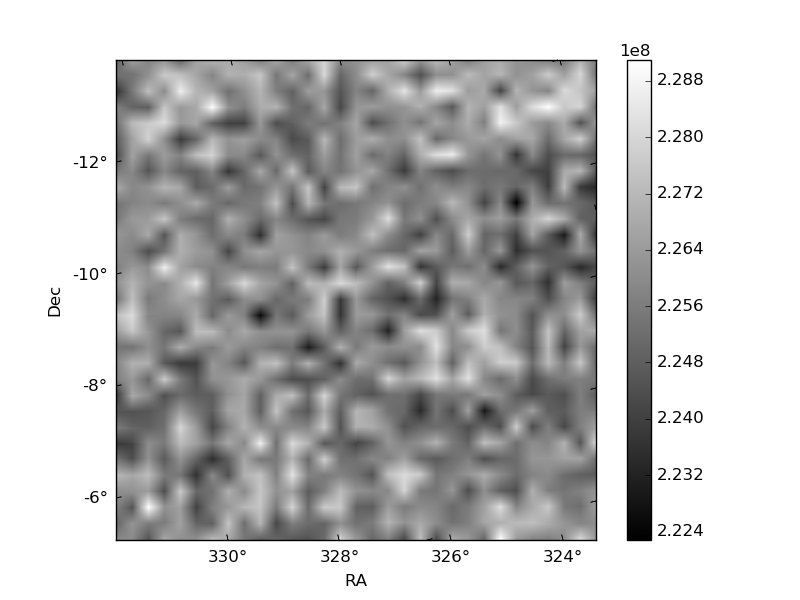
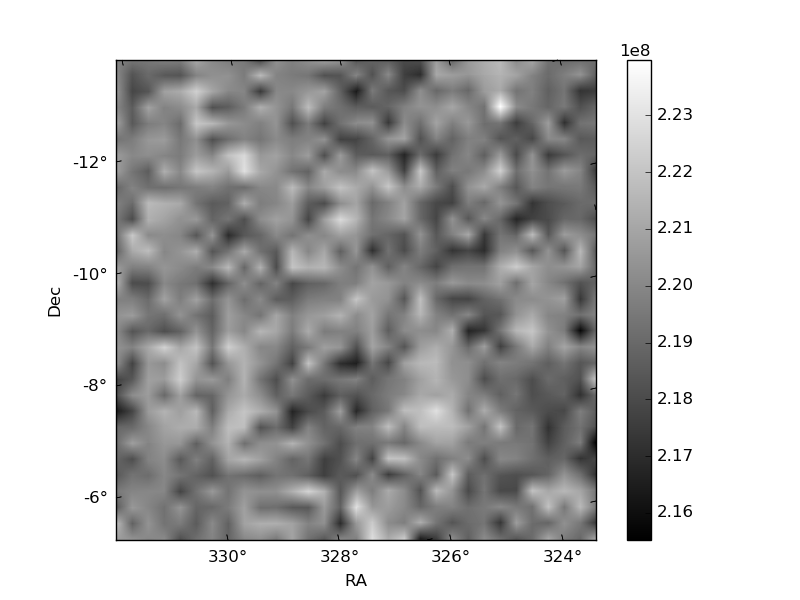
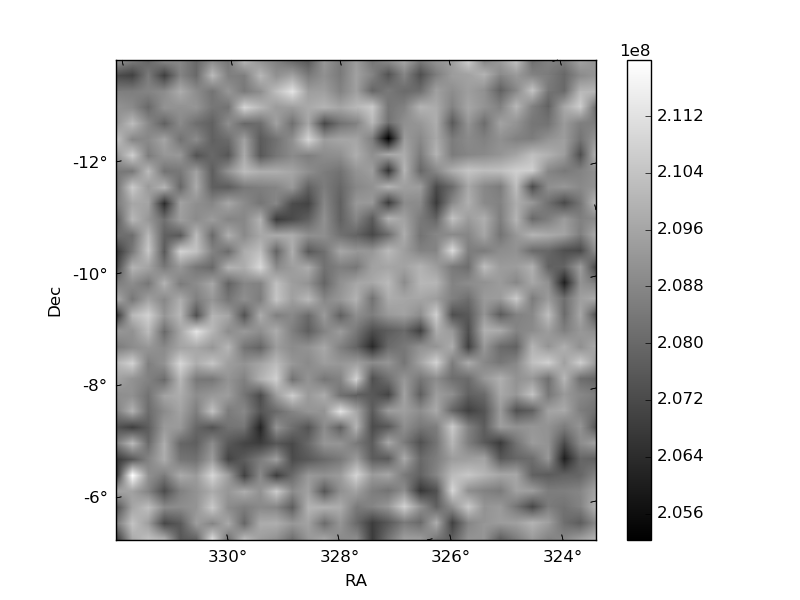
Histogram calculated using DETX and DETY for each event in the final _common_clean file
| Quadrant A | 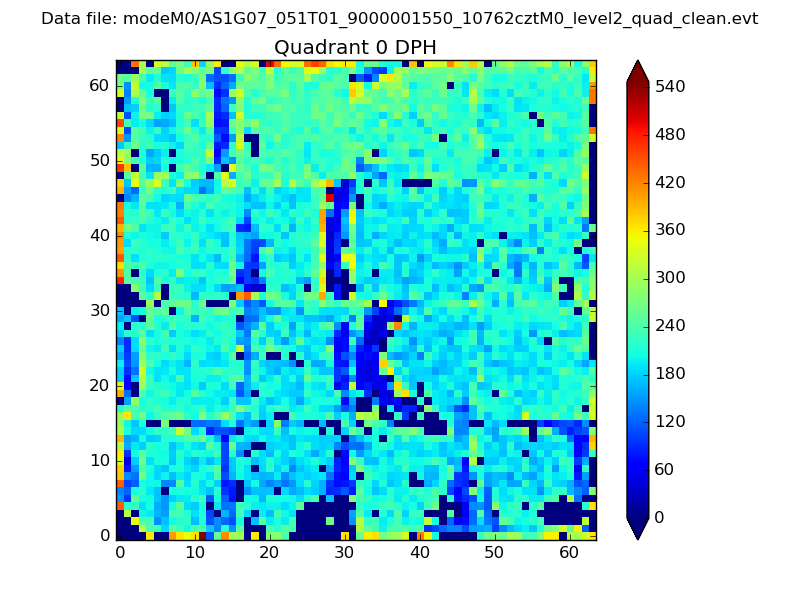 |
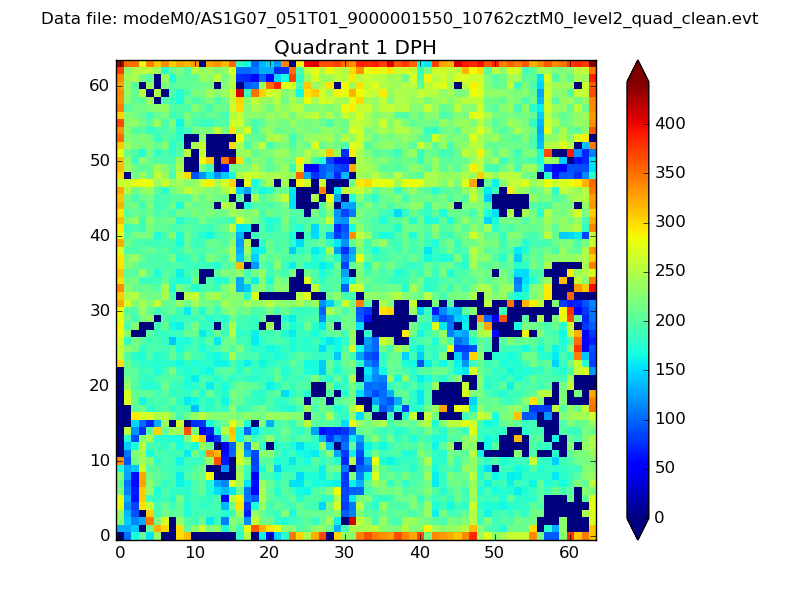 |
Quadrant B |
|---|---|---|---|
| Quadrant D | 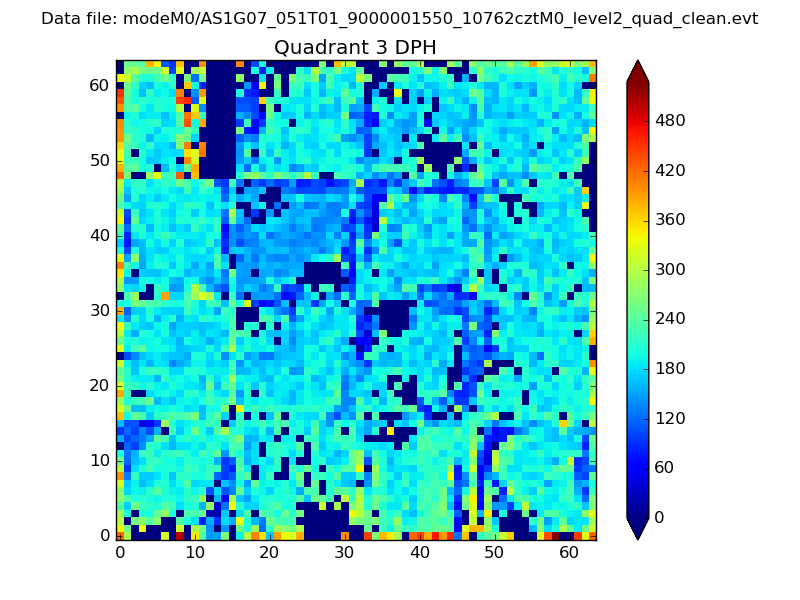 |
 |
Quadrant C |
| Plot type | Count rate plots | Images |
|---|---|---|
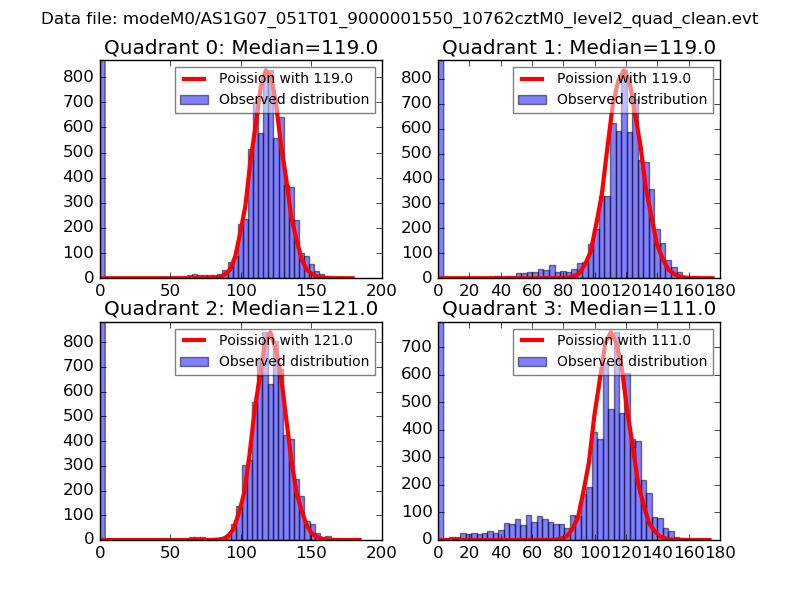
| Comparison with Poisson distribution Blue bars denote a histogram of data divided into 1 sec bins. Red curve is a Poisson curve with rate = median count rate of data. |
 |
 |
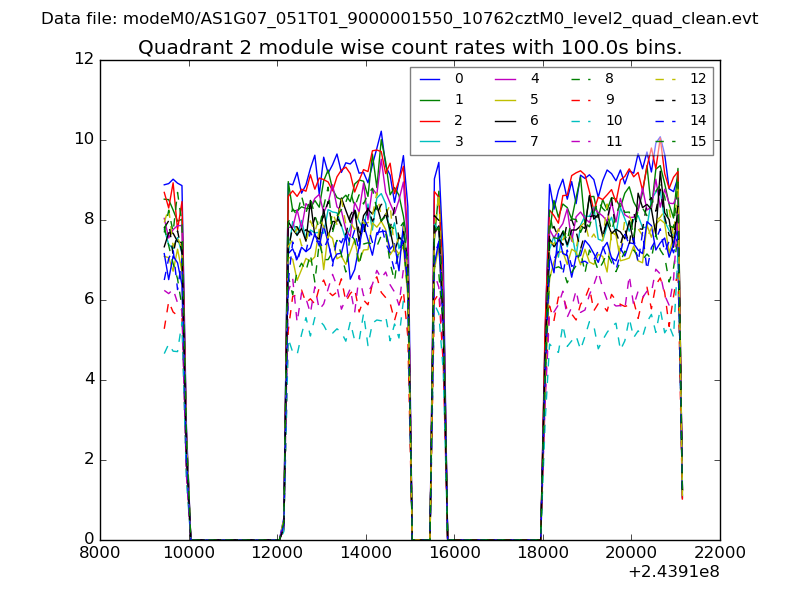
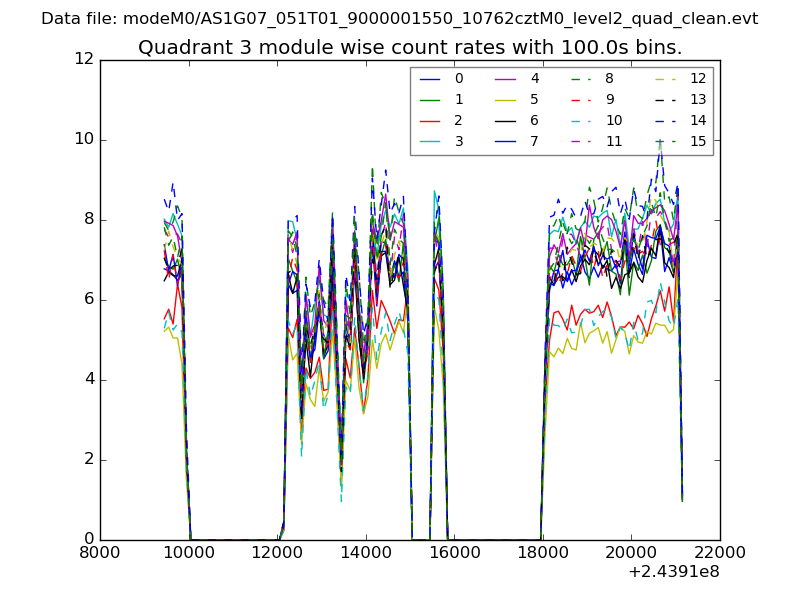
| Quadrant-wise count rates Data is divided into 100 sec bins |
 |
|
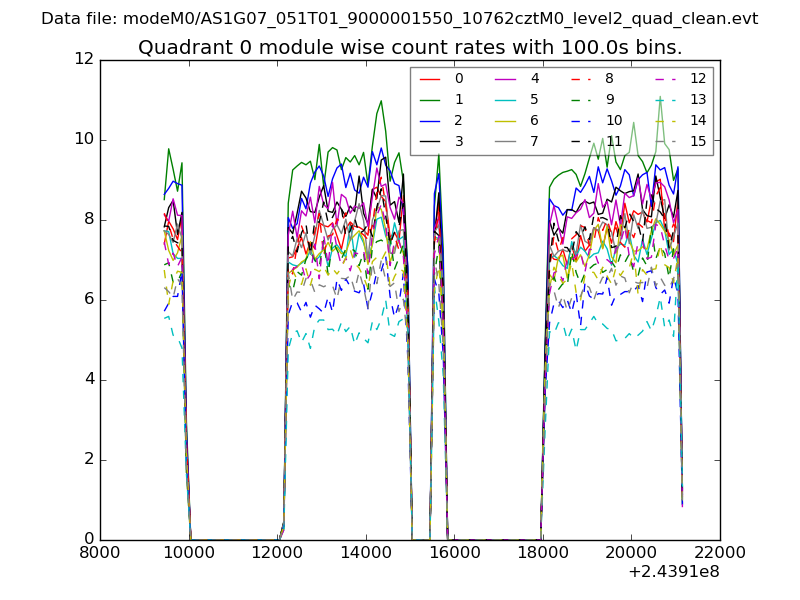
| Module-wise count rates for Quadrant A Data is divided into 100 sec bins |
 |
 |
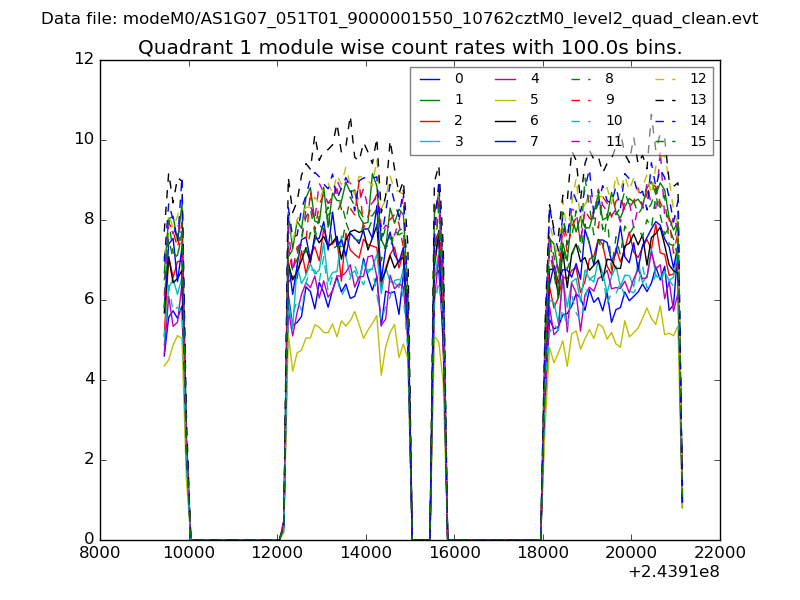
| Module-wise count rates for Quadrant B Data is divided into 100 sec bins |
 |
 |
| Module-wise count rates for Quadrant C Data is divided into 100 sec bins |
 |
 |
| Module-wise count rates for Quadrant D Data is divided into 100 sec bins |
 |
 |
| Parameter | Plot |
|---|---|
| CZT HV Monitor | 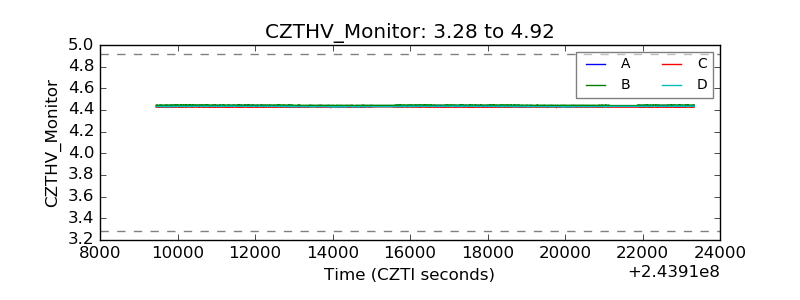 |
| D_VDD | 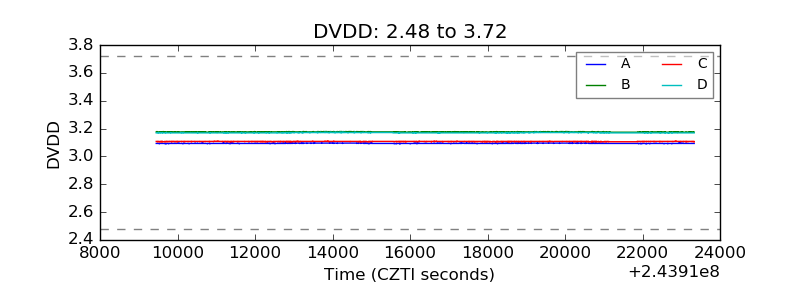 |
| Temperature 1 | 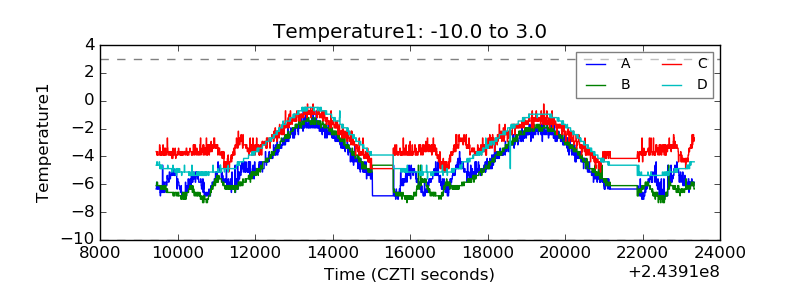 |
| Veto HV Monitor | 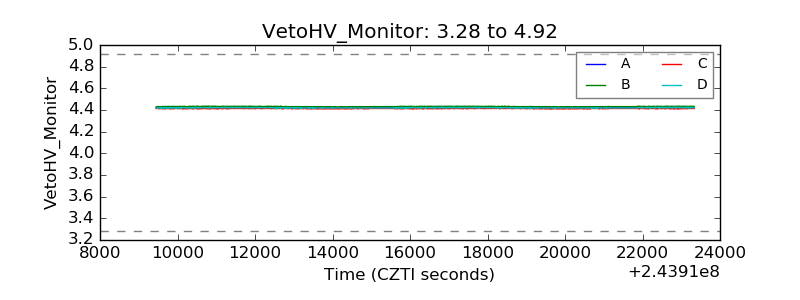 |
| Veto LLD | 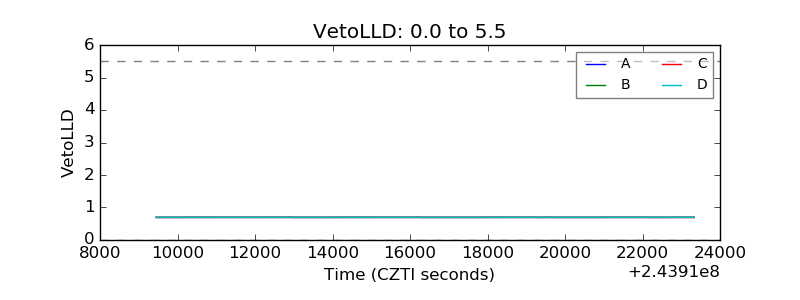 |
| Alpha Counter | 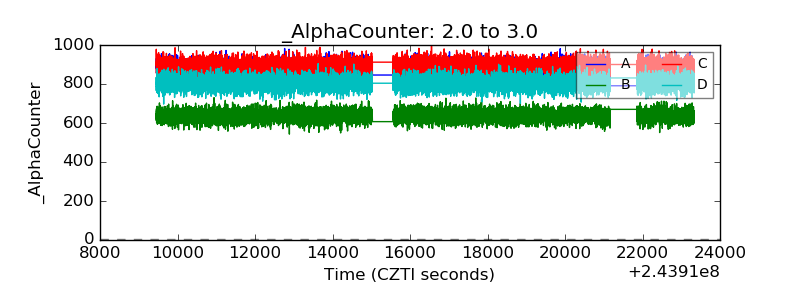 |
| _CPM_Rate | 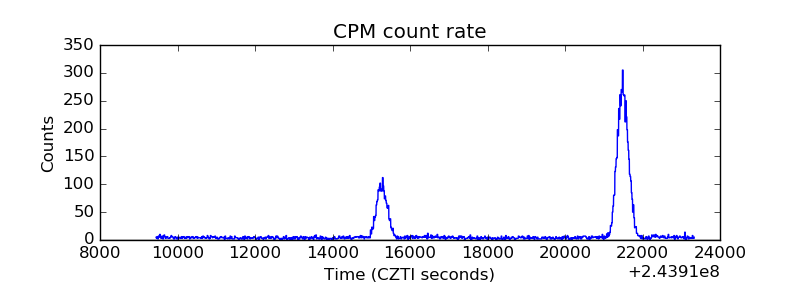 |
| CZT Counter |  |
| +2.5 Volts monitor |  |
| +5 Volts monitor |  |
| _ROLL_ROT | 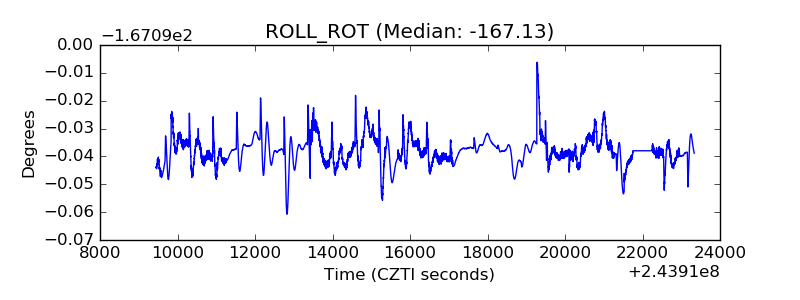 |
| _Roll_DEC | 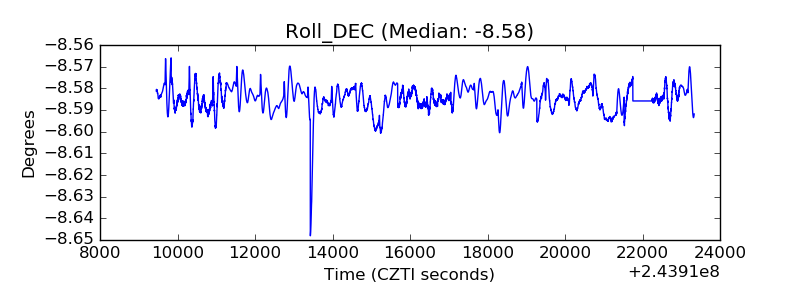 |
| _Roll_RA | 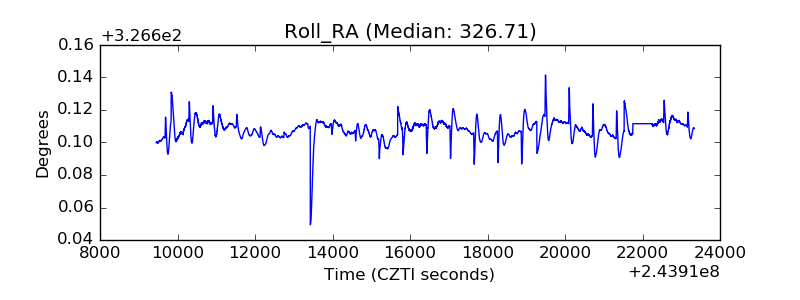 |
| Veto Counter | 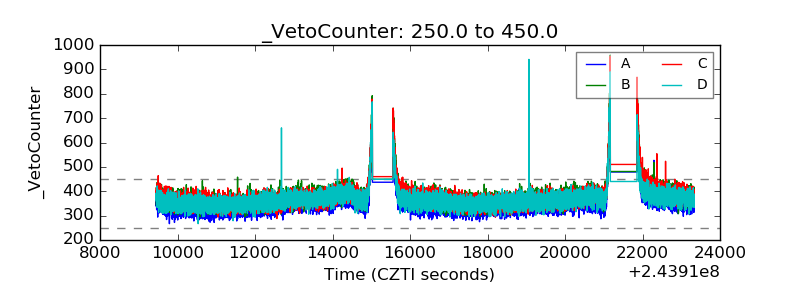 |