| Param | Original file | Final file |
|---|---|---|
| Filename | modeM0/AS1G07_051T01_9000001550_10763cztM0_level2.evt | modeM0/AS1G07_051T01_9000001550_10763cztM0_level2_quad_clean.evt |
| Size (bytes) | 605,134,080 | 66,931,200 |
| Size | 577.1 MB | 63.8 MB |
| Events in quadrant A | 3,224,300 | 396,633 |
| Events in quadrant B | 6,503,369 | 390,217 |
| Events in quadrant C | 3,060,542 | 398,392 |
| Events in quadrant D | 5,080,543 | 370,058 |
| Mode SS | |||
|---|---|---|---|
| Quadrant | BADHDUFLAG | Total packets | Discarded packets |
| A | 0 | 138 | 0 |
| B | 0 | 138 | 0 |
| C | 0 | 138 | 0 |
| D | 0 | 138 | 0 |
| Mode M9 | |||
|---|---|---|---|
| Quadrant | BADHDUFLAG | Total packets | Discarded packets |
| A | 0 | 9 | 0 |
| B | 0 | 9 | 0 |
| C | 0 | 9 | 0 |
| D | 0 | 10 | 0 |
| Mode M0 | |||
|---|---|---|---|
| Quadrant | BADHDUFLAG | Total packets | Discarded packets |
| A | 0 | 14033 | 3 |
| B | 0 | 23962 | 2 |
| C | 0 | 13767 | 2 |
| D | 0 | 19465 | 2 |
| Quadrant | Total seconds | Saturated seconds | Saturation percentage |
|---|---|---|---|
| A | 6754 | 50 | 0.740302% |
| B | 6754 | 898 | 13.295825% |
| C | 6754 | 43 | 0.636660% |
| D | 6754 | 556 | 8.232159% |
Noise dominated data is calculated using 1-second bins in cleaned event files. If a bin has >2000 counts, and if more than 50% of those come from <1% of pixels, then it is considered to be noise-dominated and hence unusable.
| Quadrant | # 1 sec bins | Bins with >0 counts | Bins with >2000 counts | High rate bins dominated by noise | Noise dominated (total time) | Noise dominated (detector-on time) | Marked lightcurve |
|---|---|---|---|---|---|---|---|
| A | 7649 | 6755 | 0 | 0 | 0.00% | 0.00% | 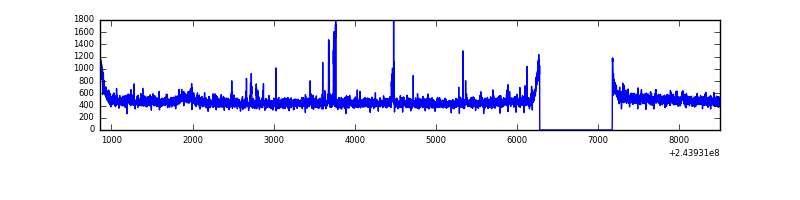 |
| B | 7649 | 6754 | 378 | 378 | 4.94% | 5.60% | 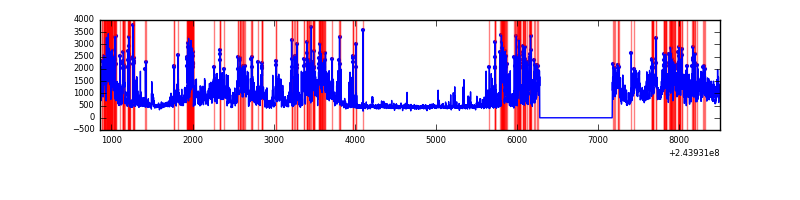 |
| C | 7649 | 6755 | 0 | 0 | 0.00% | 0.00% | 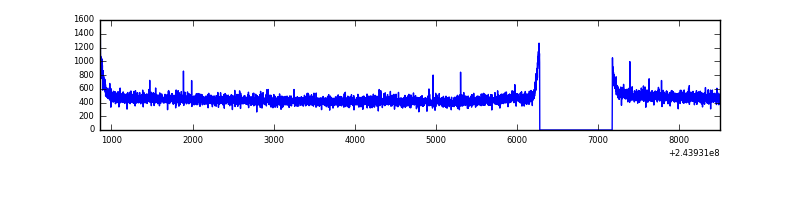 |
| D | 7649 | 6755 | 442 | 442 | 5.78% | 6.54% | 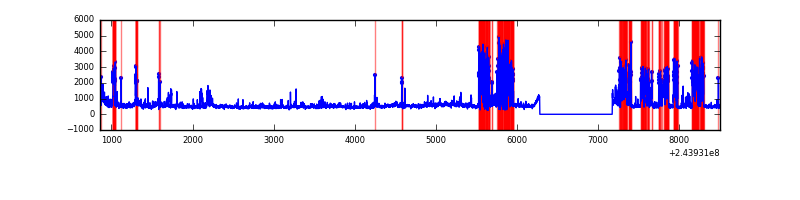 |
Top three noisy pixels from each quadrant. If the there are fewer than three noisy pixels in the level2.evt file, extra rows are filled as -1
| Pixel properties | Quadrant properties | ||||||
|---|---|---|---|---|---|---|---|
| Quadrant | DetID | PixID | Counts | Sigma | Mean | Median | Sigma |
| A | 15 | 239 | 82323 | 495.13 | 803 | 785 | 164.7 |
| A | 1 | 162 | 15769 | 90.99 | 803 | 785 | 164.7 |
| A | 15 | 174 | 15429 | 88.92 | 803 | 785 | 164.7 |
| B | 0 | 85 | 2603094 | 17312.88 | 779 | 759 | 150.3 |
| B | 4 | 239 | 724608 | 4815.64 | 779 | 759 | 150.3 |
| B | 4 | 81 | 80449 | 530.16 | 779 | 759 | 150.3 |
| C | 13 | 61 | 5834 | 27.58 | 784 | 787 | 183.0 |
| C | 14 | 234 | 2817 | 11.09 | 784 | 787 | 183.0 |
| C | 5 | 207 | 2203 | 7.74 | 784 | 787 | 183.0 |
| D | 10 | 157 | 1383245 | 7531.42 | 755 | 733 | 183.6 |
| D | 1 | 52 | 331159 | 1800.04 | 755 | 733 | 183.6 |
| D | 8 | 195 | 171547 | 930.53 | 755 | 733 | 183.6 |
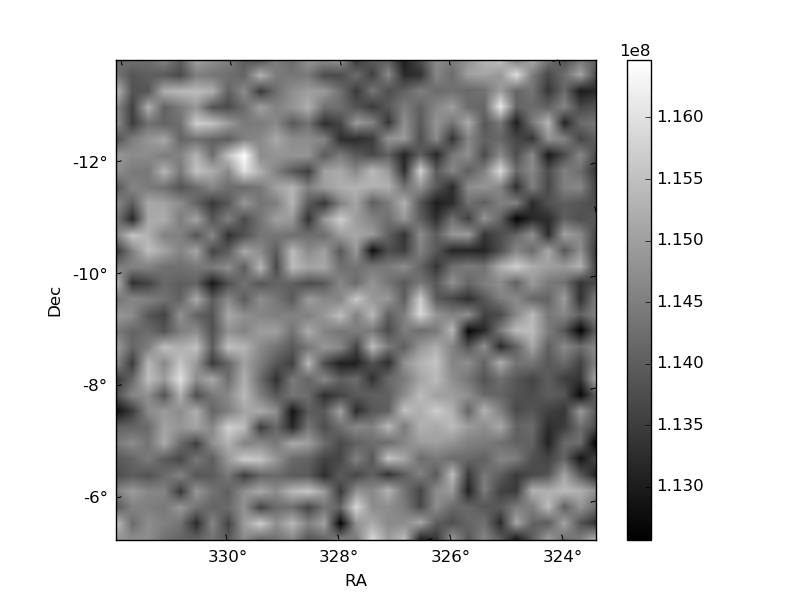
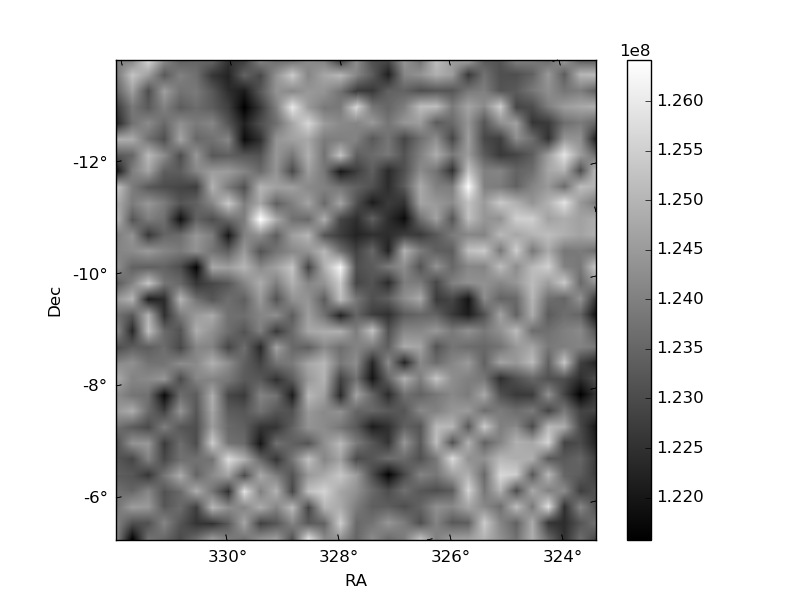
Histogram calculated using DETX and DETY for each event in the final _common_clean file
| Quadrant A | 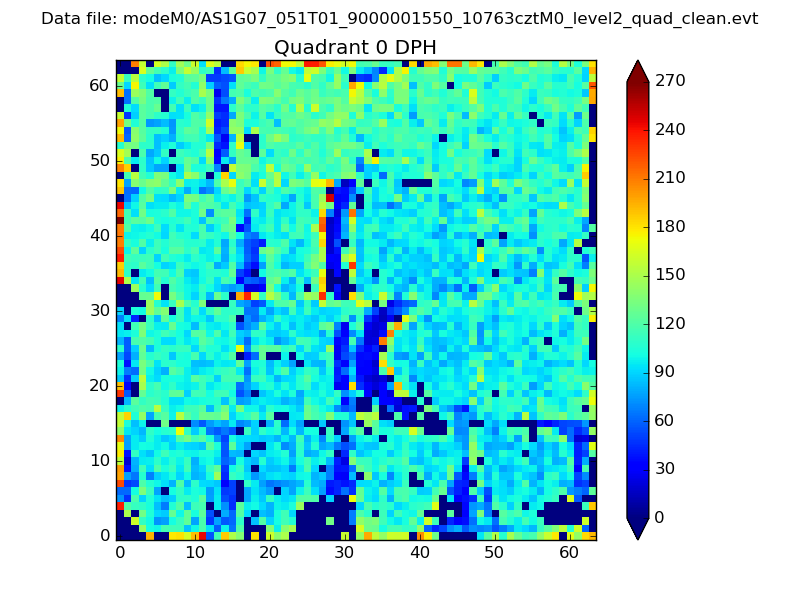 |
 |
Quadrant B |
|---|---|---|---|
| Quadrant D | 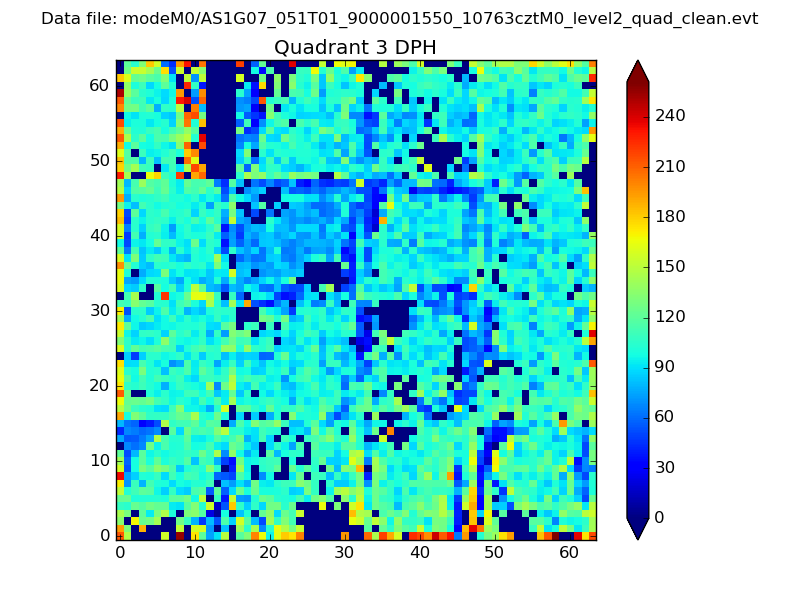 |
 |
Quadrant C |
| Plot type | Count rate plots | Images |
|---|---|---|
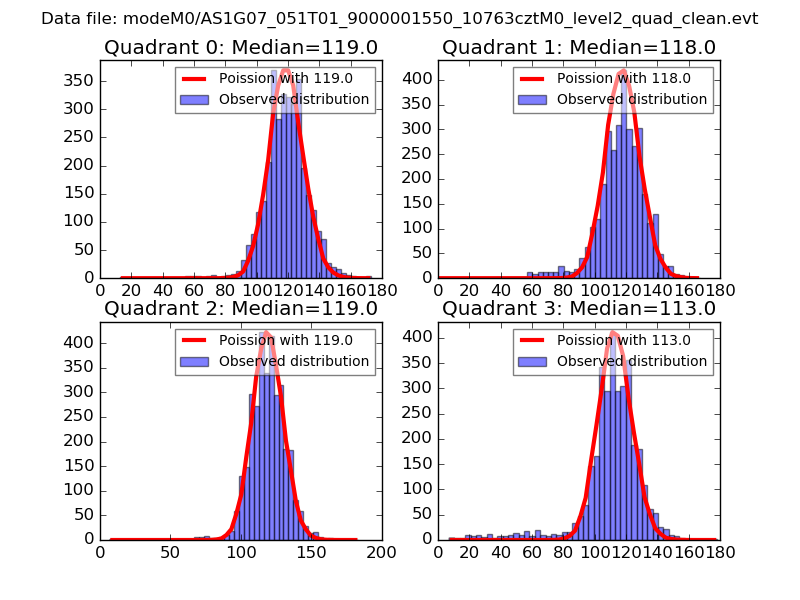
| Comparison with Poisson distribution Blue bars denote a histogram of data divided into 1 sec bins. Red curve is a Poisson curve with rate = median count rate of data. |
 |
 |
| Quadrant-wise count rates Data is divided into 100 sec bins |
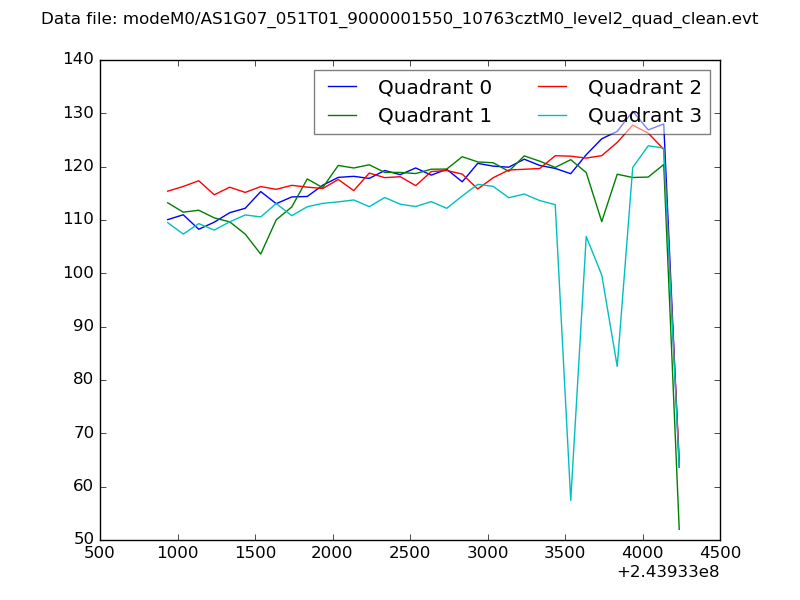 |
|
| Module-wise count rates for Quadrant A Data is divided into 100 sec bins |
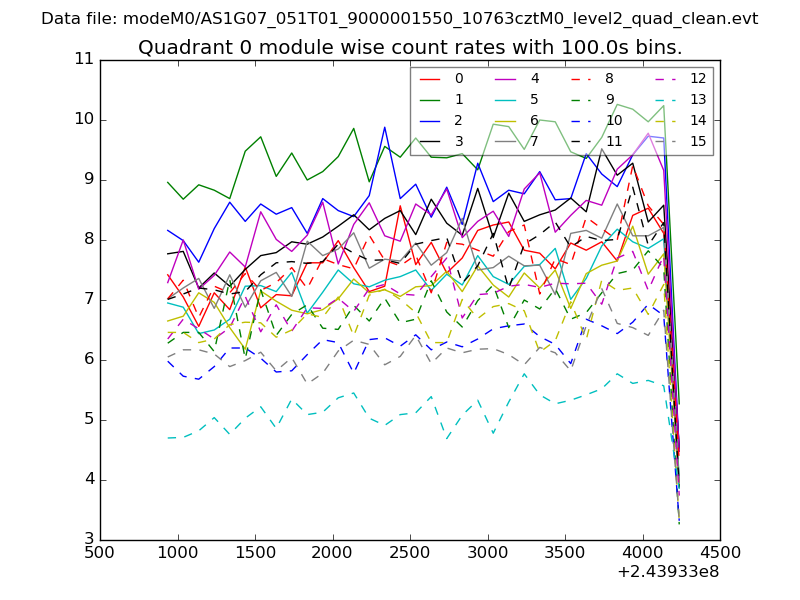 |
 |
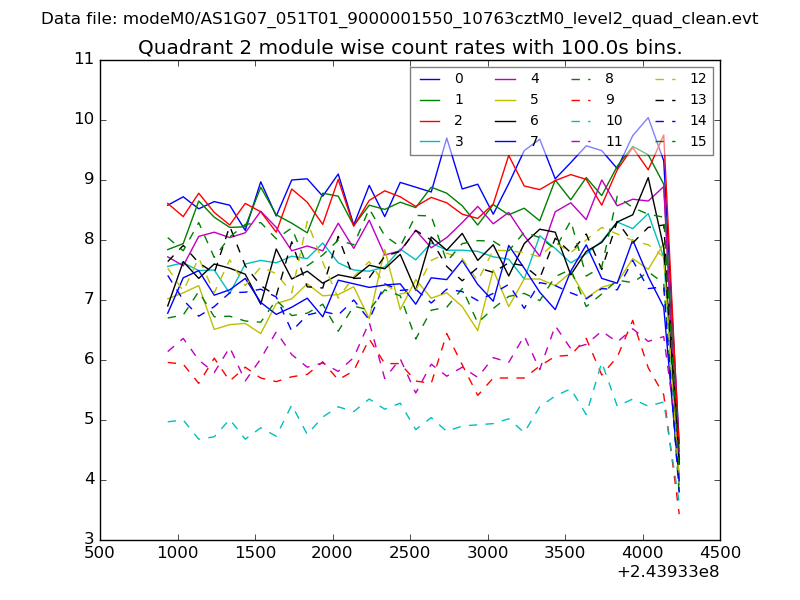
| Module-wise count rates for Quadrant B Data is divided into 100 sec bins |
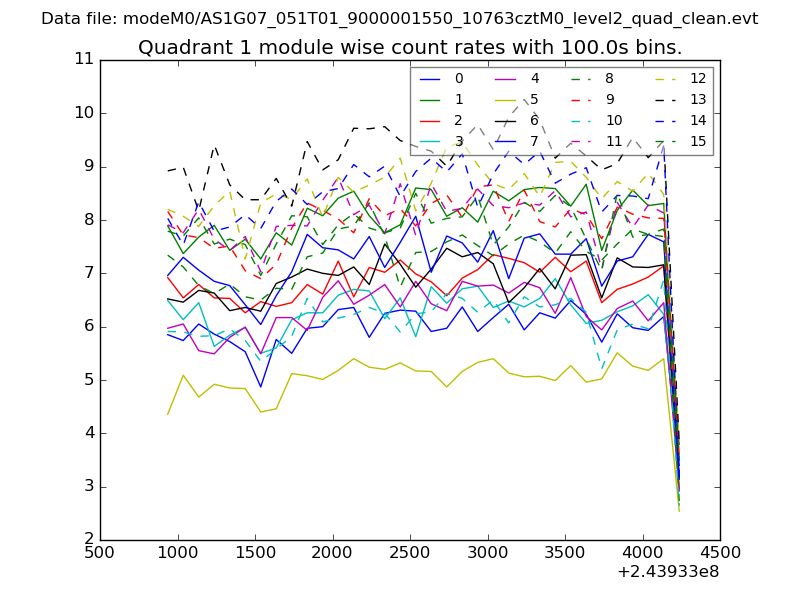 |
 |
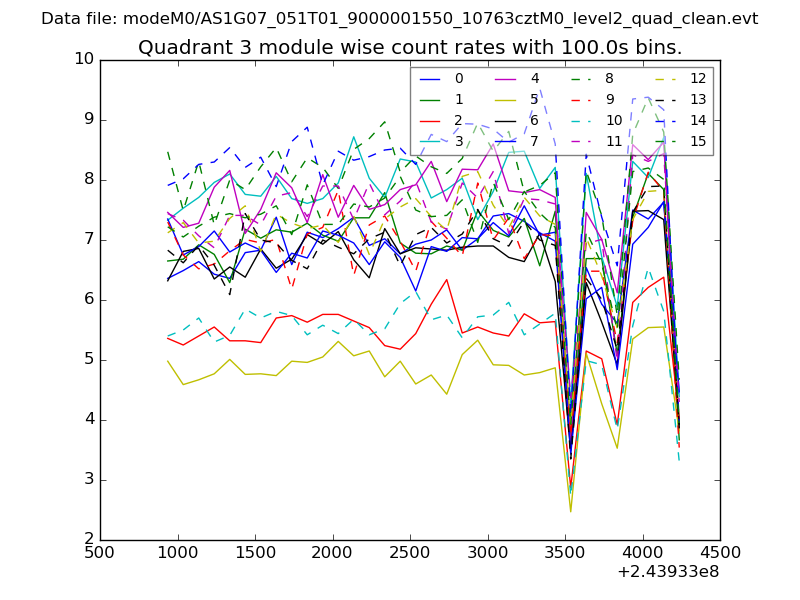
| Module-wise count rates for Quadrant C Data is divided into 100 sec bins |
 |
 |
| Module-wise count rates for Quadrant D Data is divided into 100 sec bins |
 |
 |
| Parameter | Plot |
|---|---|
| CZT HV Monitor | 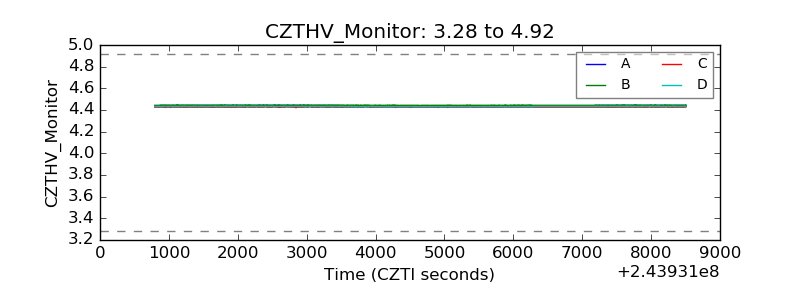 |
| D_VDD | 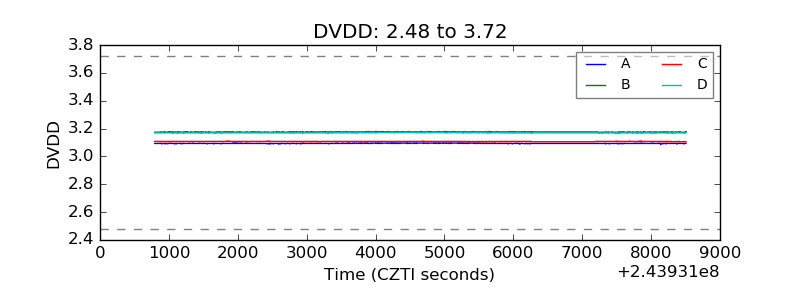 |
| Temperature 1 | 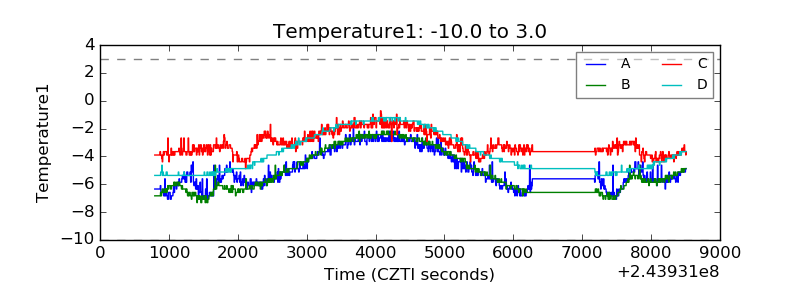 |
| Veto HV Monitor | 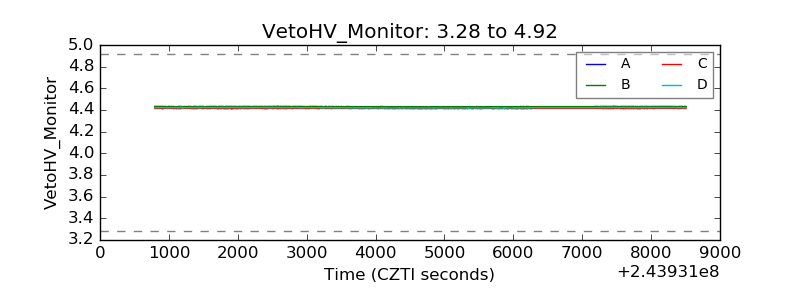 |
| Veto LLD | 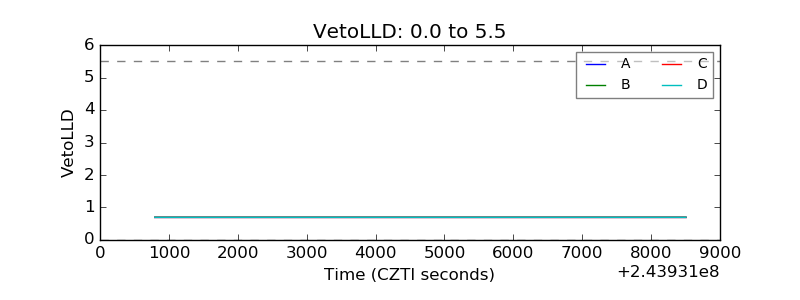 |
| Alpha Counter | 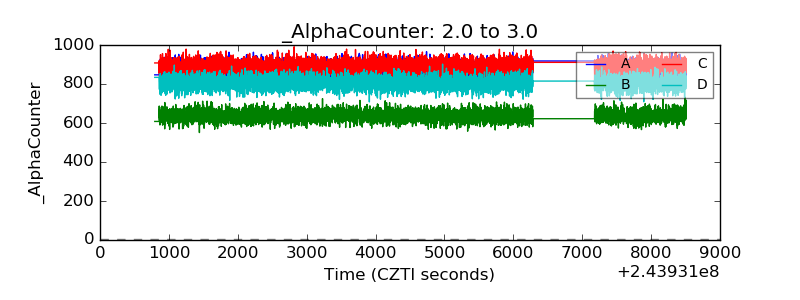 |
| _CPM_Rate | 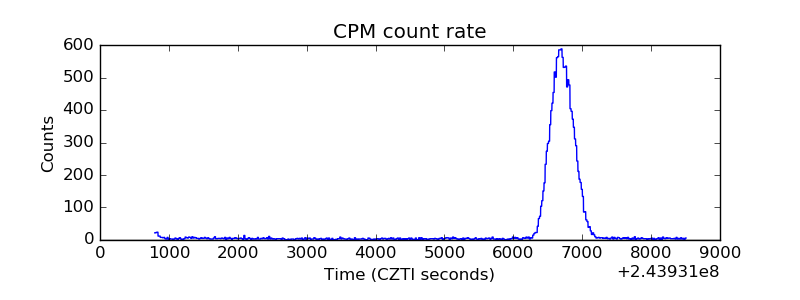 |
| CZT Counter |  |
| +2.5 Volts monitor |  |
| +5 Volts monitor |  |
| _ROLL_ROT | 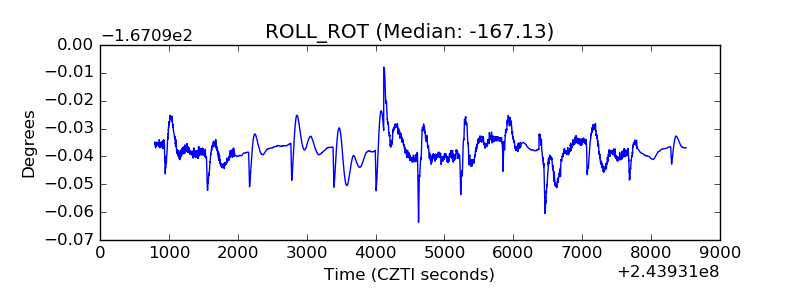 |
| _Roll_DEC | 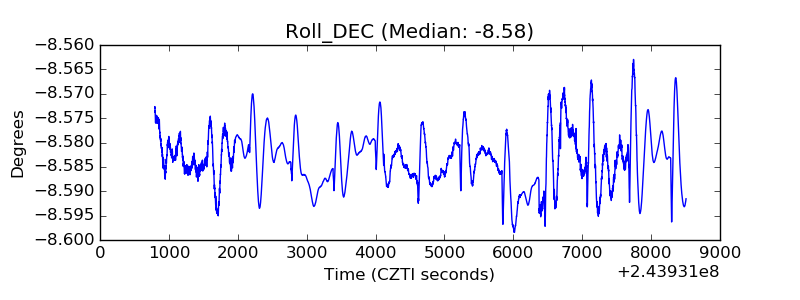 |
| _Roll_RA | 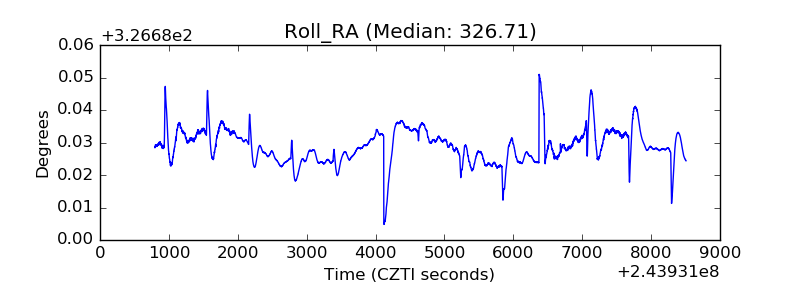 |
| Veto Counter | 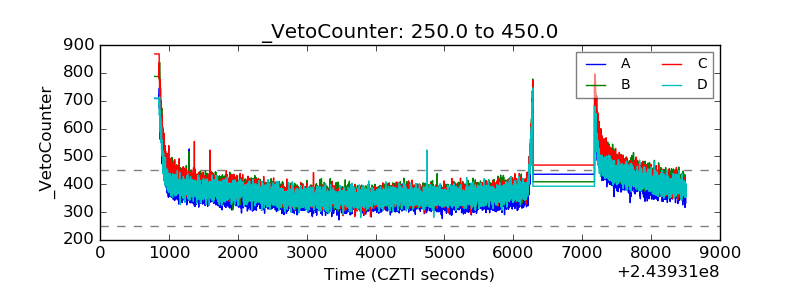 |