| Param | Original file | Final file |
|---|---|---|
| Filename | modeM0/AS1G07_051T01_9000001550_10764cztM0_level2.evt | modeM0/AS1G07_051T01_9000001550_10764cztM0_level2_quad_clean.evt |
| Size (bytes) | 365,123,520 | 47,620,800 |
| Size | 348.2 MB | 45.4 MB |
| Events in quadrant A | 1,923,321 | 291,590 |
| Events in quadrant B | 3,496,752 | 291,144 |
| Events in quadrant C | 1,843,145 | 294,168 |
| Events in quadrant D | 3,517,708 | 277,957 |
| Mode SS | |||
|---|---|---|---|
| Quadrant | BADHDUFLAG | Total packets | Discarded packets |
| A | 0 | 84 | 0 |
| B | 0 | 84 | 0 |
| C | 0 | 84 | 0 |
| D | 0 | 84 | 0 |
| Mode M9 | |||
|---|---|---|---|
| Quadrant | BADHDUFLAG | Total packets | Discarded packets |
| A | 0 | 9 | 0 |
| B | 0 | 9 | 0 |
| C | 0 | 9 | 0 |
| D | 0 | 9 | 0 |
| Mode M0 | |||
|---|---|---|---|
| Quadrant | BADHDUFLAG | Total packets | Discarded packets |
| A | 0 | 8343 | 1 |
| B | 0 | 13196 | 1 |
| C | 0 | 8293 | 1 |
| D | 0 | 13099 | 1 |
| Quadrant | Total seconds | Saturated seconds | Saturation percentage |
|---|---|---|---|
| A | 4063 | 28 | 0.689146% |
| B | 4063 | 405 | 9.968004% |
| C | 4063 | 28 | 0.689146% |
| D | 4063 | 336 | 8.269751% |
Noise dominated data is calculated using 1-second bins in cleaned event files. If a bin has >2000 counts, and if more than 50% of those come from <1% of pixels, then it is considered to be noise-dominated and hence unusable.
| Quadrant | # 1 sec bins | Bins with >0 counts | Bins with >2000 counts | High rate bins dominated by noise | Noise dominated (total time) | Noise dominated (detector-on time) | Marked lightcurve |
|---|---|---|---|---|---|---|---|
| A | 4958 | 4064 | 0 | 0 | 0.00% | 0.00% | 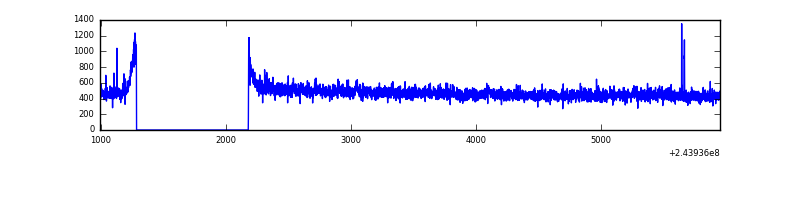 |
| B | 4958 | 4063 | 126 | 126 | 2.54% | 3.10% | 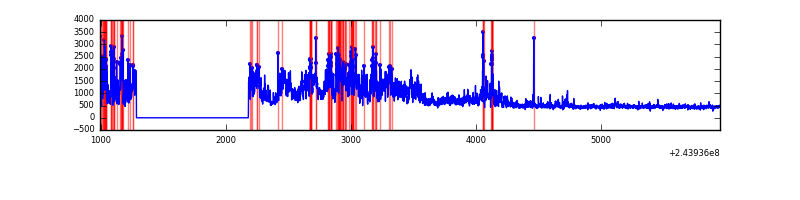 |
| C | 4958 | 4064 | 0 | 0 | 0.00% | 0.00% | 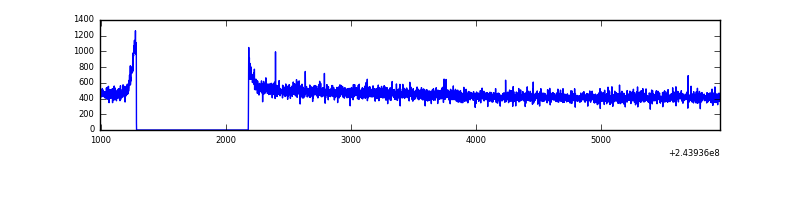 |
| D | 4958 | 4064 | 264 | 264 | 5.32% | 6.50% | 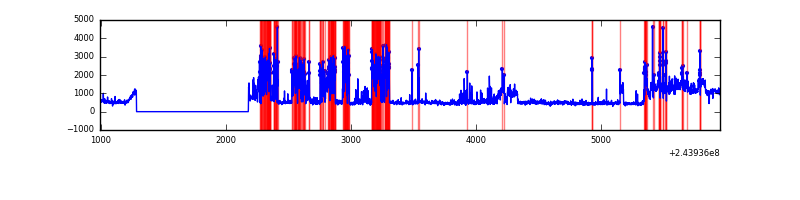 |
Top three noisy pixels from each quadrant. If the there are fewer than three noisy pixels in the level2.evt file, extra rows are filled as -1
| Pixel properties | Quadrant properties | ||||||
|---|---|---|---|---|---|---|---|
| Quadrant | DetID | PixID | Counts | Sigma | Mean | Median | Sigma |
| A | 15 | 239 | 15974 | 151.93 | 488 | 476 | 102.0 |
| A | 1 | 162 | 12855 | 121.36 | 488 | 476 | 102.0 |
| A | 14 | 254 | 5459 | 48.85 | 488 | 476 | 102.0 |
| B | 0 | 85 | 1269991 | 13810.54 | 475 | 463 | 91.9 |
| B | 4 | 239 | 301092 | 3270.39 | 475 | 463 | 91.9 |
| B | 4 | 81 | 25525 | 272.64 | 475 | 463 | 91.9 |
| C | 13 | 61 | 3467 | 26.91 | 472 | 473 | 111.3 |
| C | 14 | 234 | 1950 | 13.28 | 472 | 473 | 111.3 |
| C | 12 | 4 | 1330 | 7.7 | 472 | 473 | 111.3 |
| D | 10 | 157 | 1391041 | 12362.09 | 460 | 446 | 112.5 |
| D | 1 | 52 | 239803 | 2127.83 | 460 | 446 | 112.5 |
| D | 8 | 195 | 59022 | 520.72 | 460 | 446 | 112.5 |
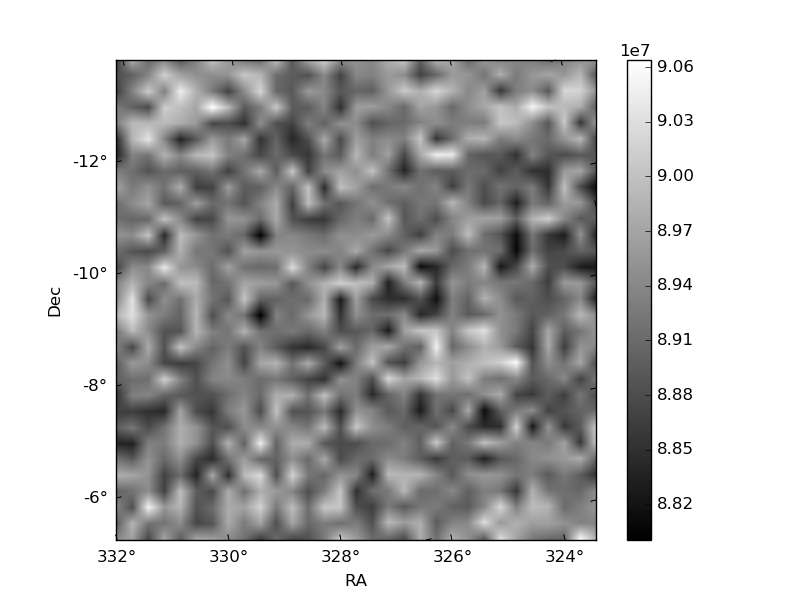
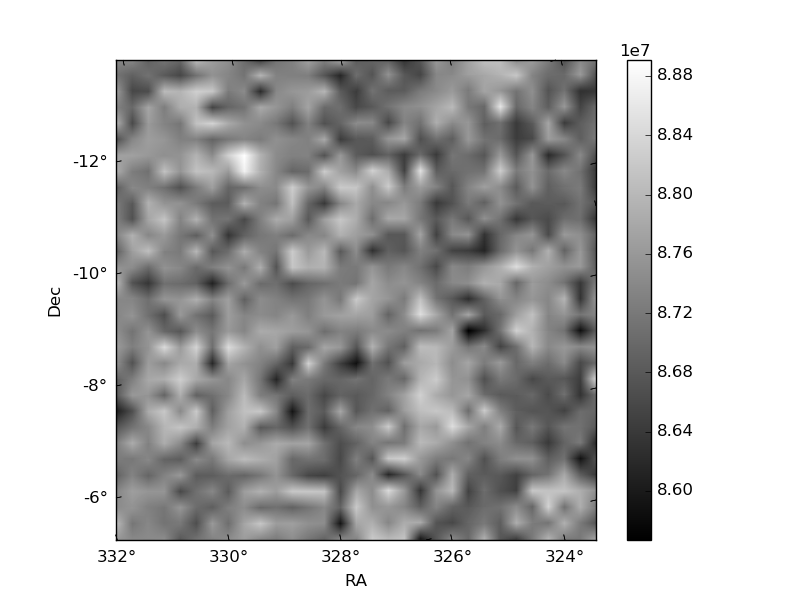
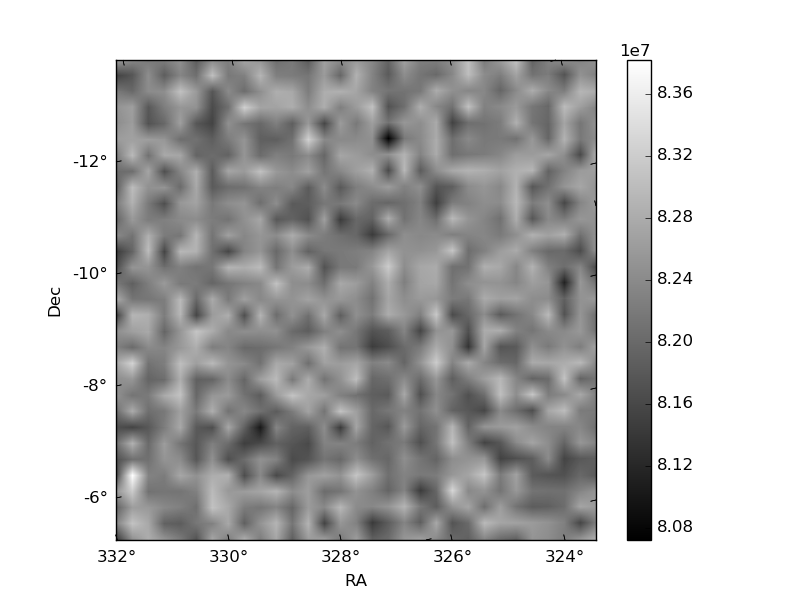
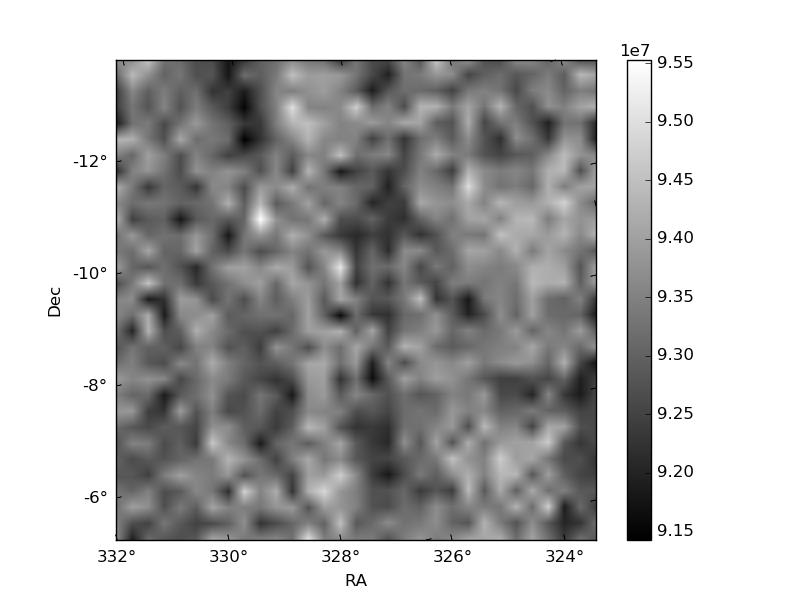
Histogram calculated using DETX and DETY for each event in the final _common_clean file
| Quadrant A | 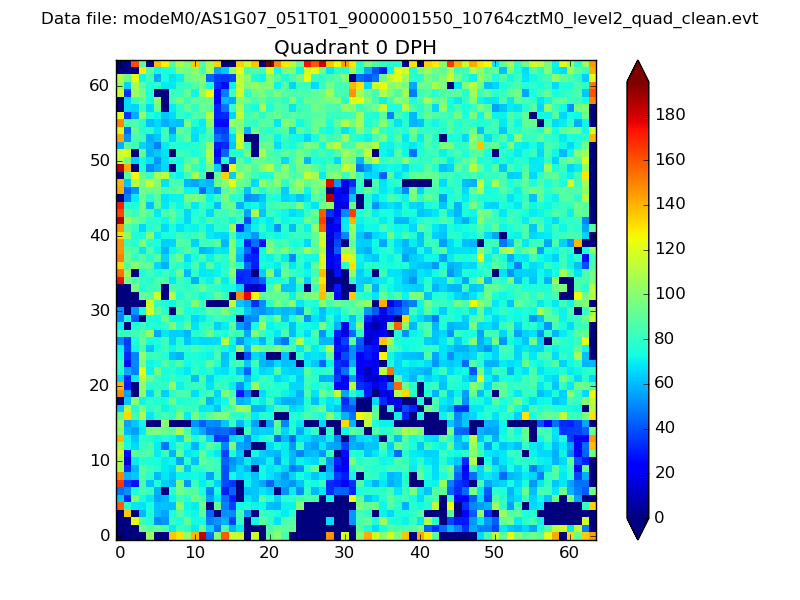 |
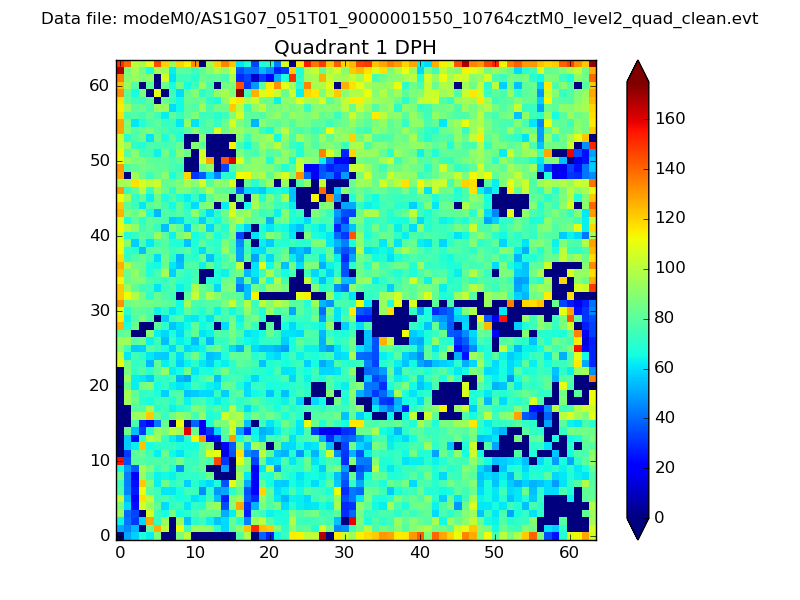 |
Quadrant B |
|---|---|---|---|
| Quadrant D | 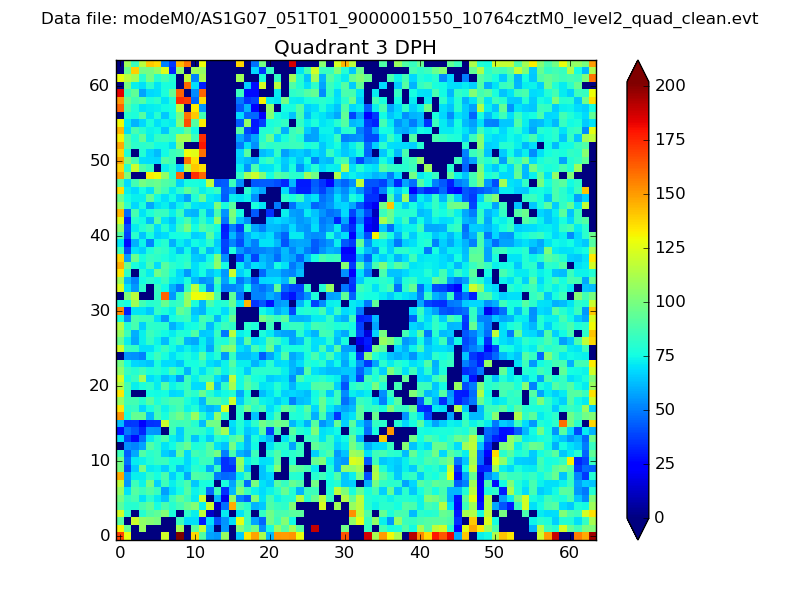 |
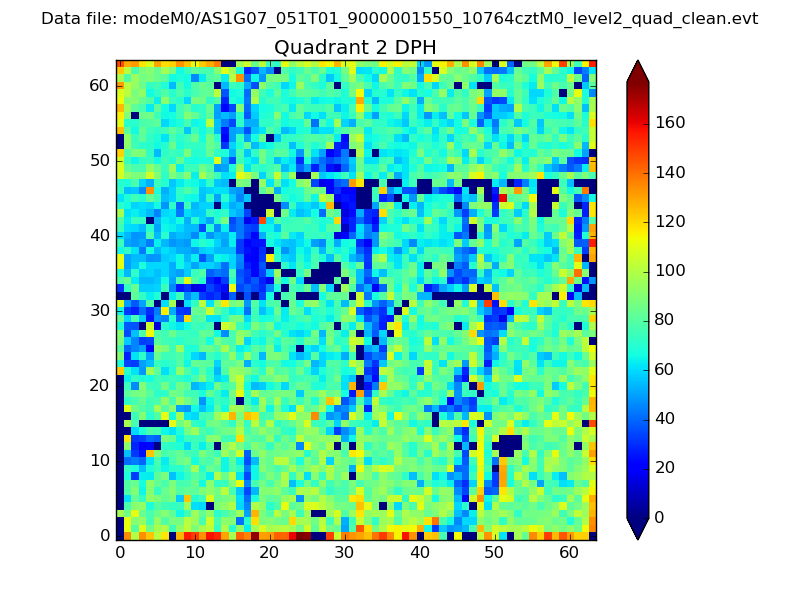 |
Quadrant C |
| Plot type | Count rate plots | Images |
|---|---|---|
| Comparison with Poisson distribution Blue bars denote a histogram of data divided into 1 sec bins. Red curve is a Poisson curve with rate = median count rate of data. |
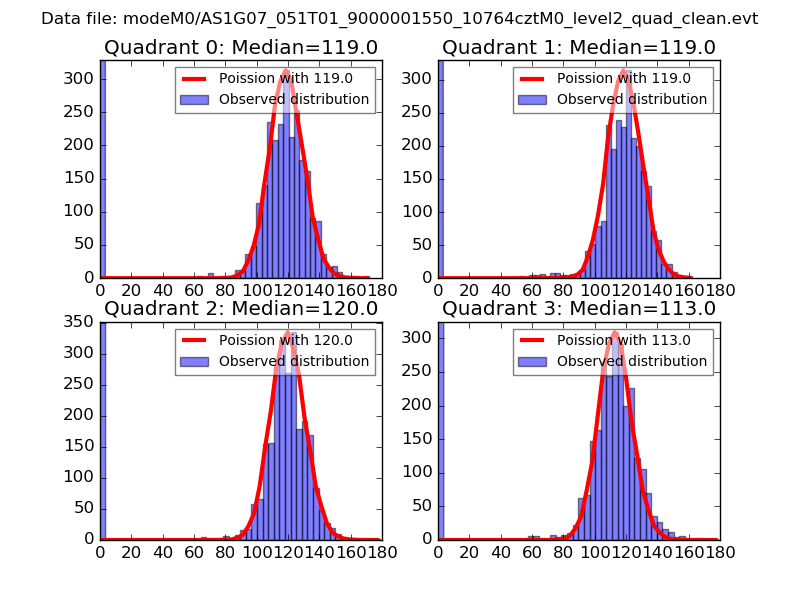 |
 |
| Quadrant-wise count rates Data is divided into 100 sec bins |
 |
|
| Module-wise count rates for Quadrant A Data is divided into 100 sec bins |
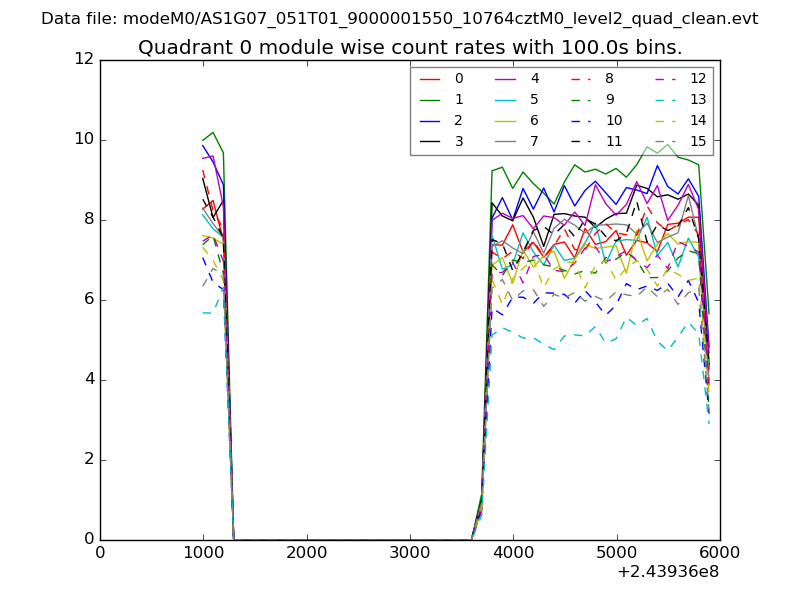 |
 |
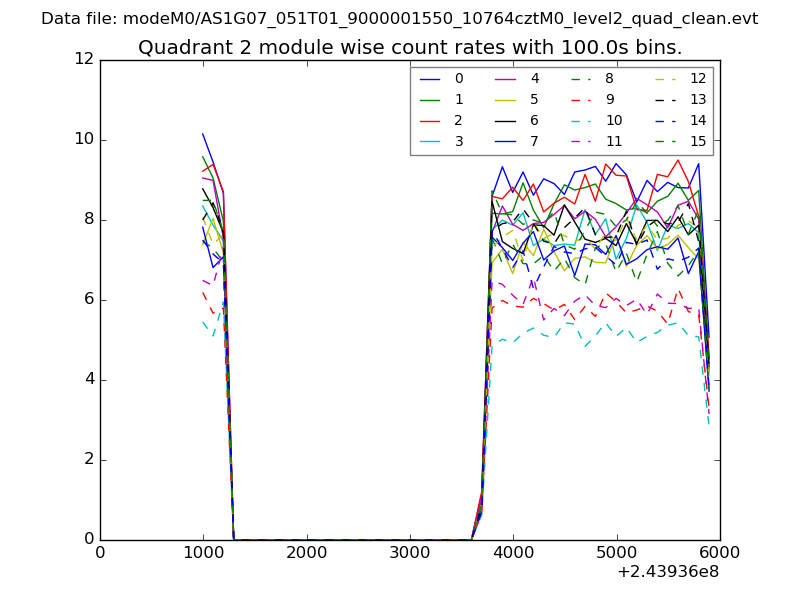
| Module-wise count rates for Quadrant B Data is divided into 100 sec bins |
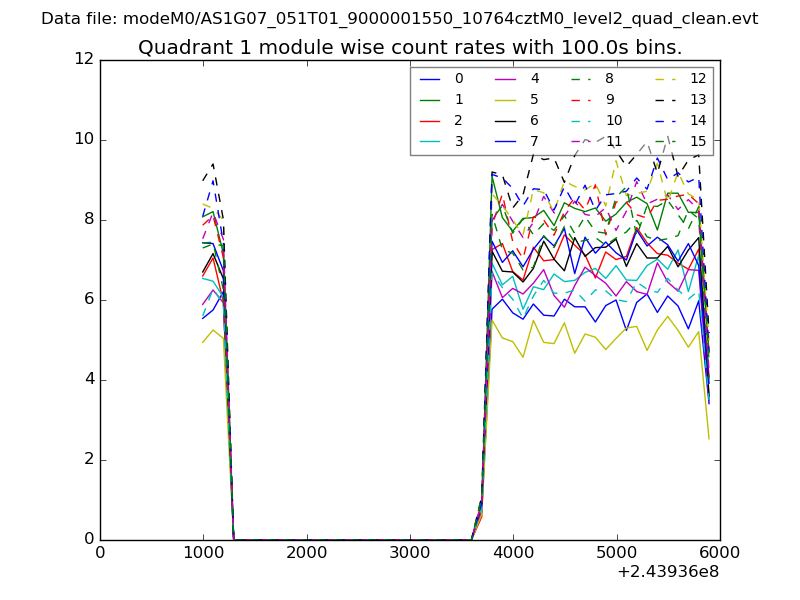 |
 |
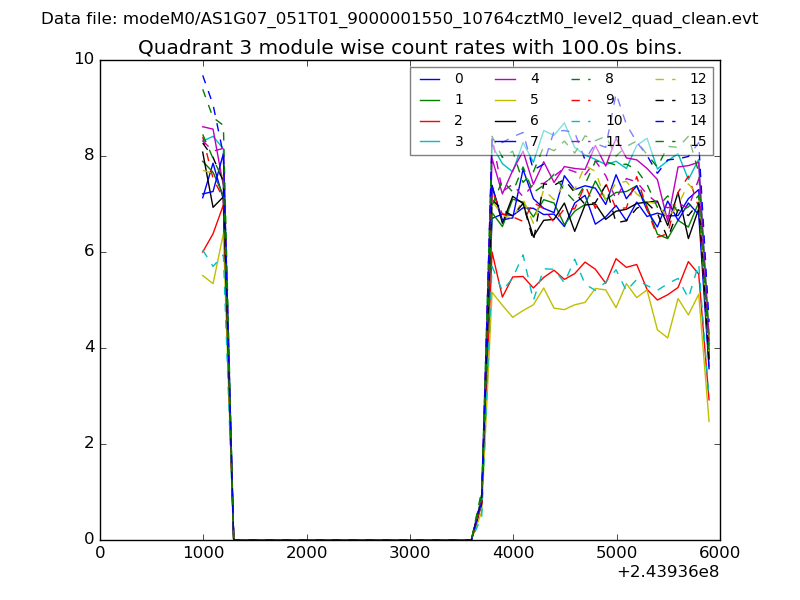
| Module-wise count rates for Quadrant C Data is divided into 100 sec bins |
 |
 |
| Module-wise count rates for Quadrant D Data is divided into 100 sec bins |
 |
 |
| Parameter | Plot |
|---|---|
| CZT HV Monitor | 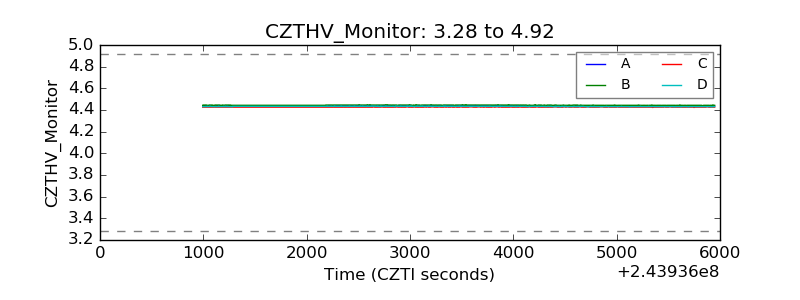 |
| D_VDD | 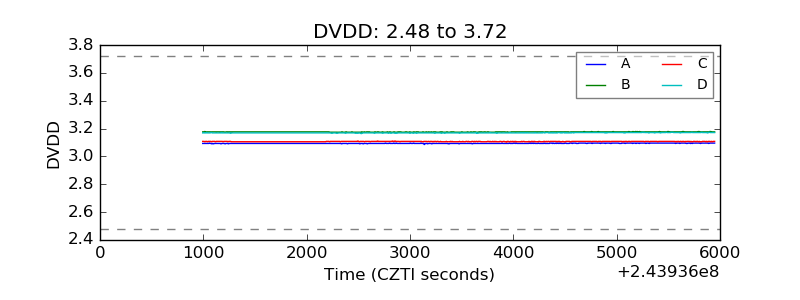 |
| Temperature 1 | 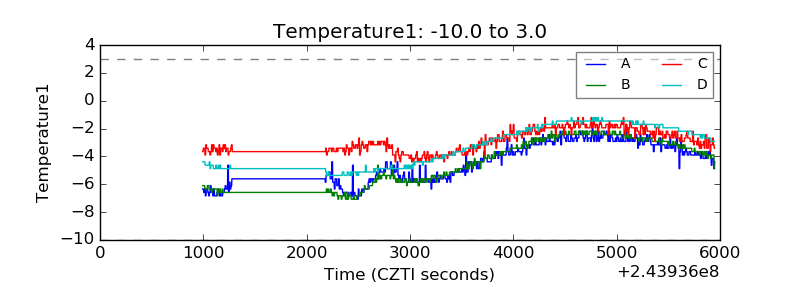 |
| Veto HV Monitor | 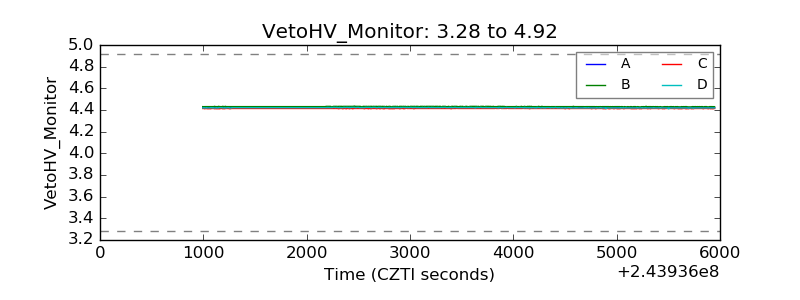 |
| Veto LLD |  |
| Alpha Counter |  |
| _CPM_Rate | 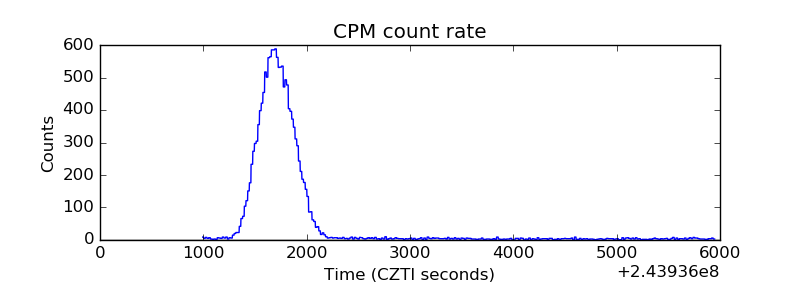 |
| CZT Counter | 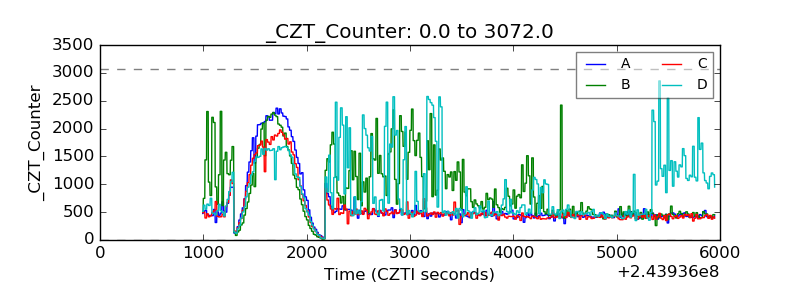 |
| +2.5 Volts monitor |  |
| +5 Volts monitor |  |
| _ROLL_ROT | 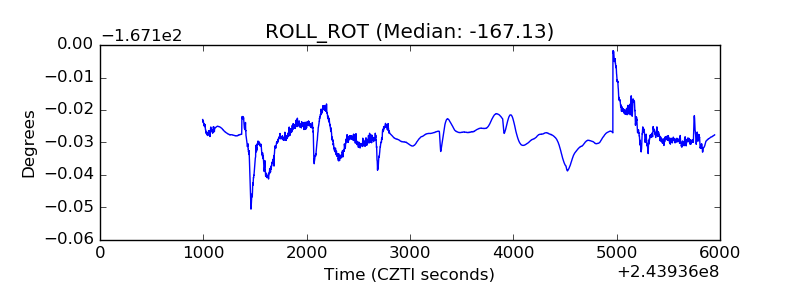 |
| _Roll_DEC | 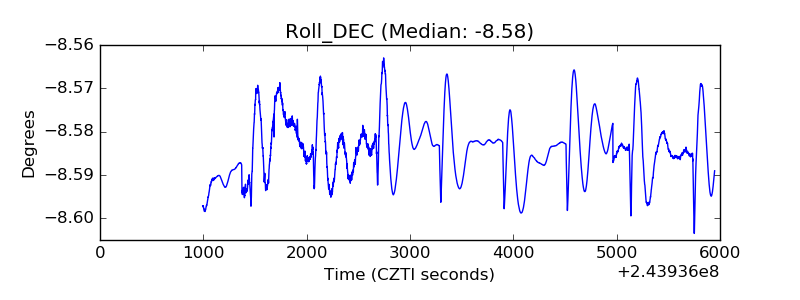 |
| _Roll_RA | 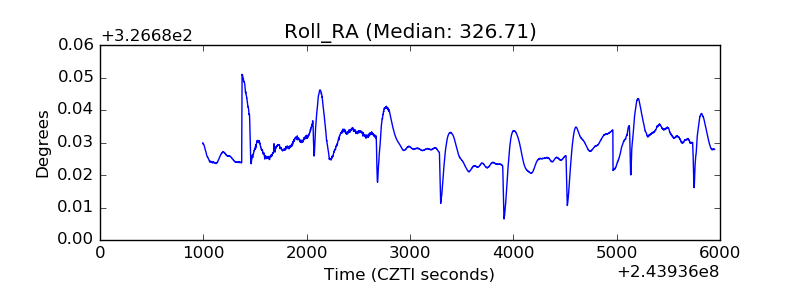 |
| Veto Counter | 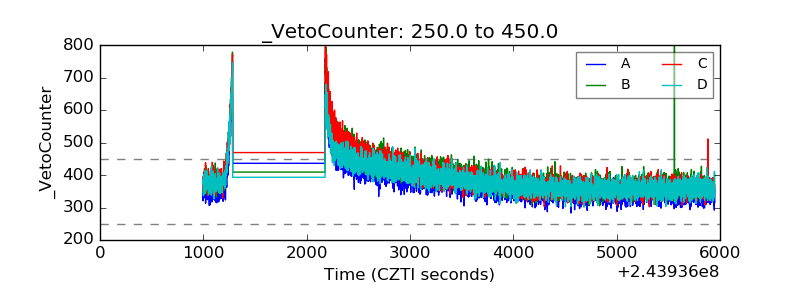 |