| Param | Original file | Final file |
|---|---|---|
| Filename | modeM0/AS1G07_014T02_9000001556cztM0_level2.fits | modeM0/AS1G07_014T02_9000001556cztM0_level2_quad_clean.evt |
| Size (bytes) | 467,864,640 | 459,023,040 |
| Size | 446.2 MB | 437.8 MB |
| Events in quadrant A | 2,819,122 | 2,737,917 |
| Events in quadrant B | 2,669,725 | 2,629,560 |
| Events in quadrant C | 2,812,526 | 2,642,149 |
| Events in quadrant D | 2,365,942 | 2,392,308 |
| Mode SS | |||
|---|---|---|---|
| Quadrant | BADHDUFLAG | Total packets | Discarded packets |
| A | 0 | 1038 | 0 |
| B | 0 | 1046 | 0 |
| C | 0 | 1040 | 0 |
| D | 0 | 1042 | 0 |
| Mode M9 | |||
|---|---|---|---|
| Quadrant | BADHDUFLAG | Total packets | Discarded packets |
| A | 0 | 60 | 0 |
| B | 0 | 60 | 0 |
| C | 0 | 60 | 0 |
| D | 0 | 60 | 0 |
| Mode M0 | |||
|---|---|---|---|
| Quadrant | BADHDUFLAG | Total packets | Discarded packets |
| A | 0 | 106240 | 0 |
| B | 0 | 134002 | 0 |
| C | 0 | 104383 | 0 |
| D | 0 | 138094 | 0 |
| Quadrant | Total seconds | Saturated seconds | Saturation percentage |
|---|---|---|---|
| A | 51049 | 449 | 0.879547% |
| B | 51015 | 3202 | 6.276585% |
| C | 51104 | 381 | 0.745539% |
| D | 50786 | 1958 | 3.855393% |
Noise dominated data is calculated using 1-second bins in cleaned event files. If a bin has >2000 counts, and if more than 50% of those come from <1% of pixels, then it is considered to be noise-dominated and hence unusable.
| Quadrant | # 1 sec bins | Bins with >0 counts | Bins with >2000 counts | High rate bins dominated by noise | Noise dominated (total time) | Noise dominated (detector-on time) | Marked lightcurve |
|---|---|---|---|---|---|---|---|
| A | 58072 | 51623 | 0 | 0 | 0.00% | 0.00% | 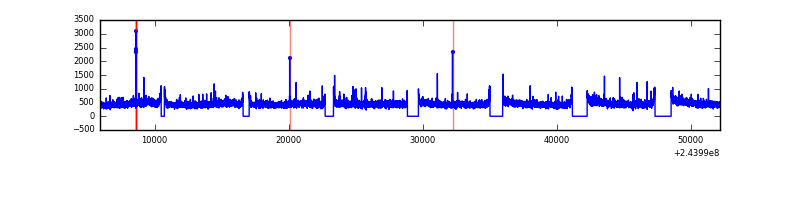 |
| B | 58072 | 51560 | 0 | 0 | 0.00% | 0.00% | 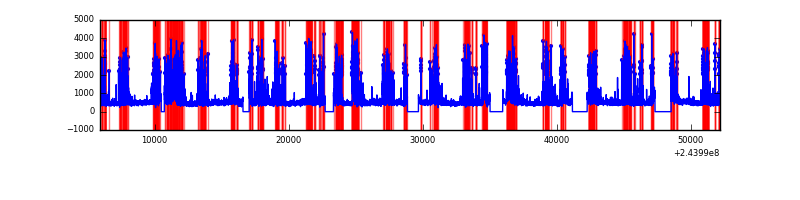 |
| C | 58072 | 51658 | 0 | 0 | 0.00% | 0.00% | 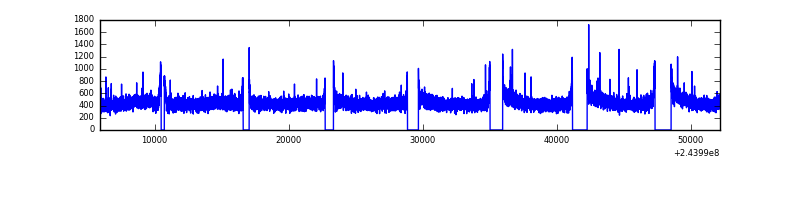 |
| D | 58072 | 51338 | 0 | 0 | 0.00% | 0.00% |  |
Top three noisy pixels from each quadrant. If the there are fewer than three noisy pixels in the level2.evt file, extra rows are filled as -1
| Pixel properties | Quadrant properties | ||||||
|---|---|---|---|---|---|---|---|
| Quadrant | DetID | PixID | Counts | Sigma | Mean | Median | Sigma |
| A | 0 | 29 | 2733 | 11.03 | 733 | 684 | 185.7 |
| A | 7 | 110 | 2358 | 9.01 | 733 | 684 | 185.7 |
| A | 9 | 19 | 2054 | 7.37 | 733 | 684 | 185.7 |
| B | 2 | 9 | 2348 | 11.87 | 702 | 667 | 141.6 |
| B | 14 | 254 | 1793 | 7.95 | 702 | 667 | 141.6 |
| B | 3 | 17 | 1791 | 7.94 | 702 | 667 | 141.6 |
| C | 1 | 80 | 2082 | 7.17 | 742 | 688 | 194.3 |
| C | 1 | 81 | 2050 | 7.01 | 742 | 688 | 194.3 |
| C | 12 | 241 | 1999 | 6.75 | 742 | 688 | 194.3 |
| D | 3 | 14 | 1812 | 6.54 | 674 | 610 | 183.9 |
| D | 1 | 19 | 1706 | 5.96 | 674 | 610 | 183.9 |
| D | 6 | 231 | 1685 | 5.85 | 674 | 610 | 183.9 |
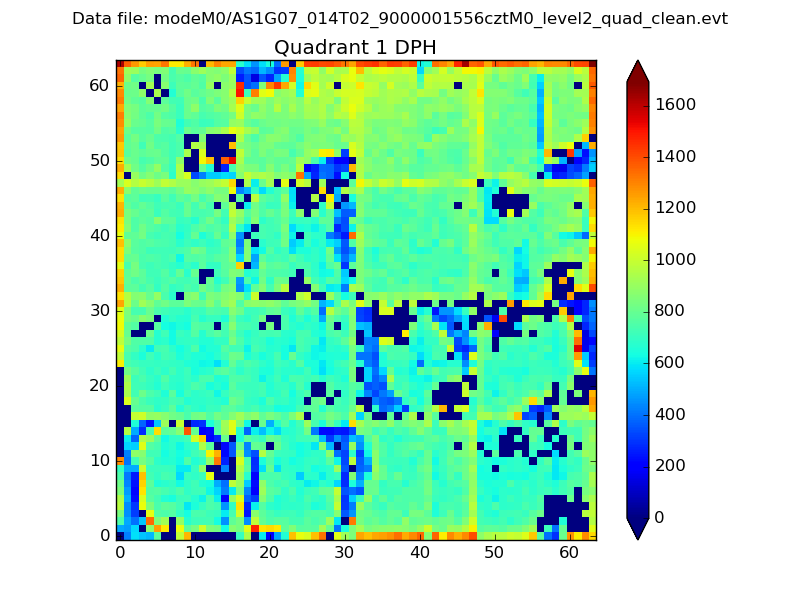
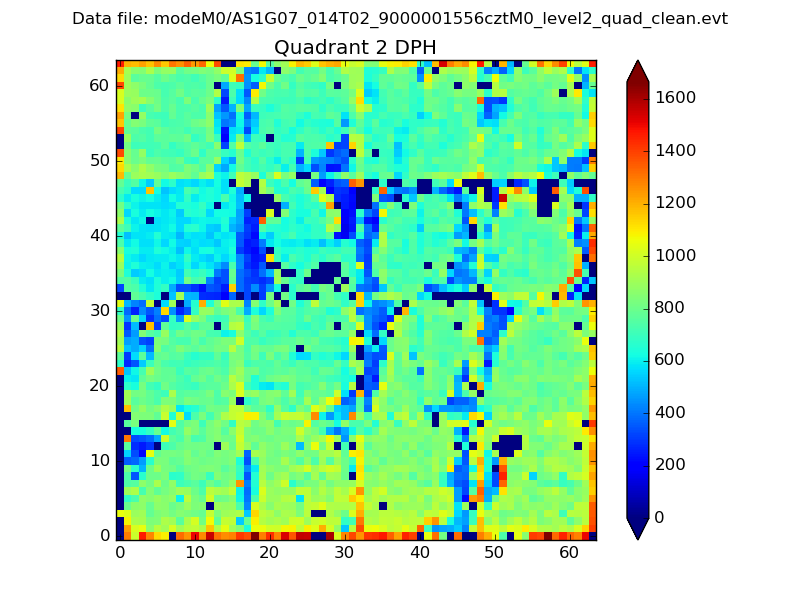
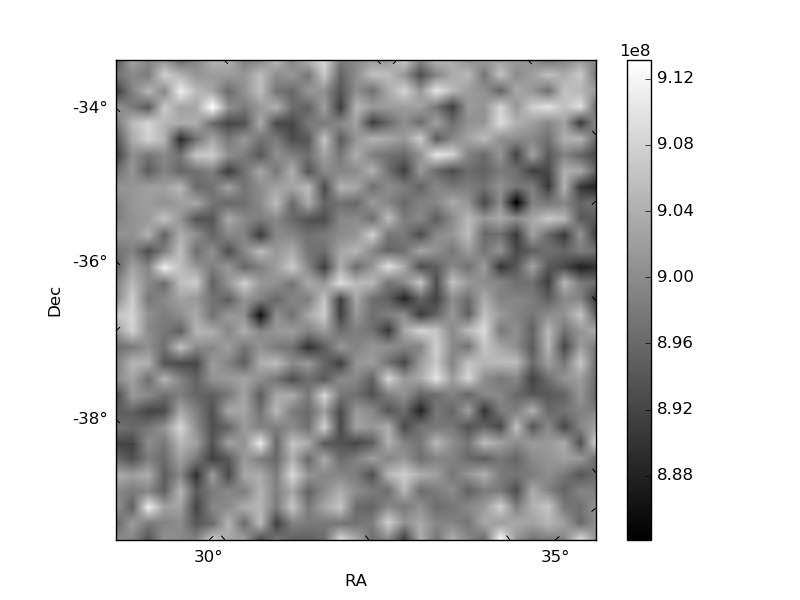
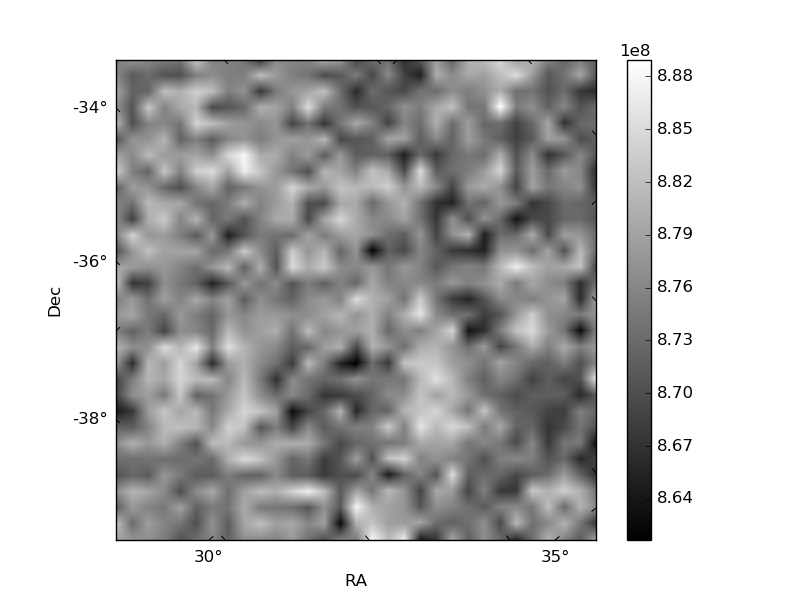
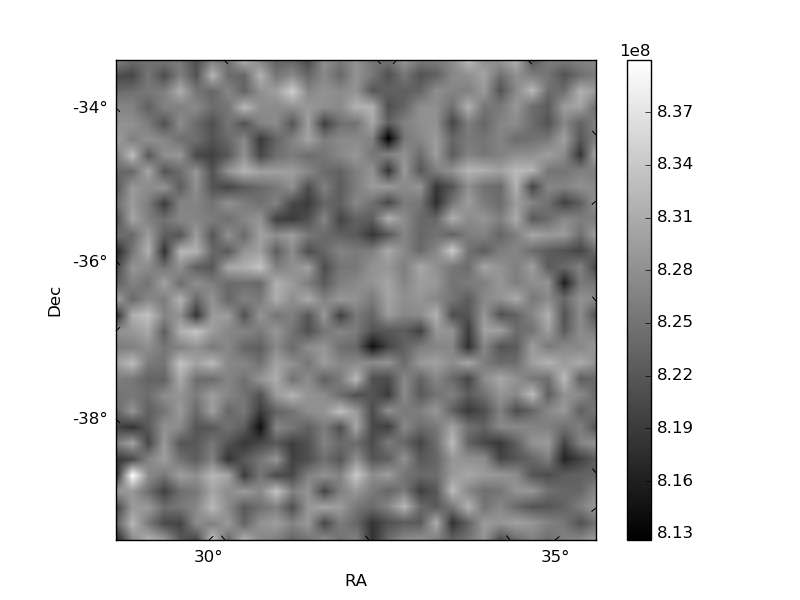
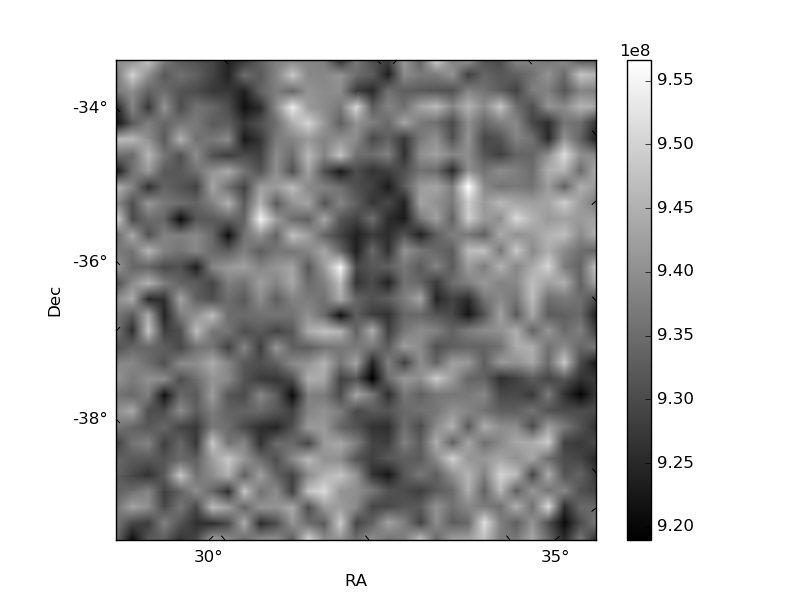
Histogram calculated using DETX and DETY for each event in the final _common_clean file
| Quadrant A | 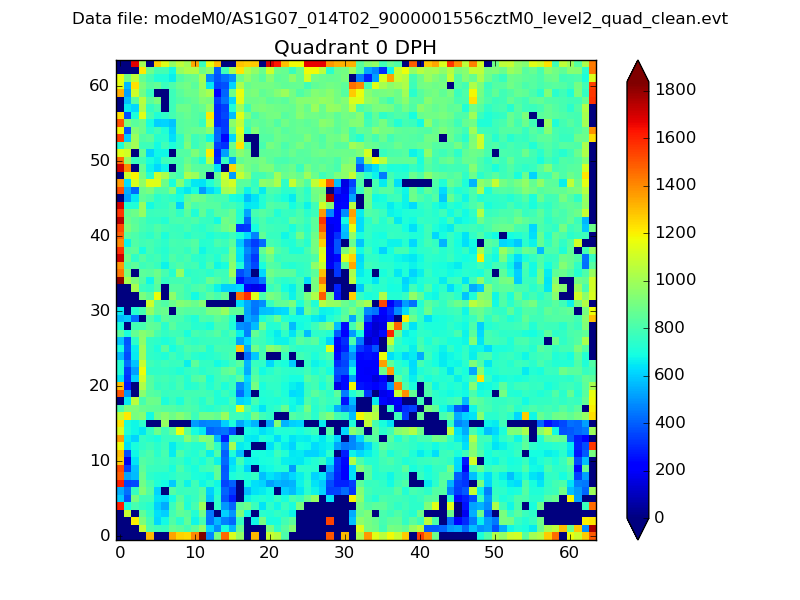 |
 |
Quadrant B |
|---|---|---|---|
| Quadrant D | 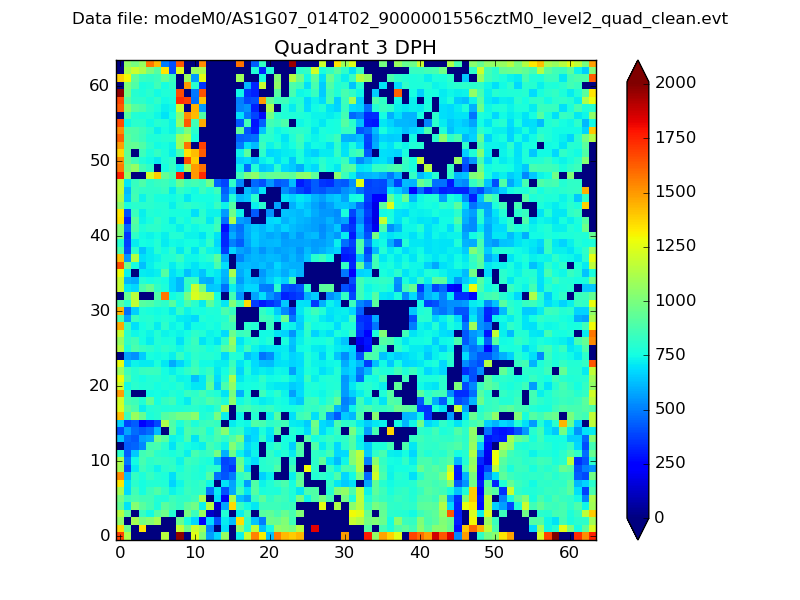 |
 |
Quadrant C |
| Plot type | Count rate plots | Images |
|---|---|---|
| Comparison with Poisson distribution Blue bars denote a histogram of data divided into 1 sec bins. Red curve is a Poisson curve with rate = median count rate of data. |
 |
 |
| Quadrant-wise count rates Data is divided into 100 sec bins |
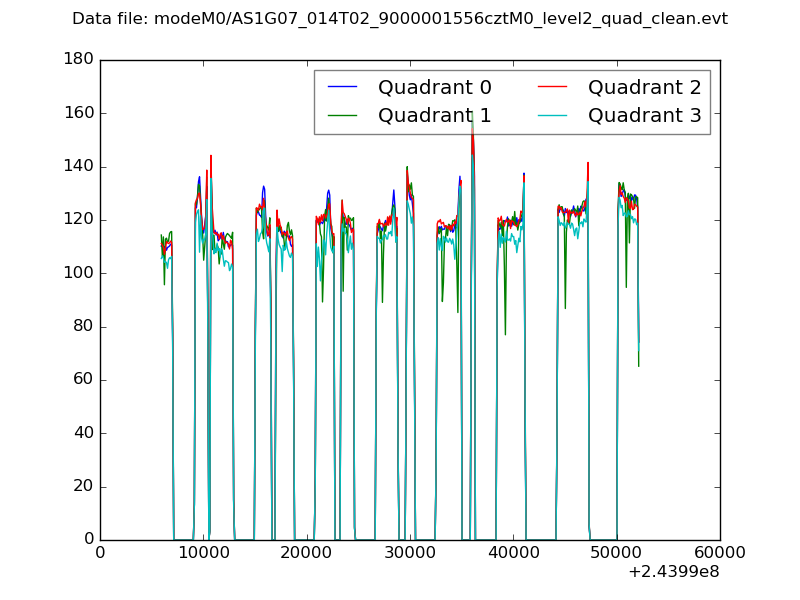 |
|
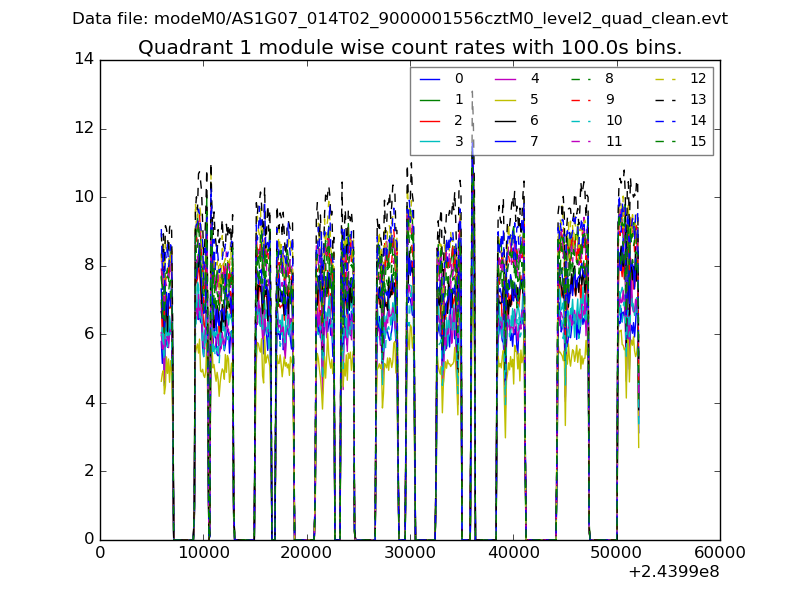
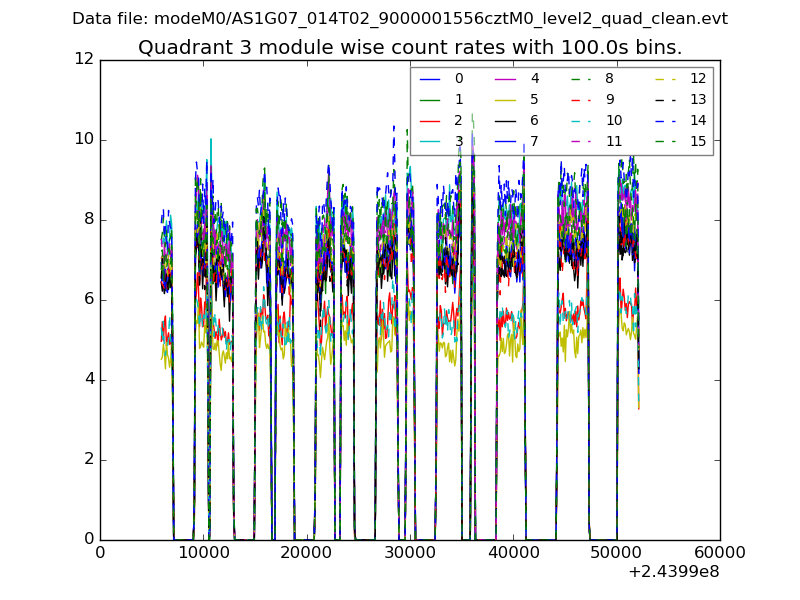
| Module-wise count rates for Quadrant A Data is divided into 100 sec bins |
 |
 |
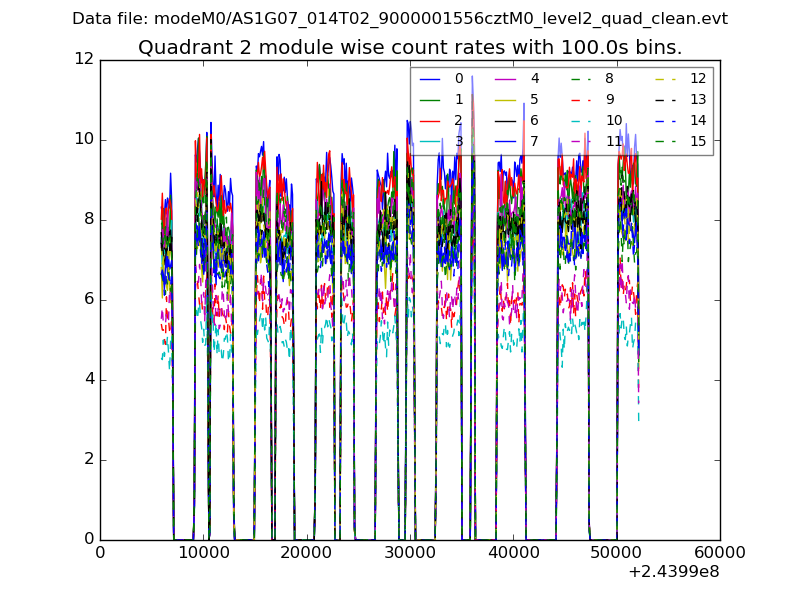
| Module-wise count rates for Quadrant B Data is divided into 100 sec bins |
 |
 |
| Module-wise count rates for Quadrant C Data is divided into 100 sec bins |
 |
 |
| Module-wise count rates for Quadrant D Data is divided into 100 sec bins |
 |
 |
| Parameter | Plot |
|---|---|
| CZT HV Monitor | 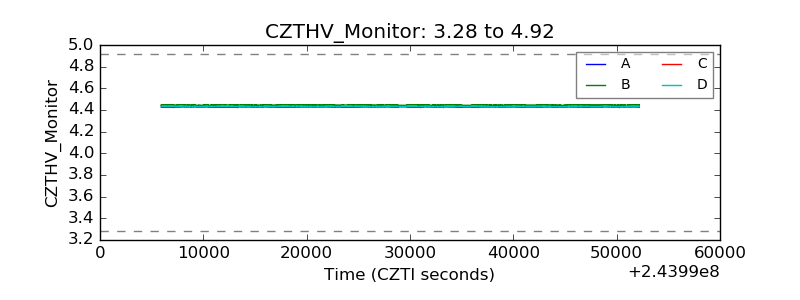 |
| D_VDD | 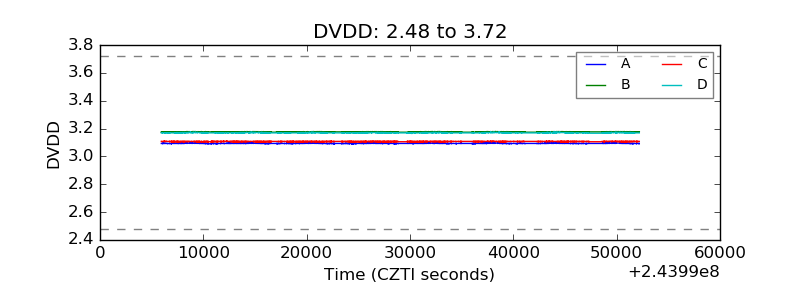 |
| Temperature 1 | 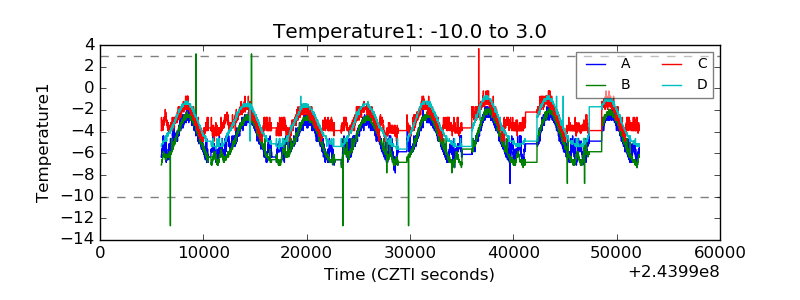 |
| Veto HV Monitor | 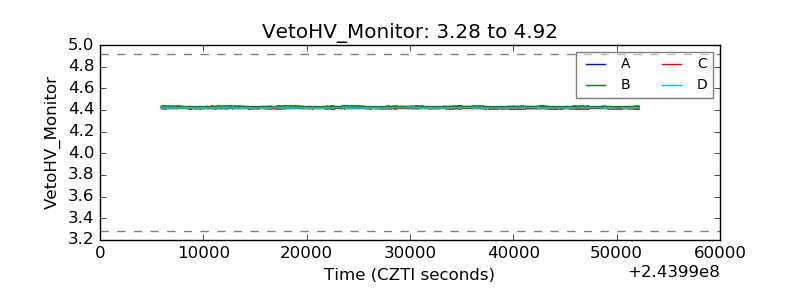 |
| Veto LLD | 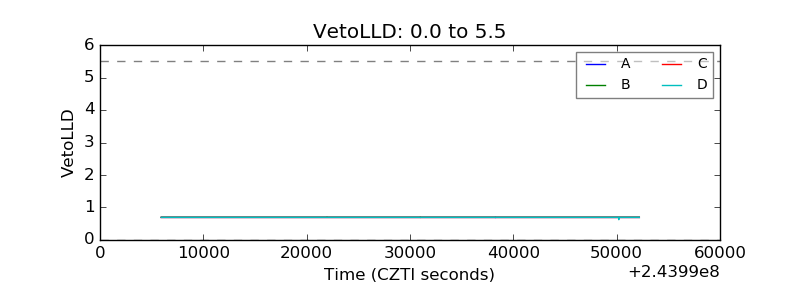 |
| Alpha Counter |  |
| _CPM_Rate |  |
| CZT Counter | 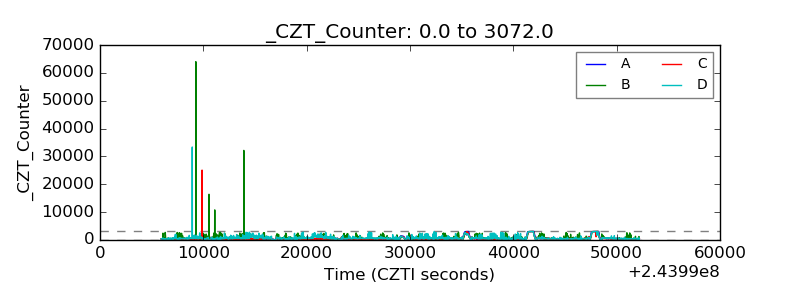 |
| +2.5 Volts monitor | 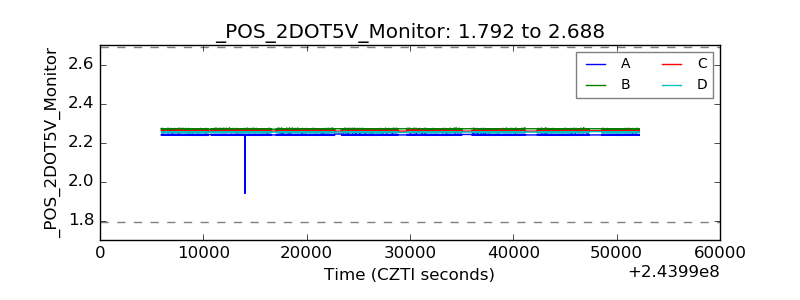 |
| +5 Volts monitor |  |
| _ROLL_ROT | 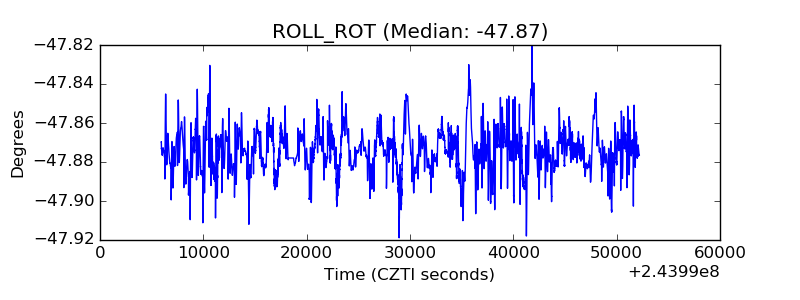 |
| _Roll_DEC | 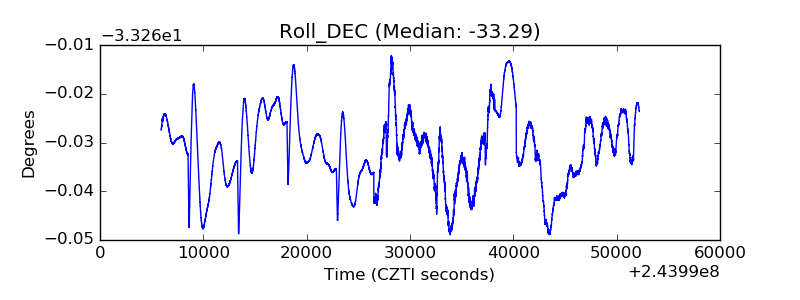 |
| _Roll_RA | 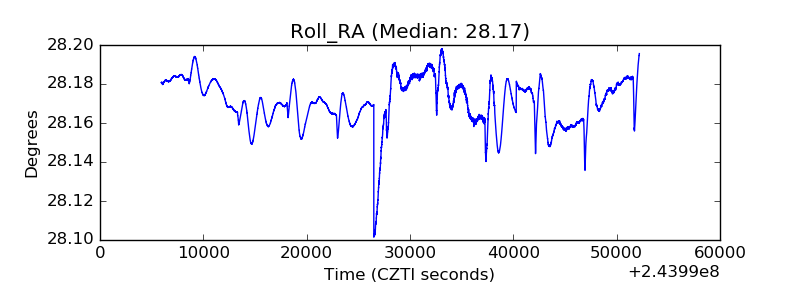 |
| Veto Counter |  |