| Param | Original file | Final file |
|---|---|---|
| Filename | modeM0/AS1G07_014T02_9000001556_10773cztM0_level2.evt | modeM0/AS1G07_014T02_9000001556_10773cztM0_level2_quad_clean.evt |
| Size (bytes) | 788,918,400 | 129,260,160 |
| Size | 752.4 MB | 123.3 MB |
| Events in quadrant A | 5,437,682 | 803,465 |
| Events in quadrant B | 6,733,616 | 808,857 |
| Events in quadrant C | 4,721,593 | 815,467 |
| Events in quadrant D | 6,299,026 | 770,694 |
| Mode SS | |||
|---|---|---|---|
| Quadrant | BADHDUFLAG | Total packets | Discarded packets |
| A | 0 | 230 | 22 |
| B | 0 | 230 | 14 |
| C | 0 | 230 | 20 |
| D | 0 | 230 | 18 |
| Mode M9 | |||
|---|---|---|---|
| Quadrant | BADHDUFLAG | Total packets | Discarded packets |
| A | 0 | 8 | 0 |
| B | 0 | 8 | 0 |
| C | 0 | 8 | 0 |
| D | 0 | 8 | 0 |
| Mode M0 | |||
|---|---|---|---|
| Quadrant | BADHDUFLAG | Total packets | Discarded packets |
| A | 0 | 25063 | 2135 |
| B | 0 | 29640 | 2678 |
| C | 0 | 23185 | 1747 |
| D | 0 | 29905 | 4499 |
| Quadrant | Total seconds | Saturated seconds | Saturation percentage |
|---|---|---|---|
| A | 10398 | 75 | 0.721293% |
| B | 10364 | 552 | 5.326129% |
| C | 10453 | 67 | 0.640964% |
| D | 10135 | 262 | 2.585101% |
Noise dominated data is calculated using 1-second bins in cleaned event files. If a bin has >2000 counts, and if more than 50% of those come from <1% of pixels, then it is considered to be noise-dominated and hence unusable.
| Quadrant | # 1 sec bins | Bins with >0 counts | Bins with >2000 counts | High rate bins dominated by noise | Noise dominated (total time) | Noise dominated (detector-on time) | Marked lightcurve |
|---|---|---|---|---|---|---|---|
| A | 12021 | 10979 | 3 | 3 | 0.02% | 0.03% | 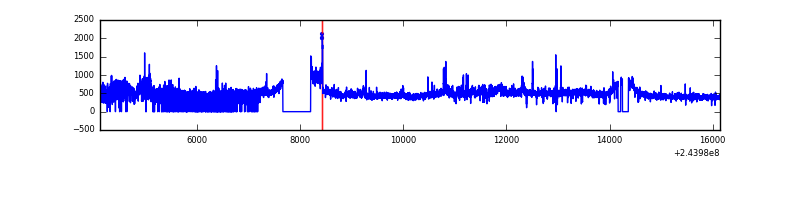 |
| B | 12021 | 10920 | 266 | 266 | 2.21% | 2.44% | 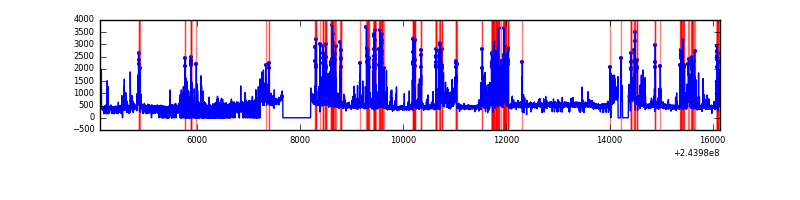 |
| C | 12021 | 11011 | 0 | 0 | 0.00% | 0.00% | 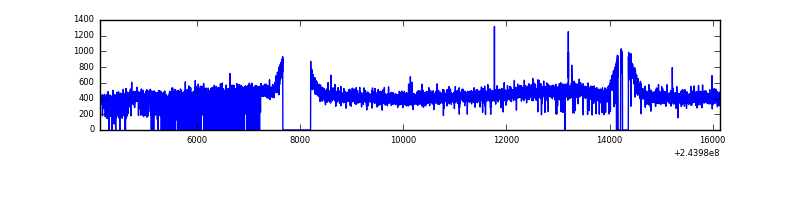 |
| D | 12021 | 10698 | 159 | 159 | 1.32% | 1.49% | 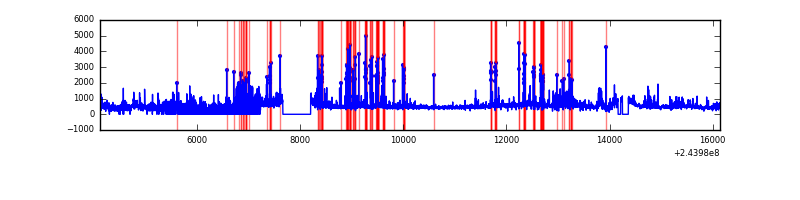 |
Top three noisy pixels from each quadrant. If the there are fewer than three noisy pixels in the level2.evt file, extra rows are filled as -1
| Pixel properties | Quadrant properties | ||||||
|---|---|---|---|---|---|---|---|
| Quadrant | DetID | PixID | Counts | Sigma | Mean | Median | Sigma |
| A | 15 | 239 | 737791 | 2979.62 | 1212 | 1184 | 247.2 |
| A | 1 | 162 | 12578 | 46.09 | 1212 | 1184 | 247.2 |
| A | 0 | 226 | 11087 | 40.06 | 1212 | 1184 | 247.2 |
| B | 4 | 239 | 1863422 | 8030.83 | 1201 | 1169 | 231.9 |
| B | 0 | 214 | 81208 | 345.16 | 1201 | 1169 | 231.9 |
| B | 15 | 204 | 41473 | 173.81 | 1201 | 1169 | 231.9 |
| C | 8 | 128 | 12378 | 39.91 | 1204 | 1207 | 279.9 |
| C | 13 | 61 | 9142 | 28.35 | 1204 | 1207 | 279.9 |
| C | 8 | 112 | 7115 | 21.11 | 1204 | 1207 | 279.9 |
| D | 1 | 52 | 690932 | 2486.12 | 1143 | 1112 | 277.5 |
| D | 8 | 195 | 546945 | 1967.19 | 1143 | 1112 | 277.5 |
| D | 10 | 199 | 280981 | 1008.65 | 1143 | 1112 | 277.5 |
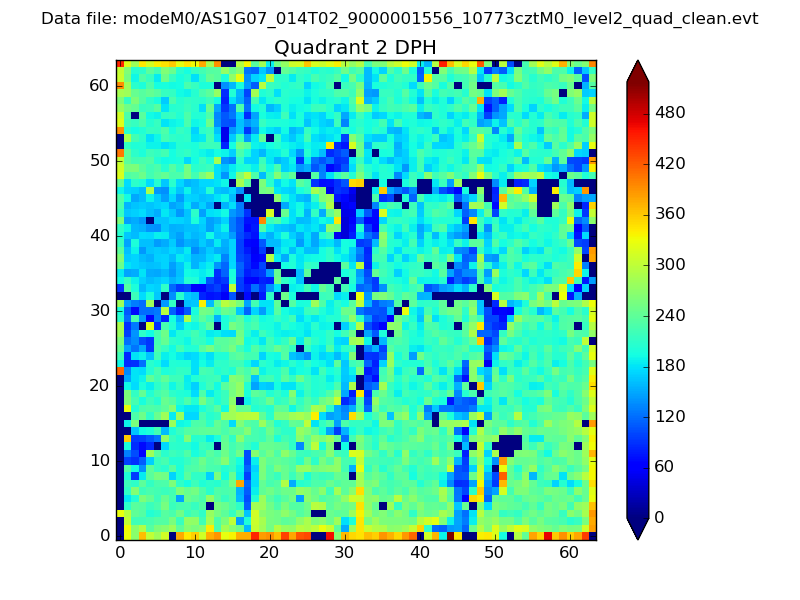
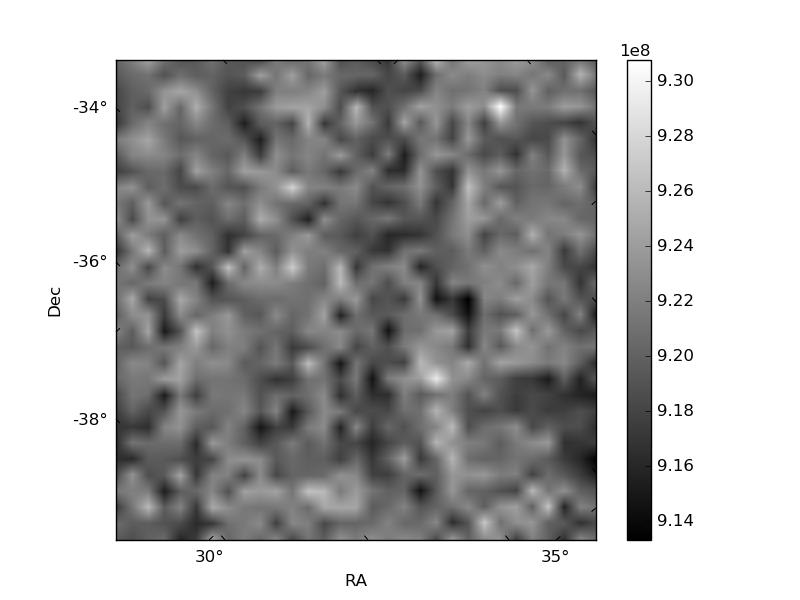
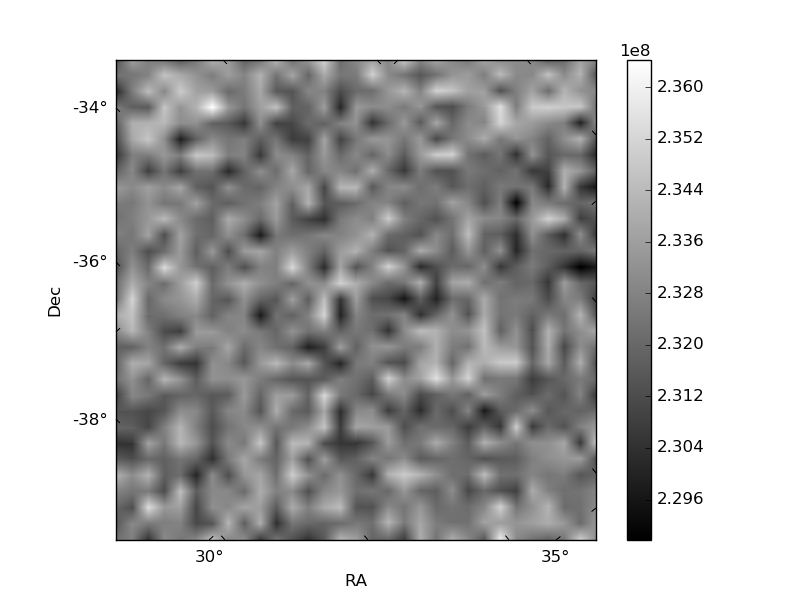
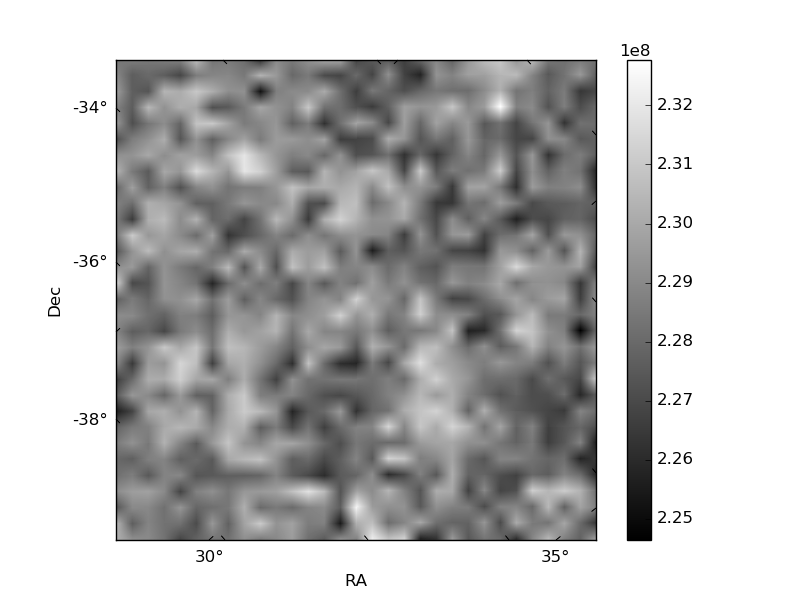
Histogram calculated using DETX and DETY for each event in the final _common_clean file
| Quadrant A | 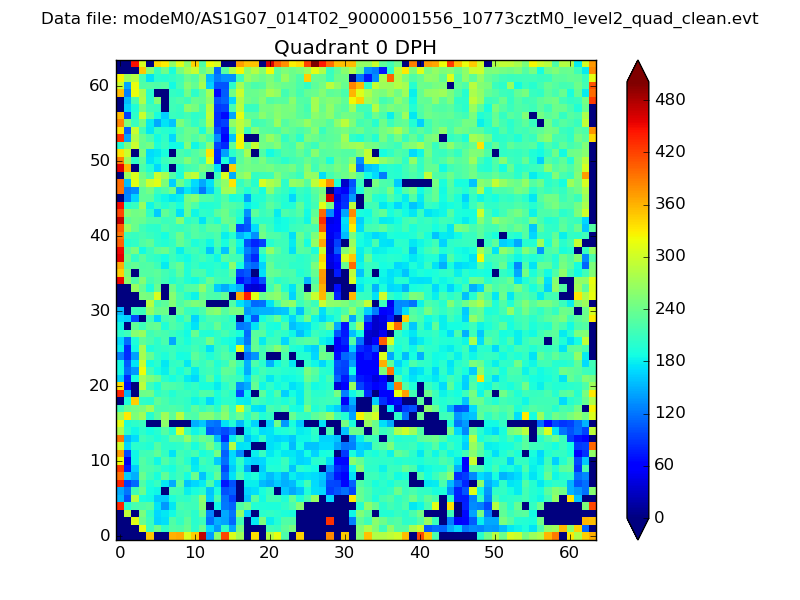 |
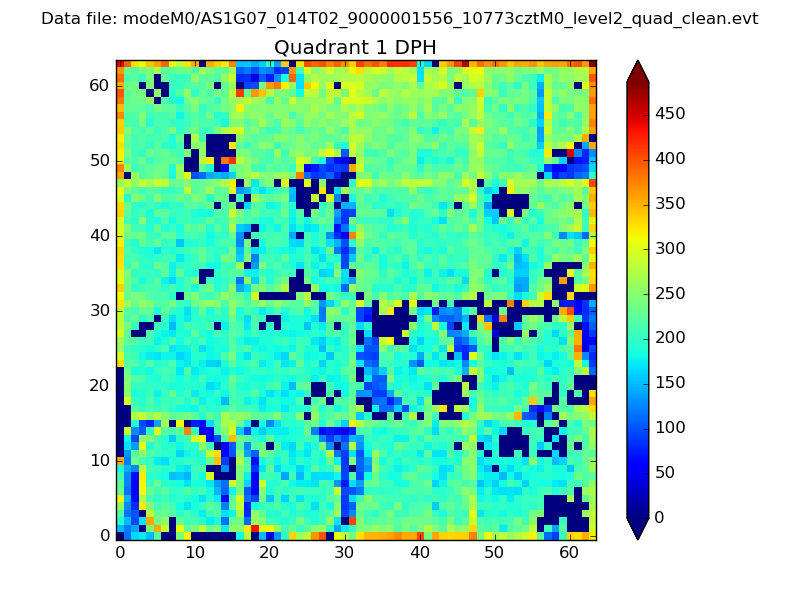 |
Quadrant B |
|---|---|---|---|
| Quadrant D | 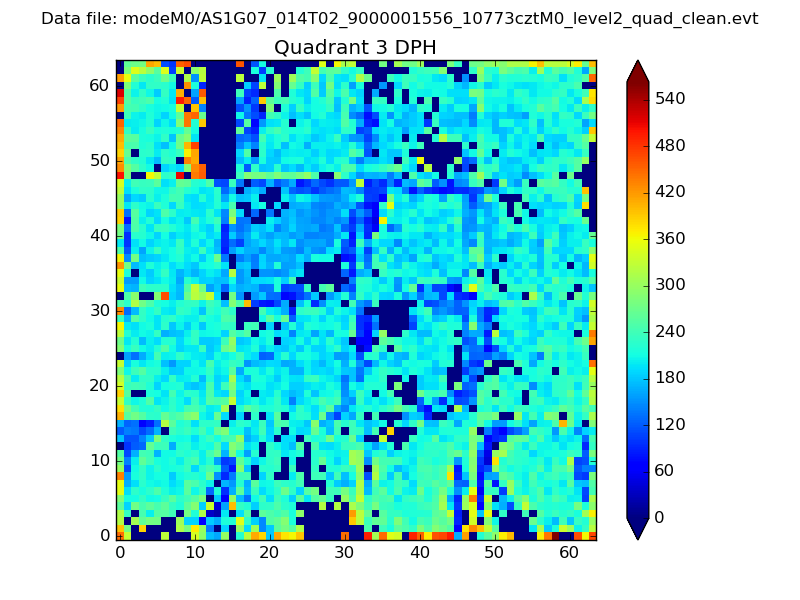 |
 |
Quadrant C |
| Plot type | Count rate plots | Images |
|---|---|---|
| Comparison with Poisson distribution Blue bars denote a histogram of data divided into 1 sec bins. Red curve is a Poisson curve with rate = median count rate of data. |
 |
 |
| Quadrant-wise count rates Data is divided into 100 sec bins |
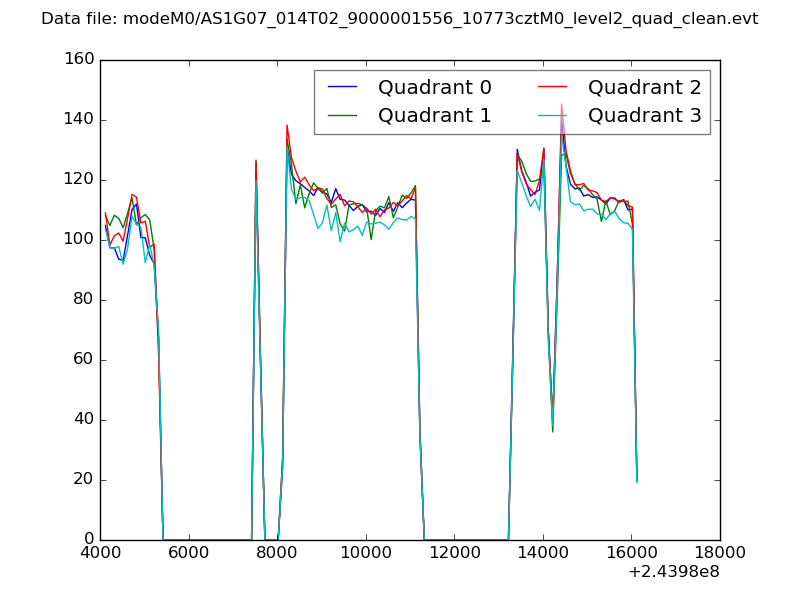 |
|
| Module-wise count rates for Quadrant A Data is divided into 100 sec bins |
 |
 |
| Module-wise count rates for Quadrant B Data is divided into 100 sec bins |
 |
 |
| Module-wise count rates for Quadrant C Data is divided into 100 sec bins |
 |
 |
| Module-wise count rates for Quadrant D Data is divided into 100 sec bins |
 |
 |
| Parameter | Plot |
|---|---|
| CZT HV Monitor |  |
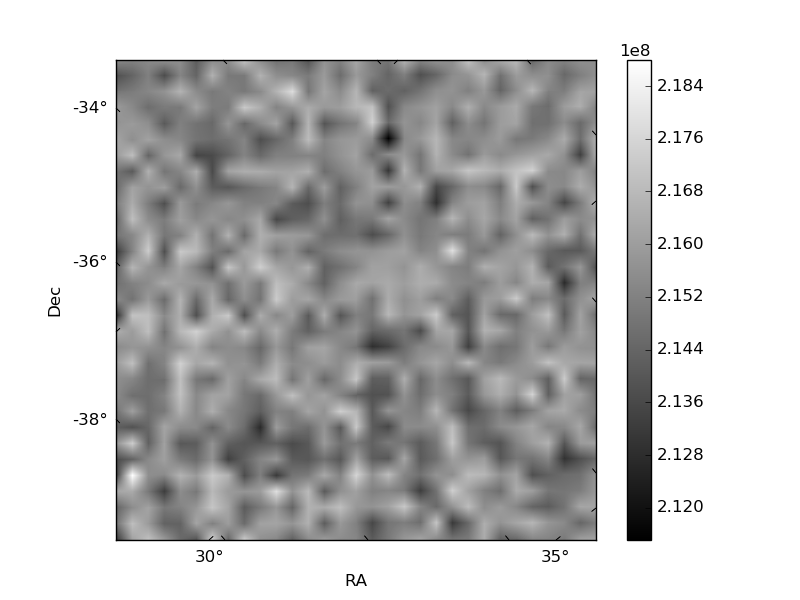
| D_VDD | 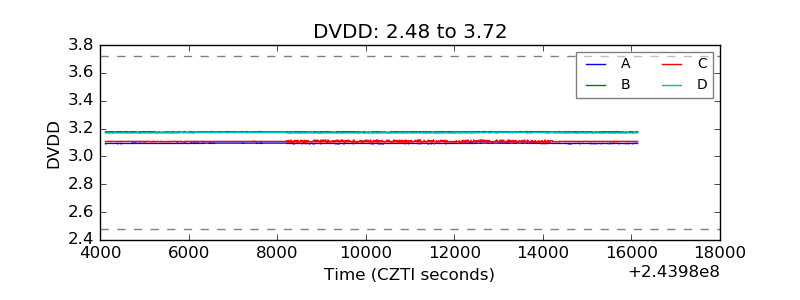 |
| Temperature 1 |  |
| Veto HV Monitor | 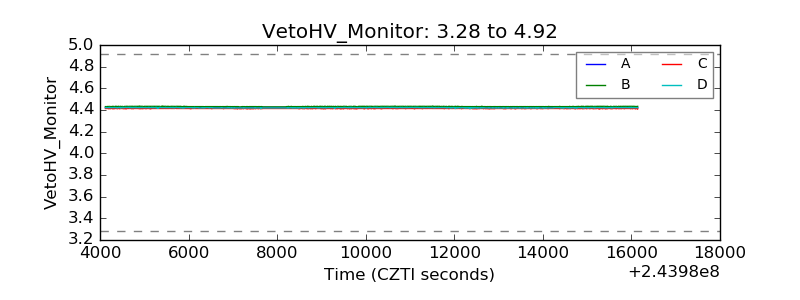 |
| Veto LLD |  |
| Alpha Counter | 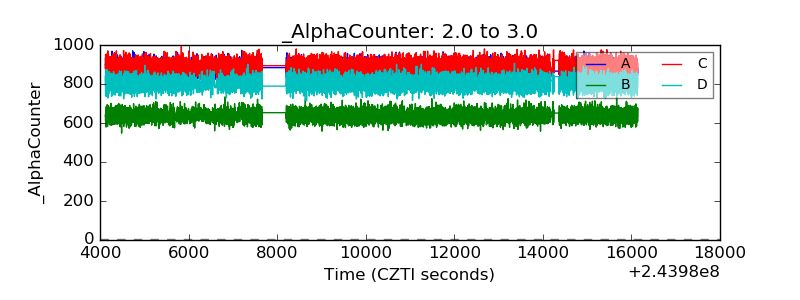 |
| _CPM_Rate | 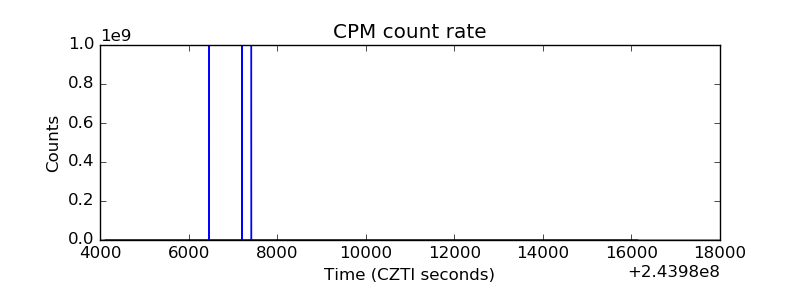 |
| CZT Counter | 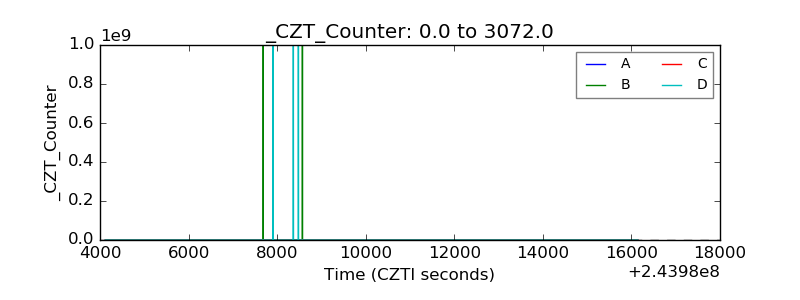 |
| +2.5 Volts monitor |  |
| +5 Volts monitor |  |
| _ROLL_ROT |  |
| _Roll_DEC |  |
| _Roll_RA | 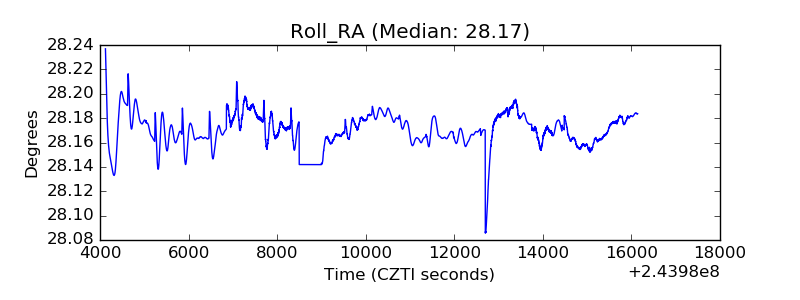 |
| Veto Counter |  |