| Param | Original file | Final file |
|---|---|---|
| Filename | modeM0/AS1G07_014T02_9000001556_10777cztM0_level2.evt | modeM0/AS1G07_014T02_9000001556_10777cztM0_level2_quad_clean.evt |
| Size (bytes) | 1,827,933,120 | 268,053,120 |
| Size | 1.7 GB | 255.6 MB |
| Events in quadrant A | 10,375,543 | 1,658,493 |
| Events in quadrant B | 15,337,638 | 1,642,157 |
| Events in quadrant C | 10,234,877 | 1,665,059 |
| Events in quadrant D | 17,851,941 | 1,561,929 |
| Mode SS | |||
|---|---|---|---|
| Quadrant | BADHDUFLAG | Total packets | Discarded packets |
| A | 0 | 472 | 0 |
| B | 0 | 472 | 0 |
| C | 0 | 472 | 0 |
| D | 0 | 472 | 0 |
| Mode M9 | |||
|---|---|---|---|
| Quadrant | BADHDUFLAG | Total packets | Discarded packets |
| A | 0 | 20 | 0 |
| B | 0 | 20 | 0 |
| C | 0 | 20 | 0 |
| D | 0 | 20 | 0 |
| Mode M0 | |||
|---|---|---|---|
| Quadrant | BADHDUFLAG | Total packets | Discarded packets |
| A | 0 | 47006 | 5 |
| B | 0 | 60668 | 4 |
| C | 0 | 46832 | 4 |
| D | 0 | 68407 | 4 |
| Quadrant | Total seconds | Saturated seconds | Saturation percentage |
|---|---|---|---|
| A | 23102 | 178 | 0.770496% |
| B | 23102 | 1455 | 6.298156% |
| C | 23102 | 167 | 0.722881% |
| D | 23102 | 1250 | 5.410787% |
Noise dominated data is calculated using 1-second bins in cleaned event files. If a bin has >2000 counts, and if more than 50% of those come from <1% of pixels, then it is considered to be noise-dominated and hence unusable.
| Quadrant | # 1 sec bins | Bins with >0 counts | Bins with >2000 counts | High rate bins dominated by noise | Noise dominated (total time) | Noise dominated (detector-on time) | Marked lightcurve |
|---|---|---|---|---|---|---|---|
| A | 25247 | 23106 | 6 | 6 | 0.02% | 0.03% | 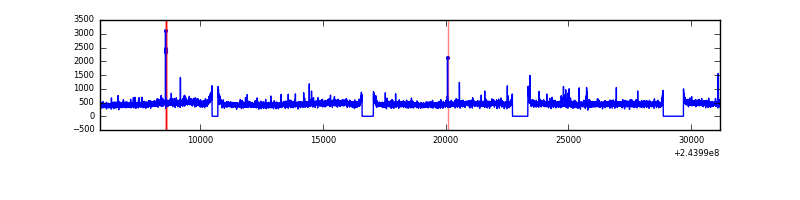 |
| B | 25247 | 23106 | 789 | 789 | 3.13% | 3.41% | 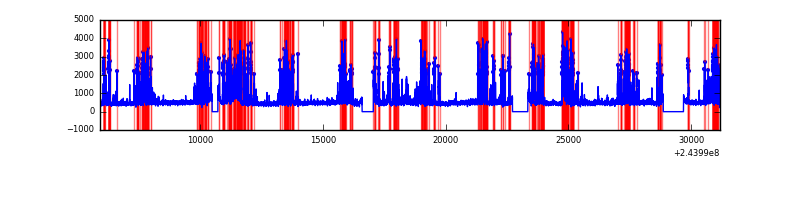 |
| C | 25247 | 23106 | 0 | 0 | 0.00% | 0.00% | 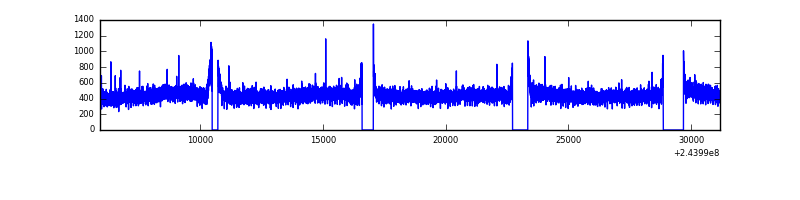 |
| D | 25247 | 23106 | 909 | 909 | 3.60% | 3.93% | 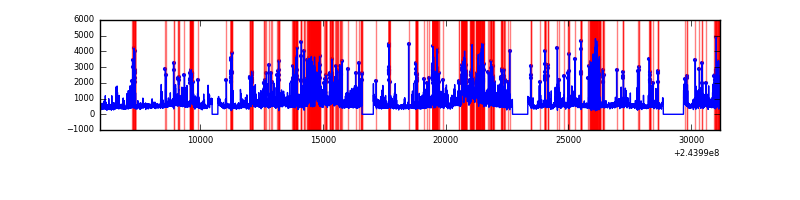 |
Top three noisy pixels from each quadrant. If the there are fewer than three noisy pixels in the level2.evt file, extra rows are filled as -1
| Pixel properties | Quadrant properties | ||||||
|---|---|---|---|---|---|---|---|
| Quadrant | DetID | PixID | Counts | Sigma | Mean | Median | Sigma |
| A | 1 | 162 | 37963 | 64.97 | 2664 | 2598 | 544.3 |
| A | 15 | 174 | 37421 | 63.97 | 2664 | 2598 | 544.3 |
| A | 0 | 226 | 24192 | 39.67 | 2664 | 2598 | 544.3 |
| B | 4 | 239 | 4536875 | 9068.9 | 2626 | 2557 | 500.0 |
| B | 0 | 85 | 243405 | 481.71 | 2626 | 2557 | 500.0 |
| B | 0 | 214 | 136381 | 267.65 | 2626 | 2557 | 500.0 |
| C | 13 | 61 | 19374 | 27.61 | 2622 | 2629 | 606.4 |
| C | 8 | 222 | 11818 | 15.15 | 2622 | 2629 | 606.4 |
| C | 14 | 234 | 7682 | 8.33 | 2622 | 2629 | 606.4 |
| D | 13 | 104 | 2811344 | 4561.12 | 2552 | 2479 | 615.8 |
| D | 8 | 195 | 1700146 | 2756.73 | 2552 | 2479 | 615.8 |
| D | 1 | 52 | 1408688 | 2283.45 | 2552 | 2479 | 615.8 |
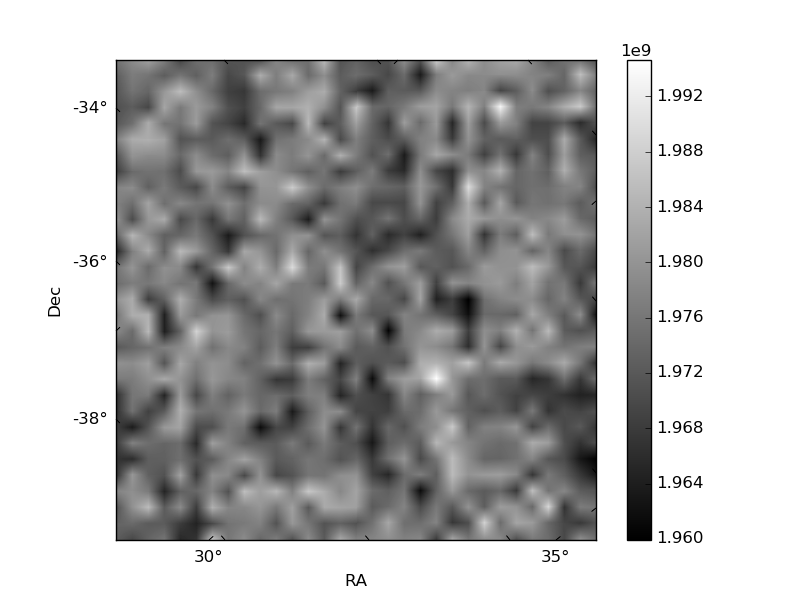
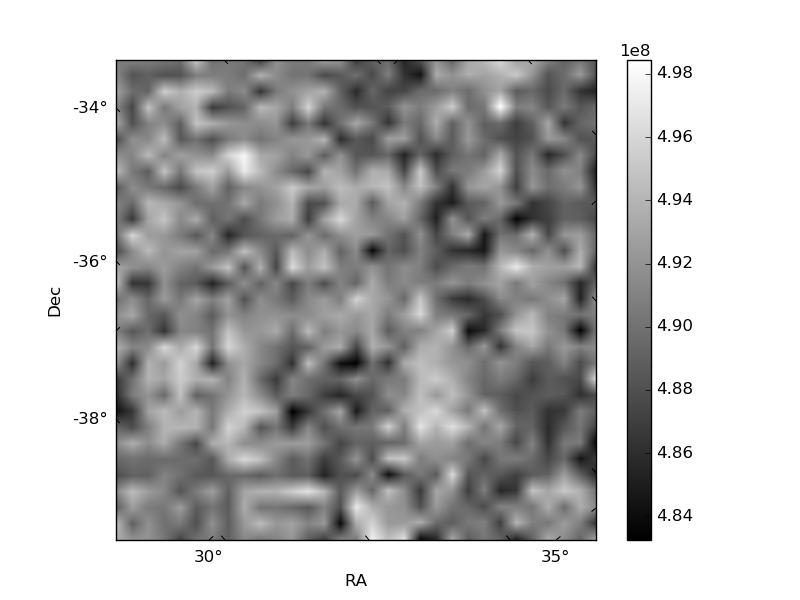
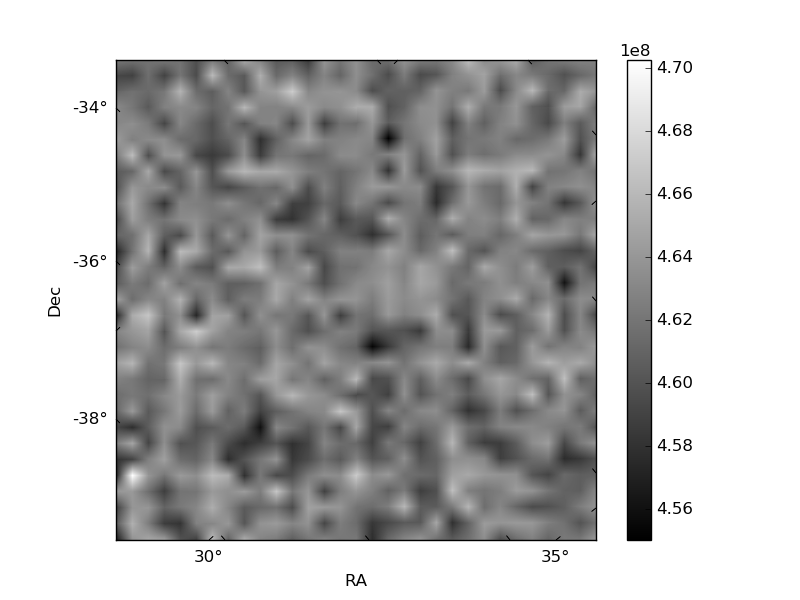
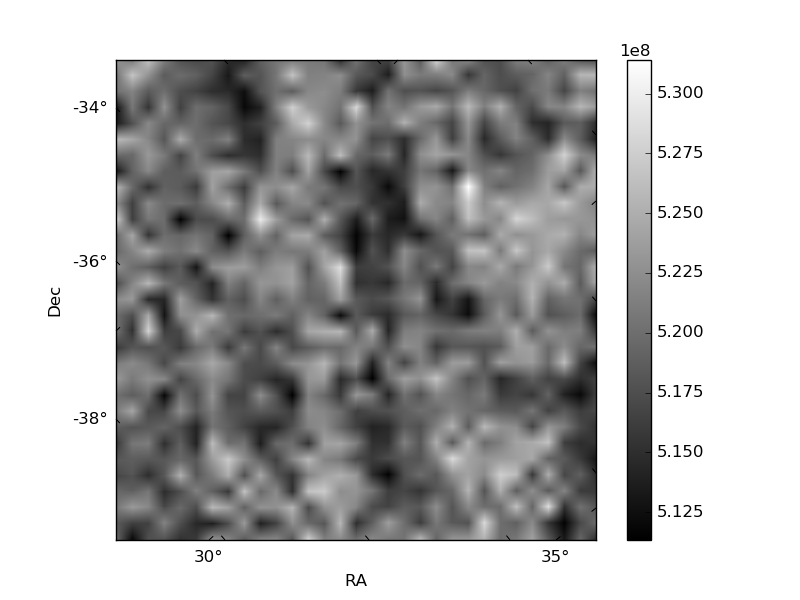
Histogram calculated using DETX and DETY for each event in the final _common_clean file
| Quadrant A | 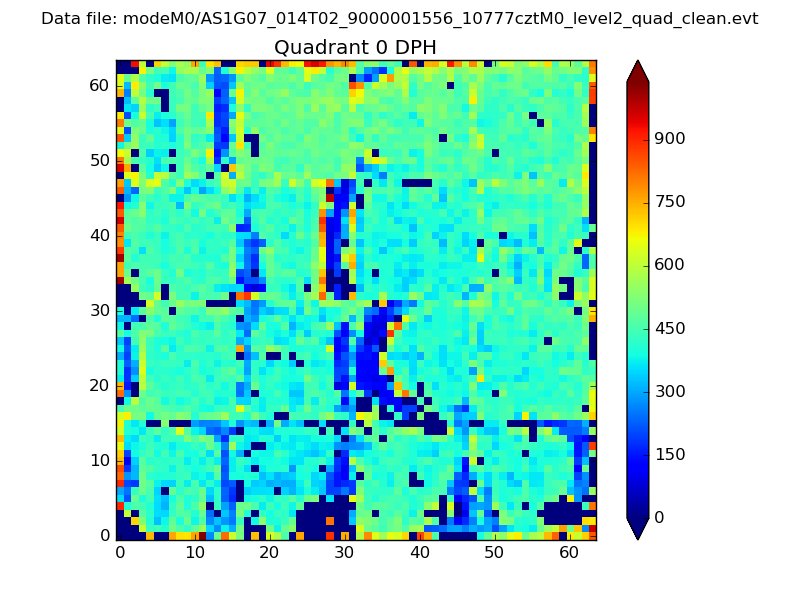 |
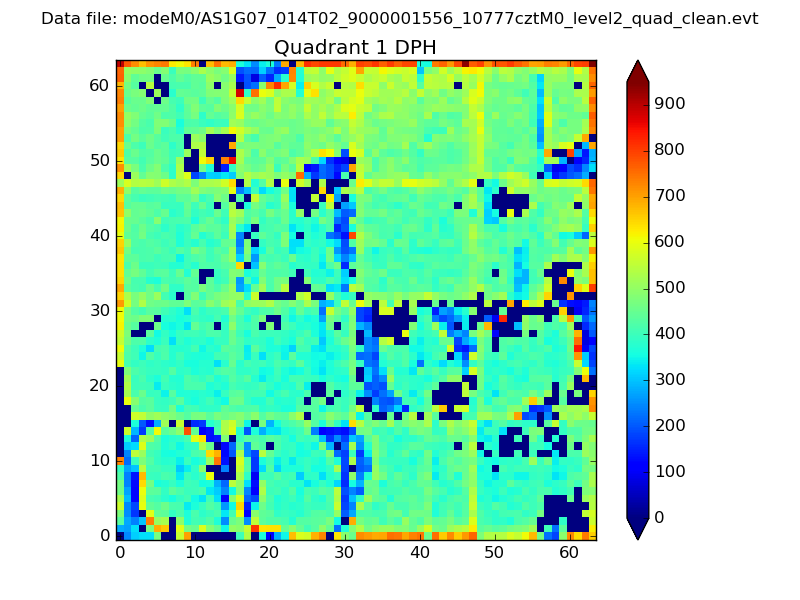 |
Quadrant B |
|---|---|---|---|
| Quadrant D | 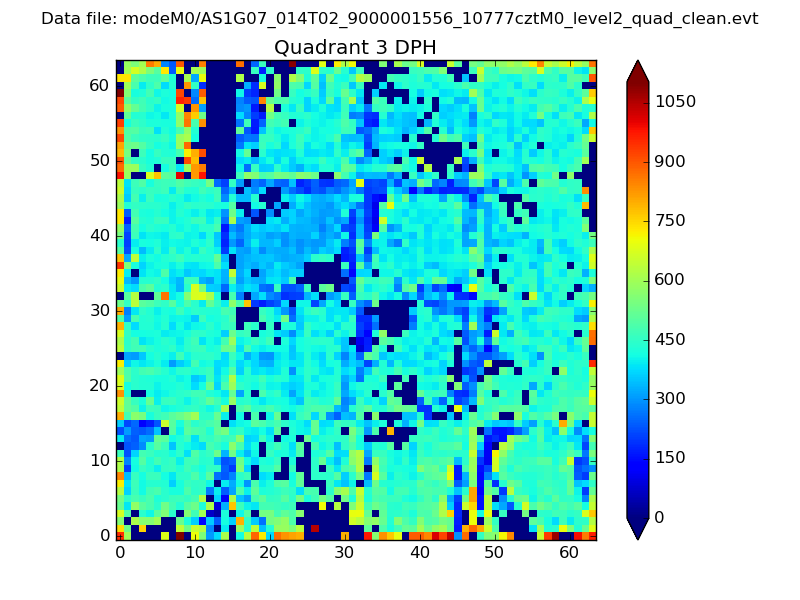 |
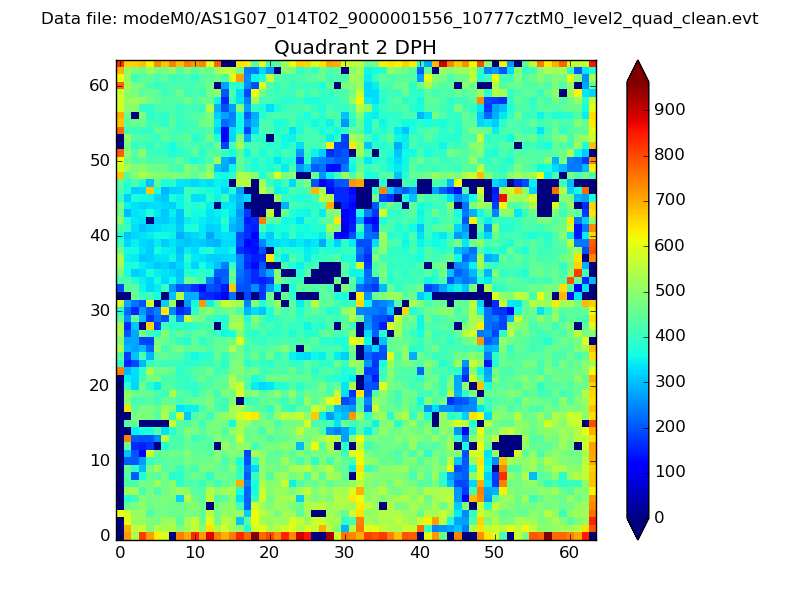 |
Quadrant C |
| Plot type | Count rate plots | Images |
|---|---|---|
| Comparison with Poisson distribution Blue bars denote a histogram of data divided into 1 sec bins. Red curve is a Poisson curve with rate = median count rate of data. |
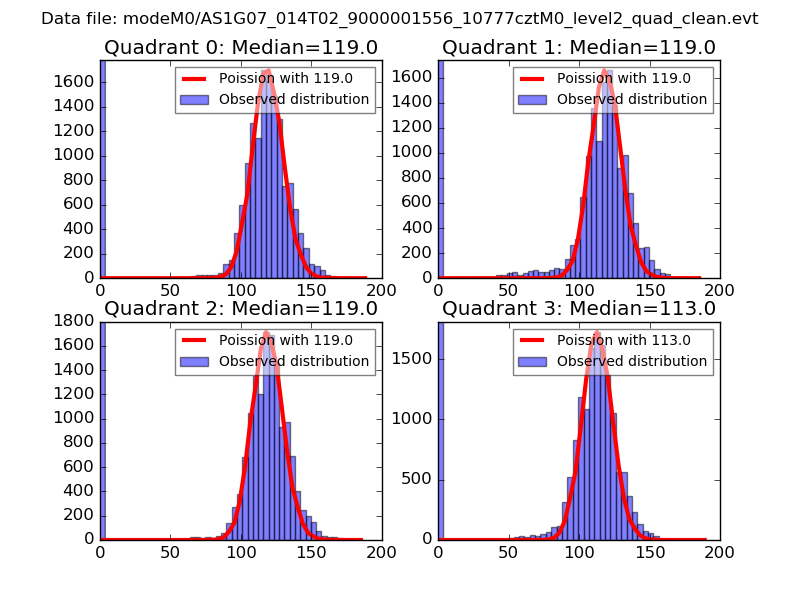 |
 |
| Quadrant-wise count rates Data is divided into 100 sec bins |
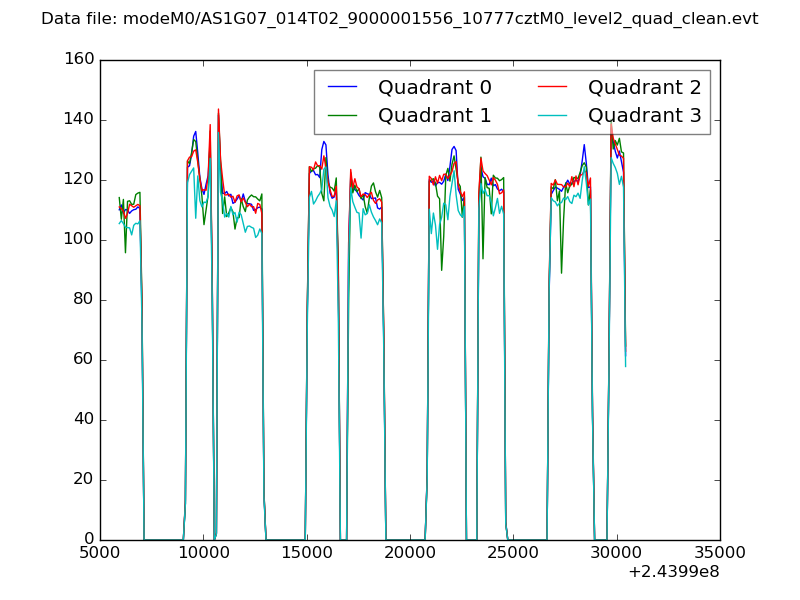 |
|
| Module-wise count rates for Quadrant A Data is divided into 100 sec bins |
 |
 |
| Module-wise count rates for Quadrant B Data is divided into 100 sec bins |
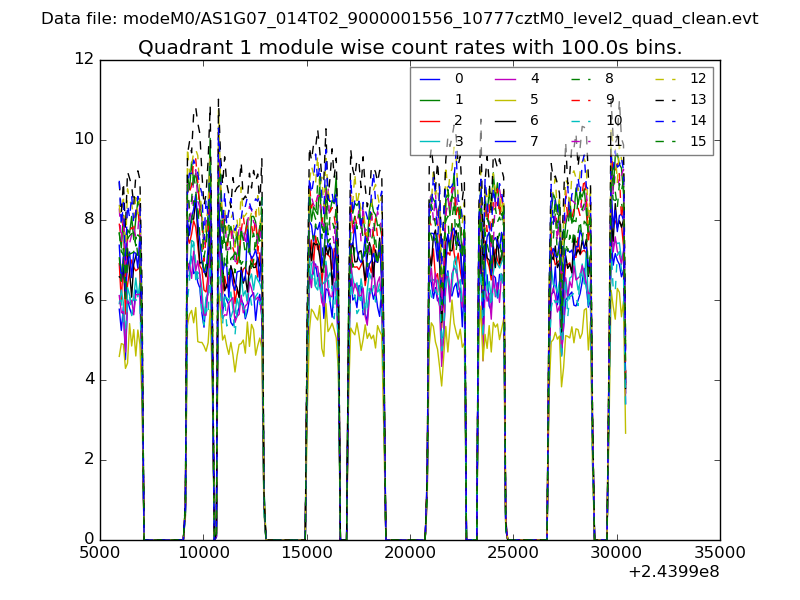 |
 |
| Module-wise count rates for Quadrant C Data is divided into 100 sec bins |
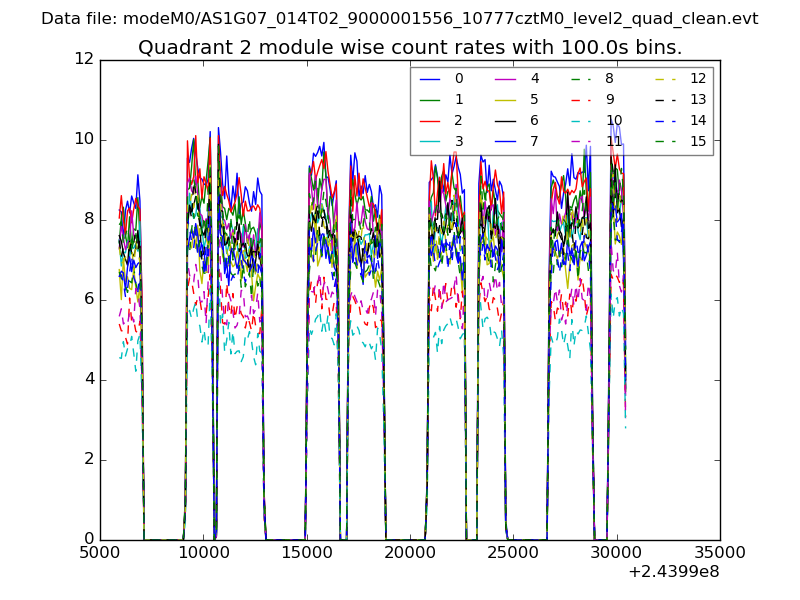 |
 |
| Module-wise count rates for Quadrant D Data is divided into 100 sec bins |
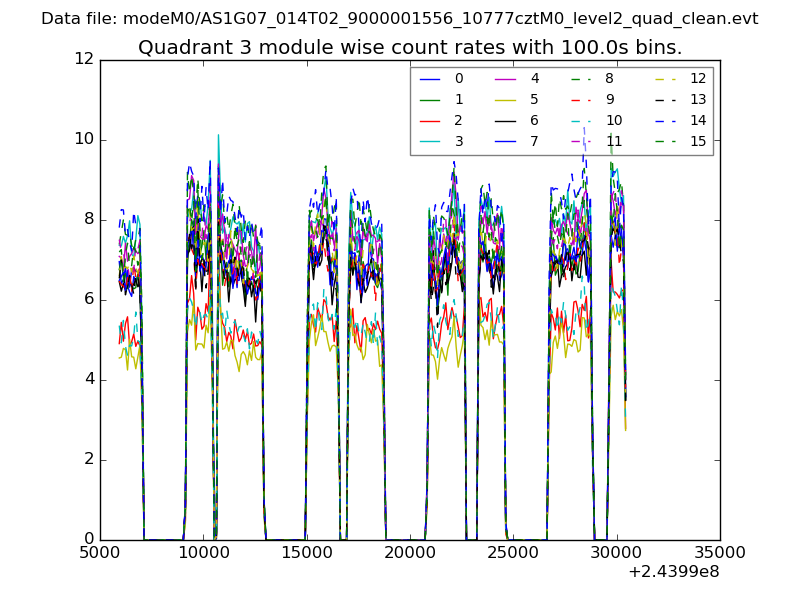 |
 |
| Parameter | Plot |
|---|---|
| CZT HV Monitor | 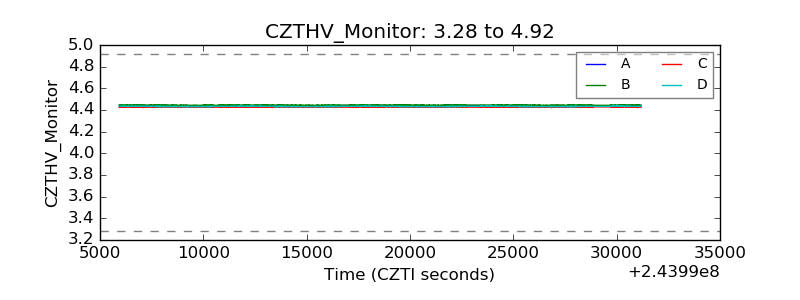 |
| D_VDD | 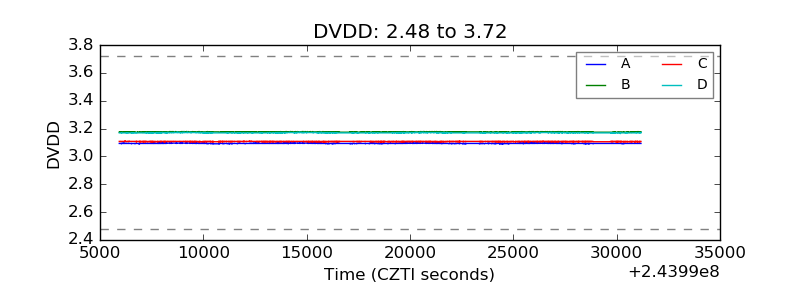 |
| Temperature 1 | 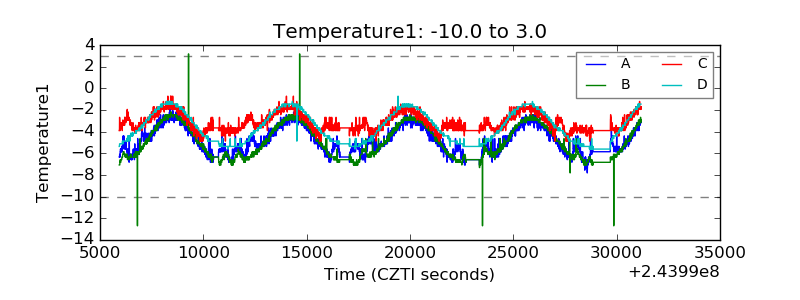 |
| Veto HV Monitor | 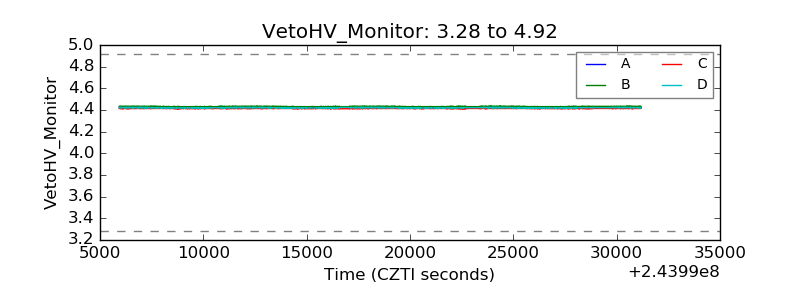 |
| Veto LLD |  |
| Alpha Counter | 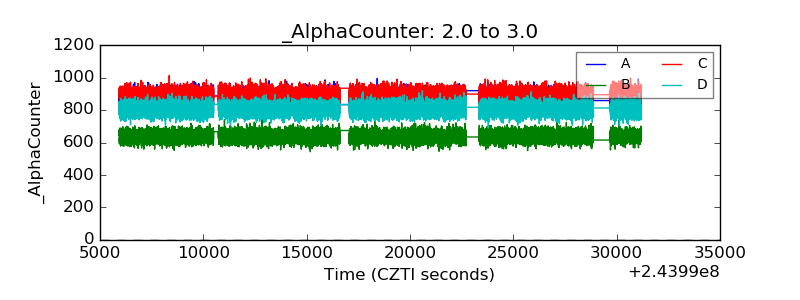 |
| _CPM_Rate | 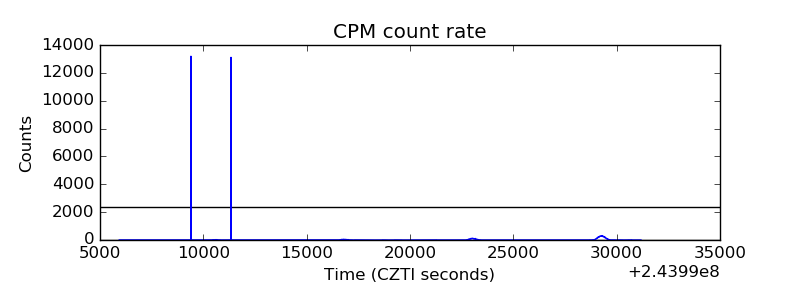 |
| CZT Counter | 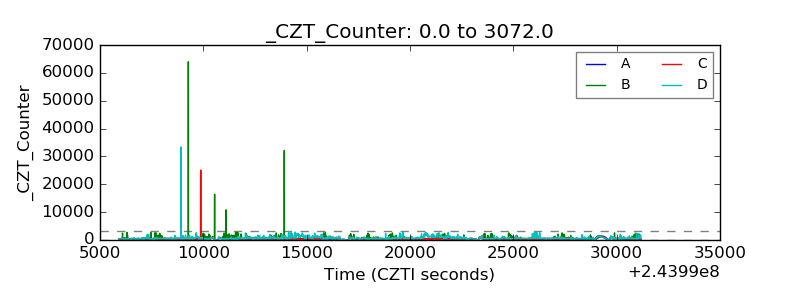 |
| +2.5 Volts monitor |  |
| +5 Volts monitor | 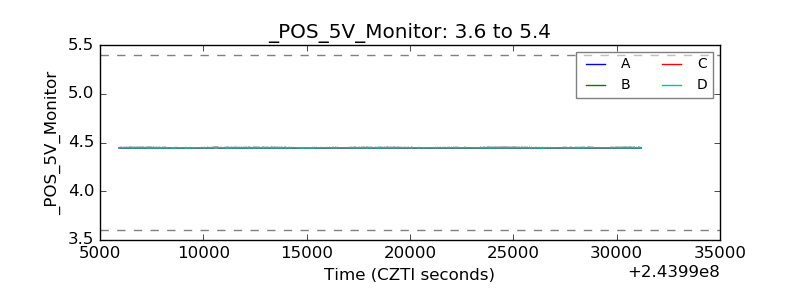 |
| _ROLL_ROT | 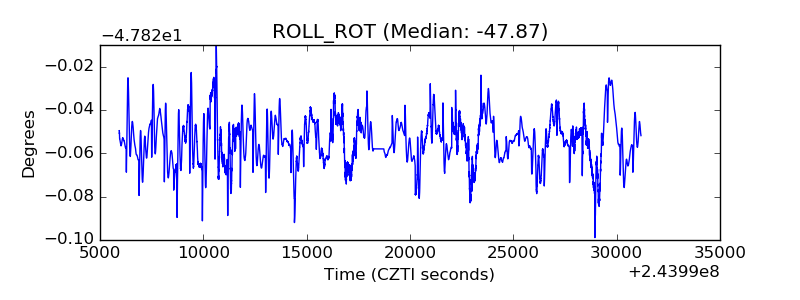 |
| _Roll_DEC |  |
| _Roll_RA | 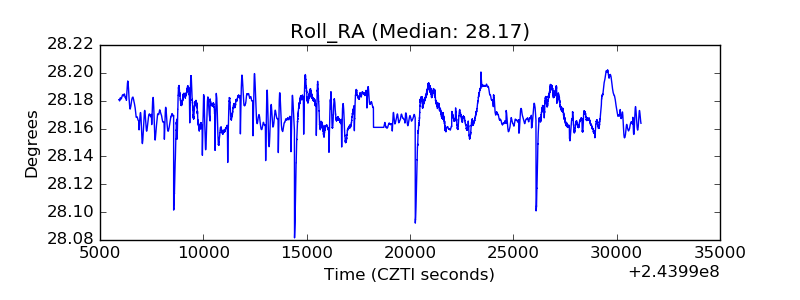 |
| Veto Counter | 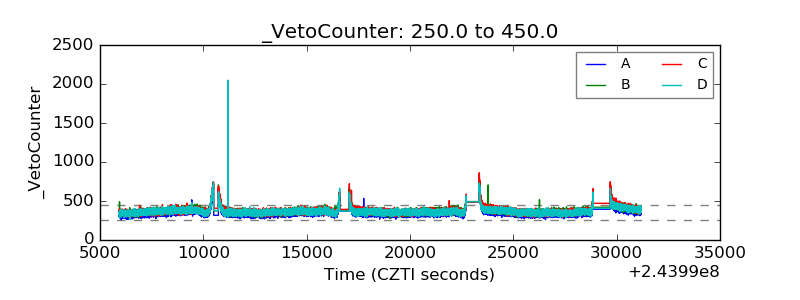 |