| Param | Original file | Final file |
|---|---|---|
| Filename | modeM0/AS1G07_014T02_9000001556_10778cztM0_level2.evt | modeM0/AS1G07_014T02_9000001556_10778cztM0_level2_quad_clean.evt |
| Size (bytes) | 538,911,360 | 73,370,880 |
| Size | 513.9 MB | 70.0 MB |
| Events in quadrant A | 3,061,017 | 446,405 |
| Events in quadrant B | 4,922,664 | 438,205 |
| Events in quadrant C | 3,034,298 | 449,913 |
| Events in quadrant D | 4,854,071 | 425,355 |
| Mode SS | |||
|---|---|---|---|
| Quadrant | BADHDUFLAG | Total packets | Discarded packets |
| A | 0 | 136 | 0 |
| B | 0 | 136 | 0 |
| C | 0 | 136 | 0 |
| D | 0 | 136 | 0 |
| Mode M9 | |||
|---|---|---|---|
| Quadrant | BADHDUFLAG | Total packets | Discarded packets |
| A | 0 | 15 | 0 |
| B | 0 | 15 | 0 |
| C | 0 | 15 | 0 |
| D | 0 | 16 | 0 |
| Mode M0 | |||
|---|---|---|---|
| Quadrant | BADHDUFLAG | Total packets | Discarded packets |
| A | 0 | 13549 | 3 |
| B | 0 | 18987 | 2 |
| C | 0 | 13548 | 2 |
| D | 0 | 18898 | 2 |
| Quadrant | Total seconds | Saturated seconds | Saturation percentage |
|---|---|---|---|
| A | 6613 | 76 | 1.149251% |
| B | 6613 | 638 | 9.647664% |
| C | 6613 | 53 | 0.801452% |
| D | 6613 | 271 | 4.097989% |
Noise dominated data is calculated using 1-second bins in cleaned event files. If a bin has >2000 counts, and if more than 50% of those come from <1% of pixels, then it is considered to be noise-dominated and hence unusable.
| Quadrant | # 1 sec bins | Bins with >0 counts | Bins with >2000 counts | High rate bins dominated by noise | Noise dominated (total time) | Noise dominated (detector-on time) | Marked lightcurve |
|---|---|---|---|---|---|---|---|
| A | 7558 | 6613 | 1 | 1 | 0.01% | 0.02% | 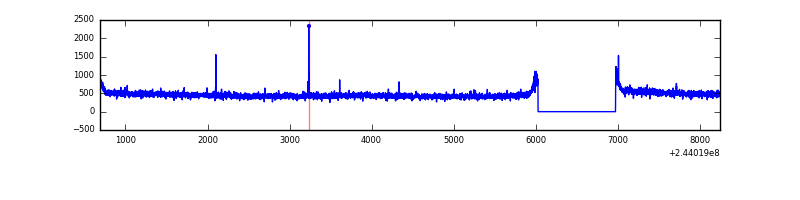 |
| B | 7558 | 6613 | 357 | 357 | 4.72% | 5.40% | 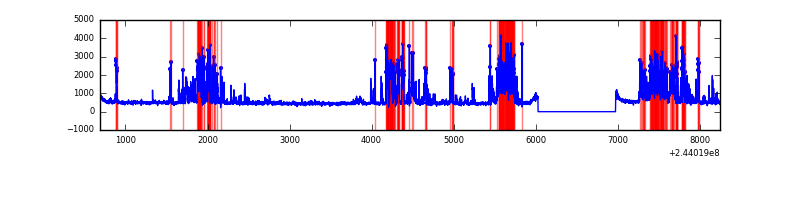 |
| C | 7558 | 6613 | 0 | 0 | 0.00% | 0.00% | 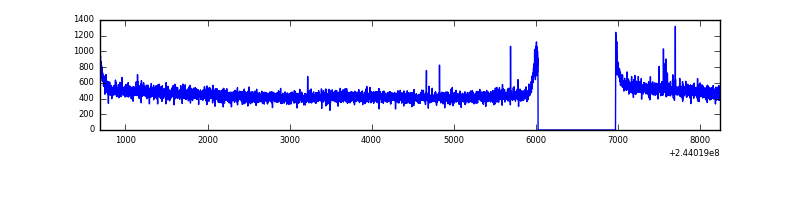 |
| D | 7558 | 6613 | 183 | 183 | 2.42% | 2.77% | 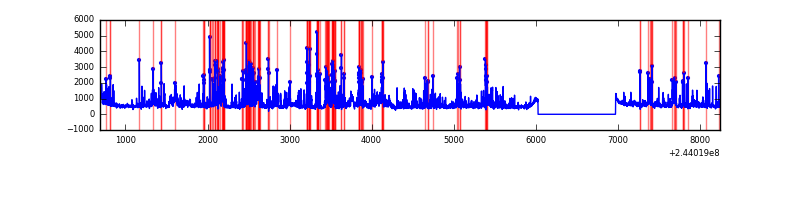 |
Top three noisy pixels from each quadrant. If the there are fewer than three noisy pixels in the level2.evt file, extra rows are filled as -1
| Pixel properties | Quadrant properties | ||||||
|---|---|---|---|---|---|---|---|
| Quadrant | DetID | PixID | Counts | Sigma | Mean | Median | Sigma |
| A | 1 | 162 | 10721 | 62.48 | 789 | 770 | 159.3 |
| A | 0 | 226 | 7234 | 40.59 | 789 | 770 | 159.3 |
| A | 12 | 194 | 6365 | 35.13 | 789 | 770 | 159.3 |
| B | 4 | 239 | 1786039 | 12063.82 | 767 | 749 | 148.0 |
| B | 15 | 204 | 84163 | 563.66 | 767 | 749 | 148.0 |
| B | 0 | 214 | 43699 | 290.23 | 767 | 749 | 148.0 |
| C | 14 | 234 | 6967 | 34.35 | 776 | 779 | 180.1 |
| C | 13 | 61 | 5753 | 27.61 | 776 | 779 | 180.1 |
| C | 8 | 222 | 2434 | 9.19 | 776 | 779 | 180.1 |
| D | 1 | 52 | 799971 | 4311.61 | 764 | 743 | 185.4 |
| D | 13 | 104 | 449423 | 2420.5 | 764 | 743 | 185.4 |
| D | 10 | 157 | 178288 | 957.8 | 764 | 743 | 185.4 |
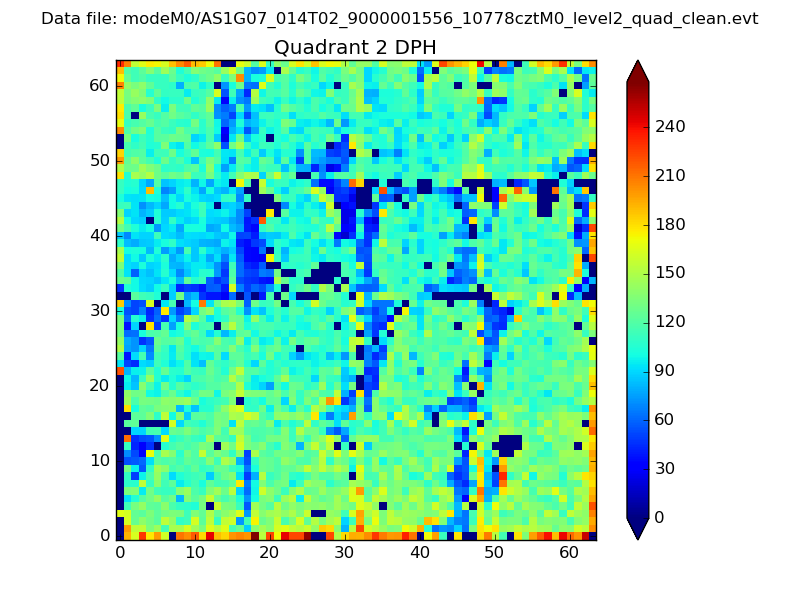
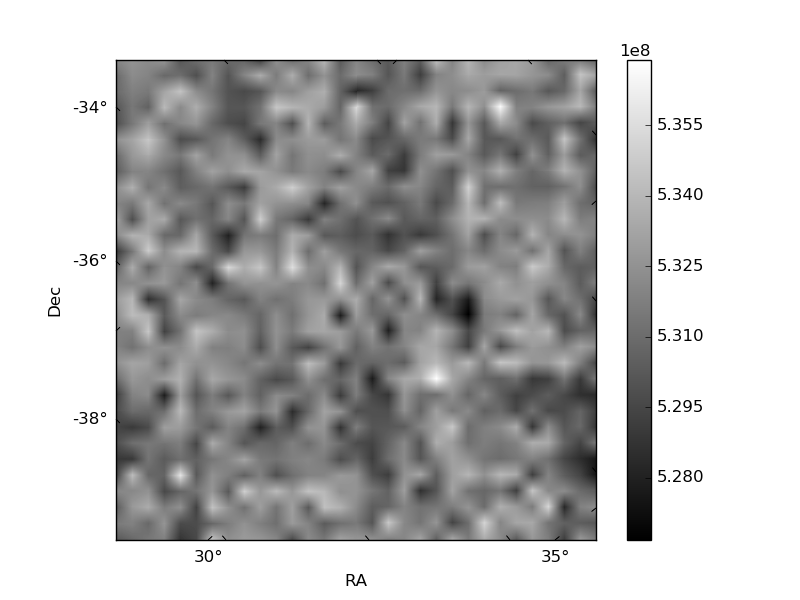
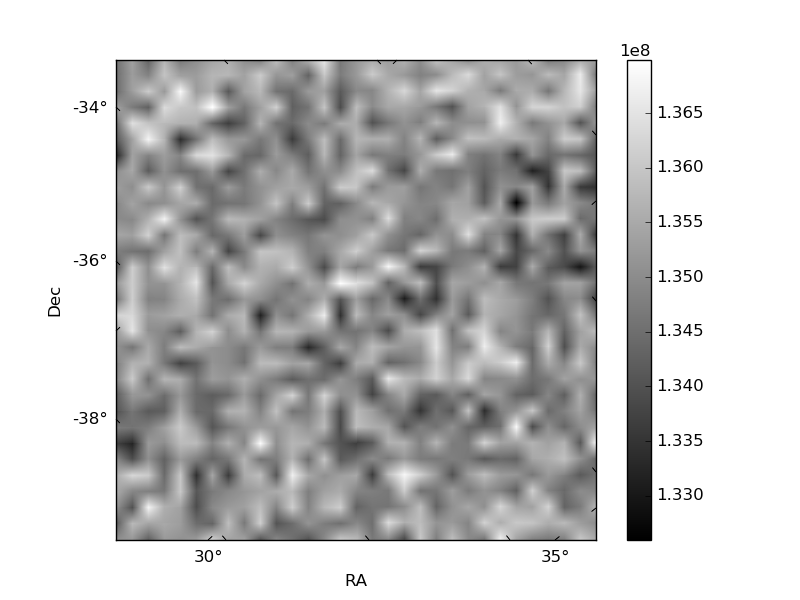
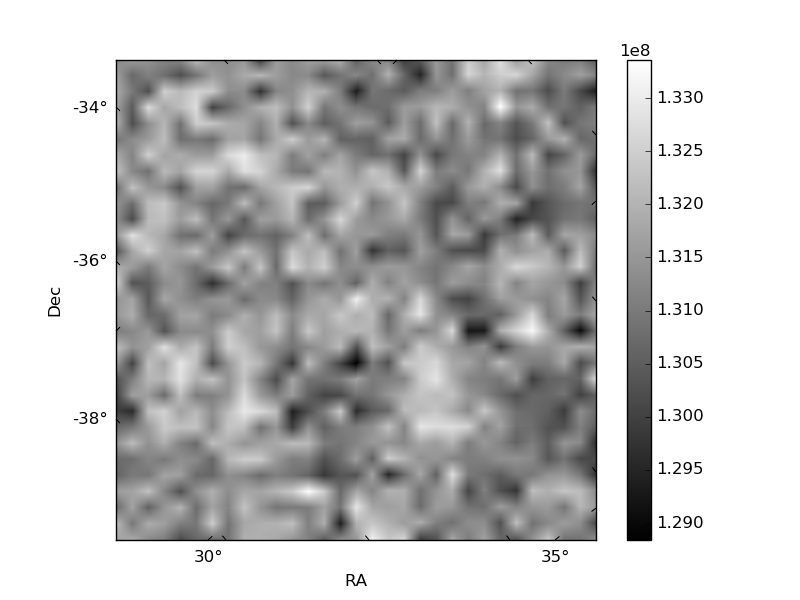
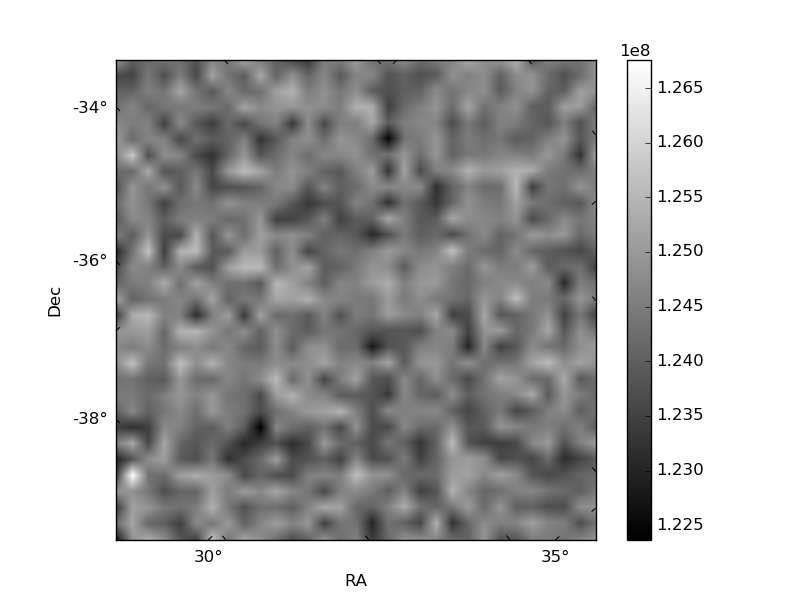
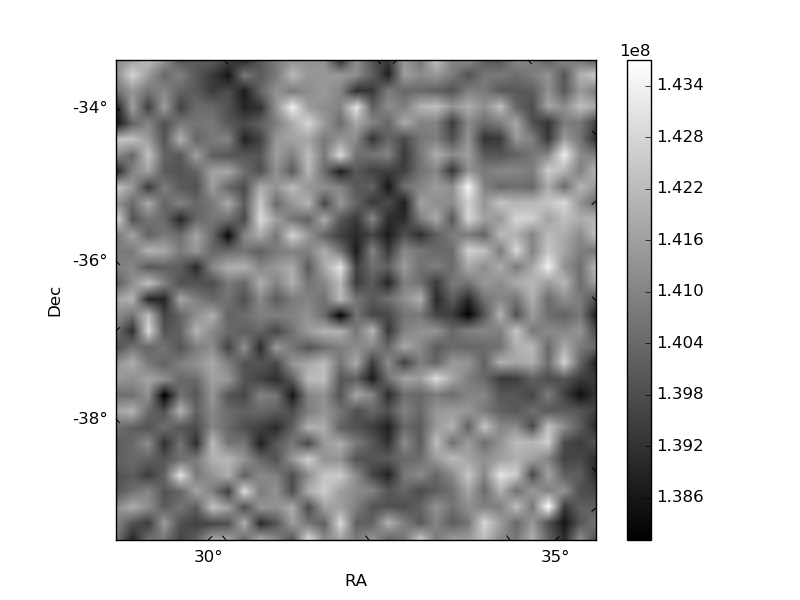
Histogram calculated using DETX and DETY for each event in the final _common_clean file
| Quadrant A | 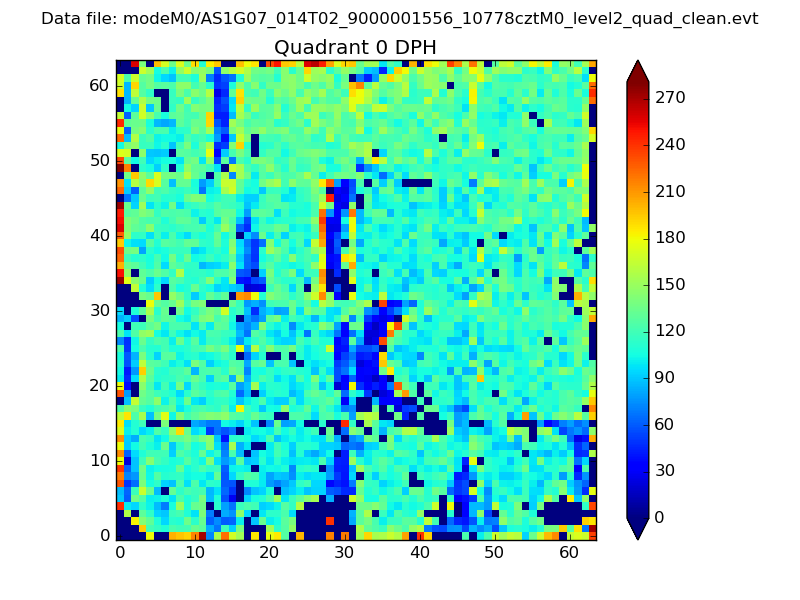 |
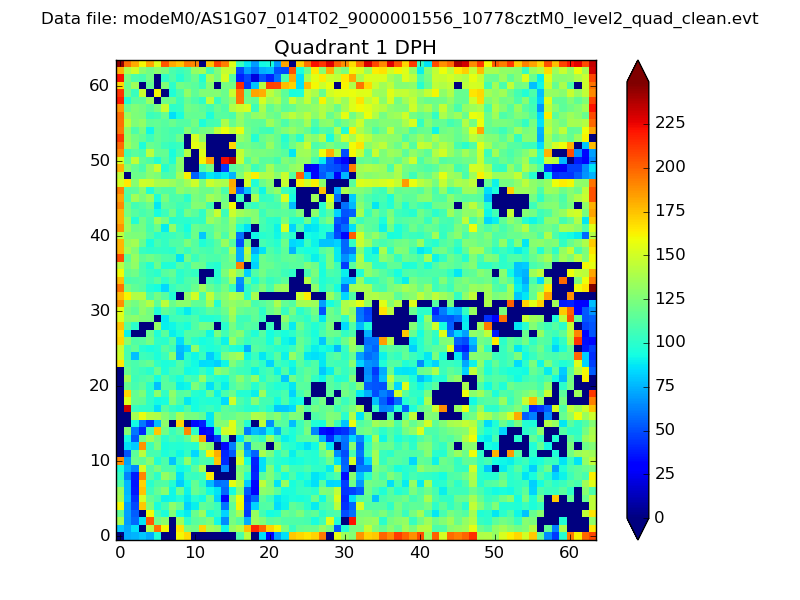 |
Quadrant B |
|---|---|---|---|
| Quadrant D | 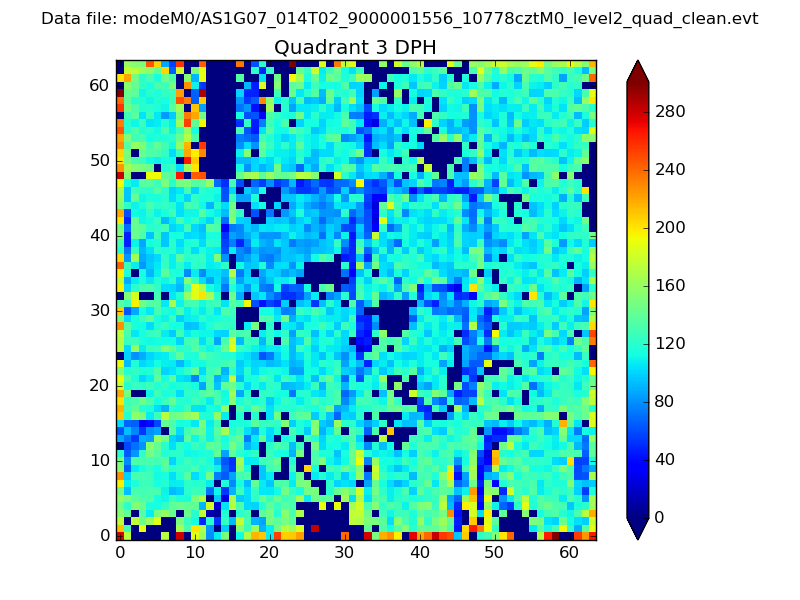 |
 |
Quadrant C |
| Plot type | Count rate plots | Images |
|---|---|---|
| Comparison with Poisson distribution Blue bars denote a histogram of data divided into 1 sec bins. Red curve is a Poisson curve with rate = median count rate of data. |
 |
 |
| Quadrant-wise count rates Data is divided into 100 sec bins |
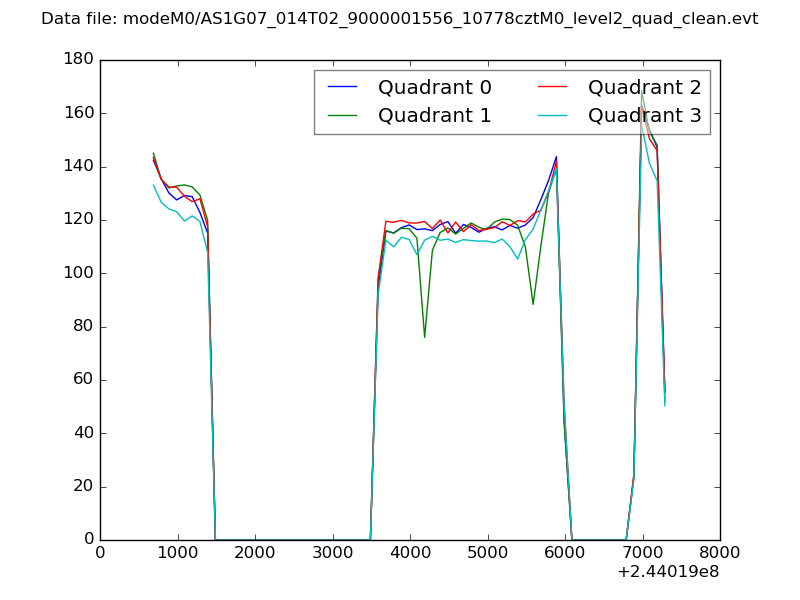 |
|
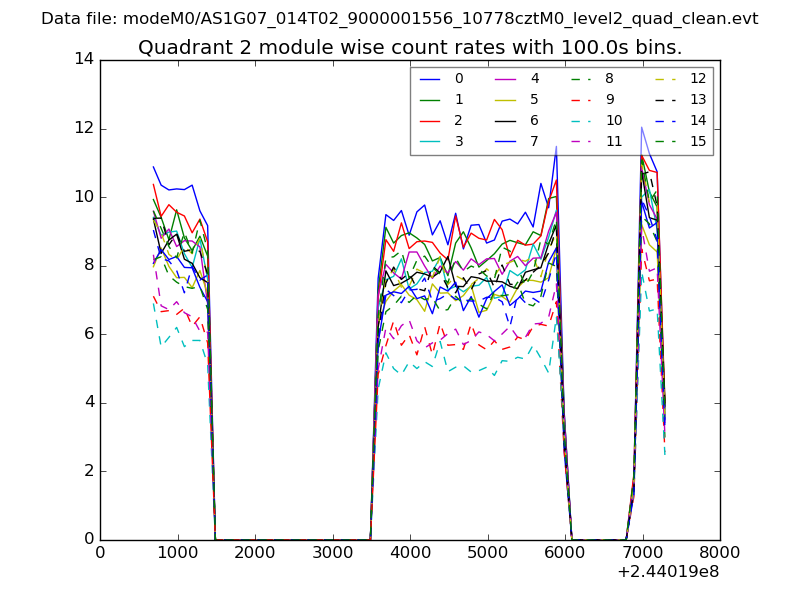
| Module-wise count rates for Quadrant A Data is divided into 100 sec bins |
 |
 |
| Module-wise count rates for Quadrant B Data is divided into 100 sec bins |
 |
 |
| Module-wise count rates for Quadrant C Data is divided into 100 sec bins |
 |
 |
| Module-wise count rates for Quadrant D Data is divided into 100 sec bins |
 |
 |
| Parameter | Plot |
|---|---|
| CZT HV Monitor | 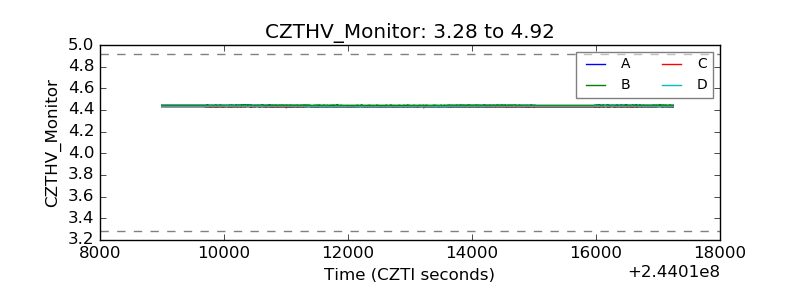 |
| D_VDD | 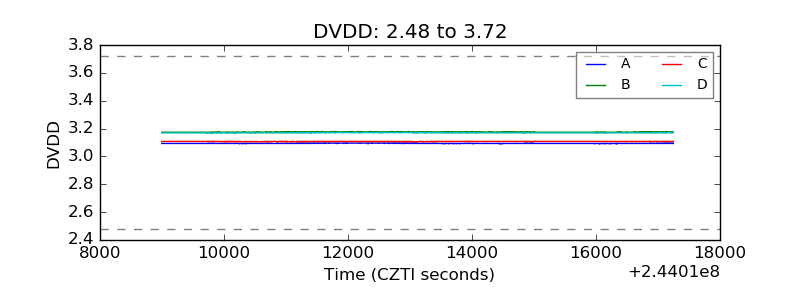 |
| Temperature 1 | 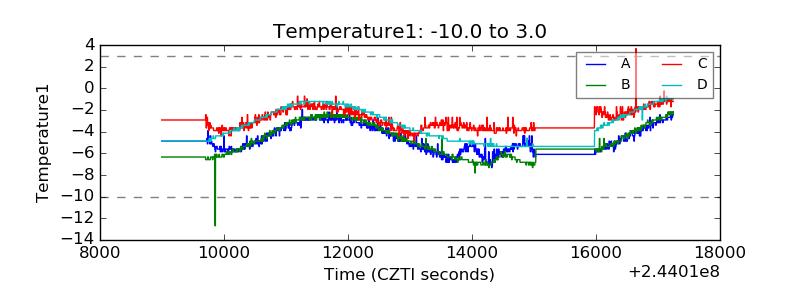 |
| Veto HV Monitor | 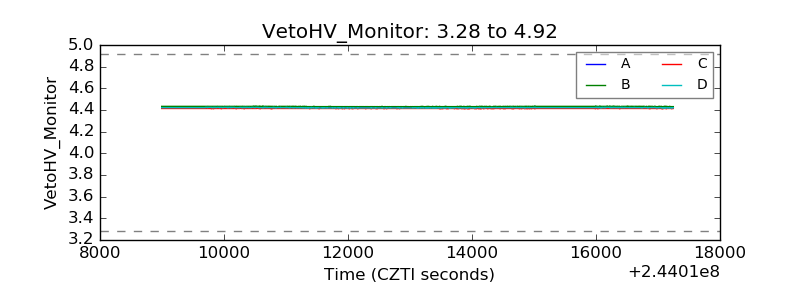 |
| Veto LLD | 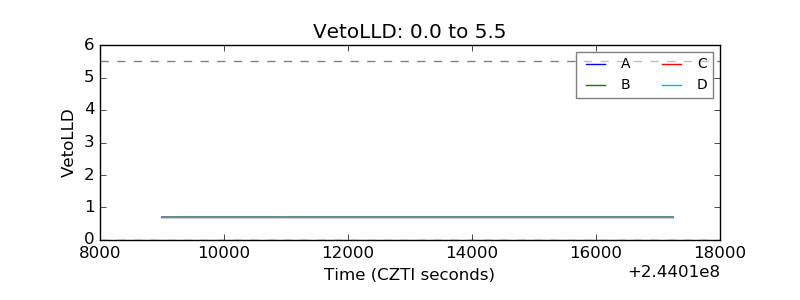 |
| Alpha Counter | 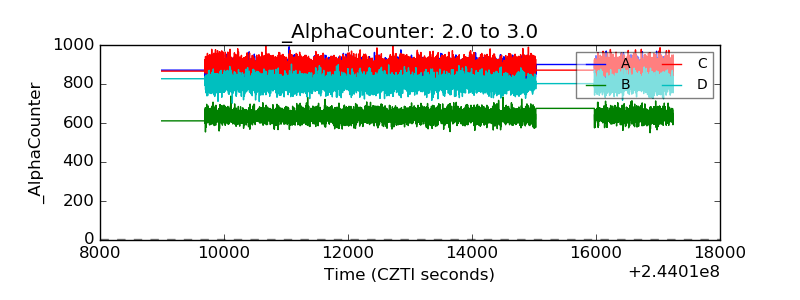 |
| _CPM_Rate | 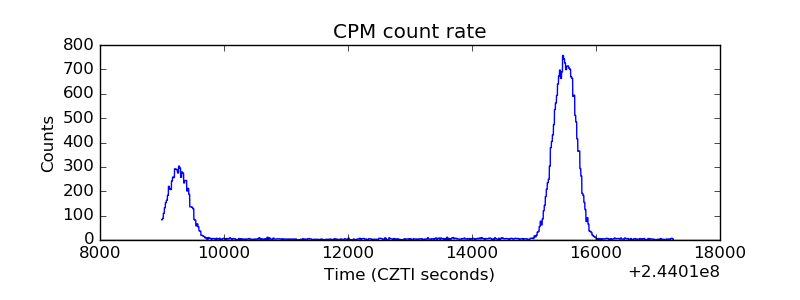 |
| CZT Counter | 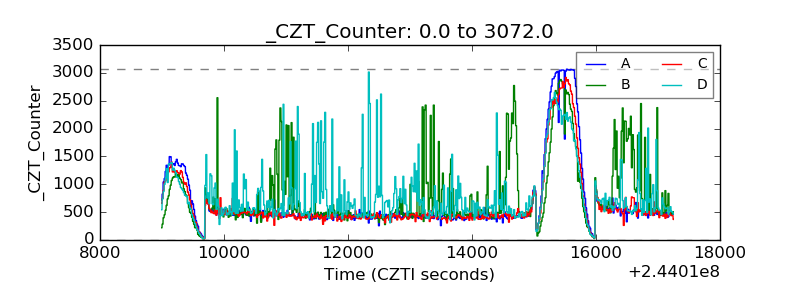 |
| +2.5 Volts monitor |  |
| +5 Volts monitor |  |
| _ROLL_ROT |  |
| _Roll_DEC |  |
| _Roll_RA | 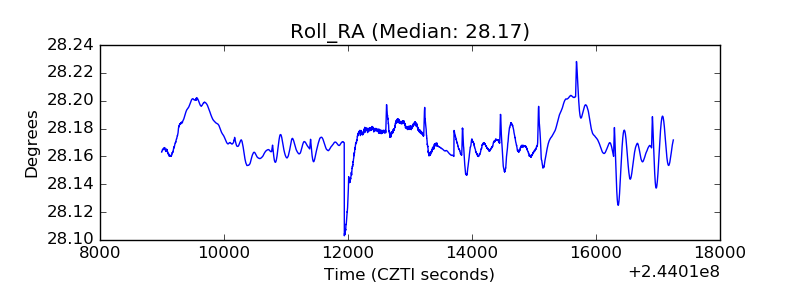 |
| Veto Counter |  |