| Param | Original file | Final file |
|---|---|---|
| Filename | modeM0/AS1G07_014T02_9000001556_10782cztM0_level2.evt | modeM0/AS1G07_014T02_9000001556_10782cztM0_level2_quad_clean.evt |
| Size (bytes) | 248,143,680 | 42,416,640 |
| Size | 236.6 MB | 40.5 MB |
| Events in quadrant A | 1,677,825 | 264,305 |
| Events in quadrant B | 2,139,337 | 260,724 |
| Events in quadrant C | 1,612,673 | 261,059 |
| Events in quadrant D | 1,846,661 | 250,873 |
| Mode SS | |||
|---|---|---|---|
| Quadrant | BADHDUFLAG | Total packets | Discarded packets |
| A | 0 | 68 | 0 |
| B | 0 | 68 | 0 |
| C | 0 | 68 | 0 |
| D | 0 | 68 | 0 |
| Mode M0 | |||
|---|---|---|---|
| Quadrant | BADHDUFLAG | Total packets | Discarded packets |
| A | 0 | 7275 | 0 |
| B | 0 | 8552 | 0 |
| C | 0 | 7142 | 0 |
| D | 0 | 7892 | 0 |
| Quadrant | Total seconds | Saturated seconds | Saturation percentage |
|---|---|---|---|
| A | 3492 | 9 | 0.257732% |
| B | 3492 | 120 | 3.436426% |
| C | 3492 | 3 | 0.085911% |
| D | 3492 | 4 | 0.114548% |
Noise dominated data is calculated using 1-second bins in cleaned event files. If a bin has >2000 counts, and if more than 50% of those come from <1% of pixels, then it is considered to be noise-dominated and hence unusable.
| Quadrant | # 1 sec bins | Bins with >0 counts | Bins with >2000 counts | High rate bins dominated by noise | Noise dominated (total time) | Noise dominated (detector-on time) | Marked lightcurve |
|---|---|---|---|---|---|---|---|
| A | 3492 | 3492 | 0 | 0 | 0.00% | 0.00% | 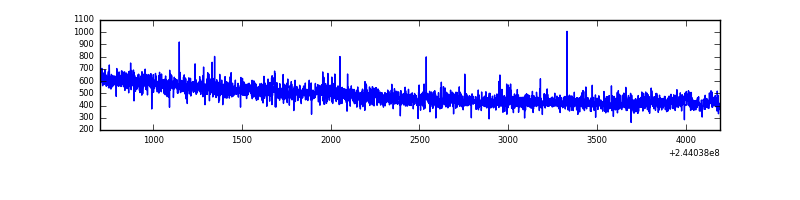 |
| B | 3492 | 3492 | 87 | 87 | 2.49% | 2.49% | 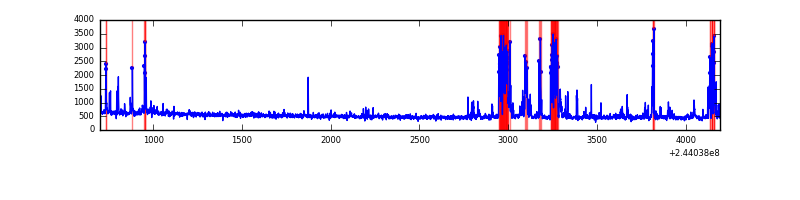 |
| C | 3492 | 3492 | 0 | 0 | 0.00% | 0.00% | 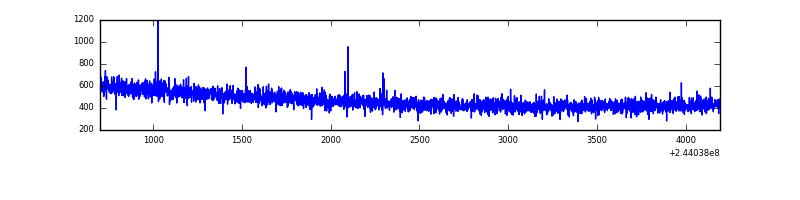 |
| D | 3492 | 3492 | 2 | 2 | 0.06% | 0.06% | 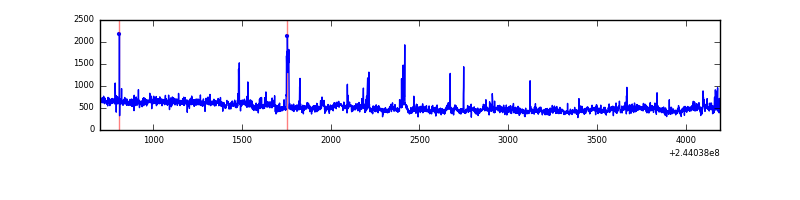 |
Top three noisy pixels from each quadrant. If the there are fewer than three noisy pixels in the level2.evt file, extra rows are filled as -1
| Pixel properties | Quadrant properties | ||||||
|---|---|---|---|---|---|---|---|
| Quadrant | DetID | PixID | Counts | Sigma | Mean | Median | Sigma |
| A | 13 | 253 | 4133 | 42.35 | 432 | 425 | 87.6 |
| A | 0 | 226 | 3981 | 40.61 | 432 | 425 | 87.6 |
| A | 1 | 162 | 3884 | 39.5 | 432 | 425 | 87.6 |
| B | 4 | 239 | 418865 | 5170.88 | 427 | 418 | 80.9 |
| B | 15 | 204 | 23736 | 288.15 | 427 | 418 | 80.9 |
| B | 0 | 214 | 22299 | 270.39 | 427 | 418 | 80.9 |
| C | 13 | 61 | 3136 | 28.46 | 413 | 416 | 95.6 |
| C | 14 | 234 | 2394 | 20.7 | 413 | 416 | 95.6 |
| C | 3 | 202 | 1061 | 6.75 | 413 | 416 | 95.6 |
| D | 8 | 195 | 200223 | 2009.12 | 410 | 399 | 99.5 |
| D | 5 | 222 | 31287 | 310.56 | 410 | 399 | 99.5 |
| D | 7 | 71 | 23355 | 230.81 | 410 | 399 | 99.5 |
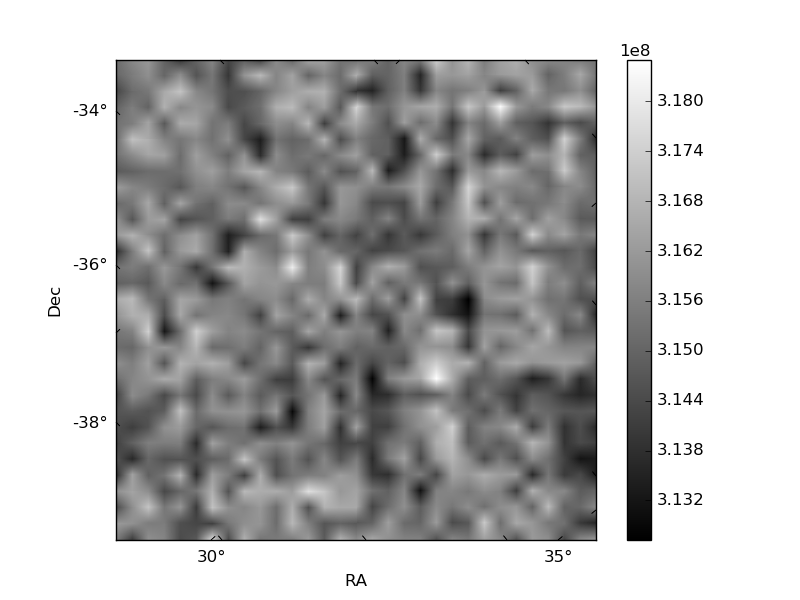
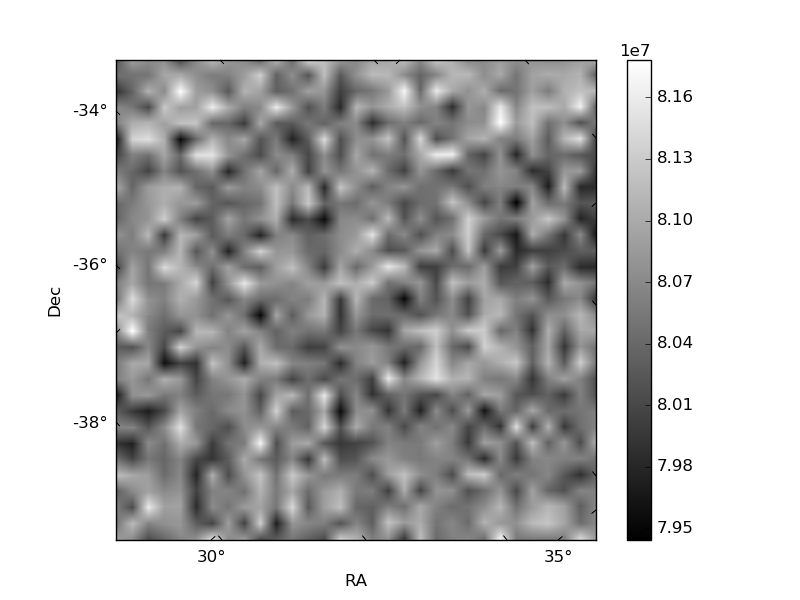
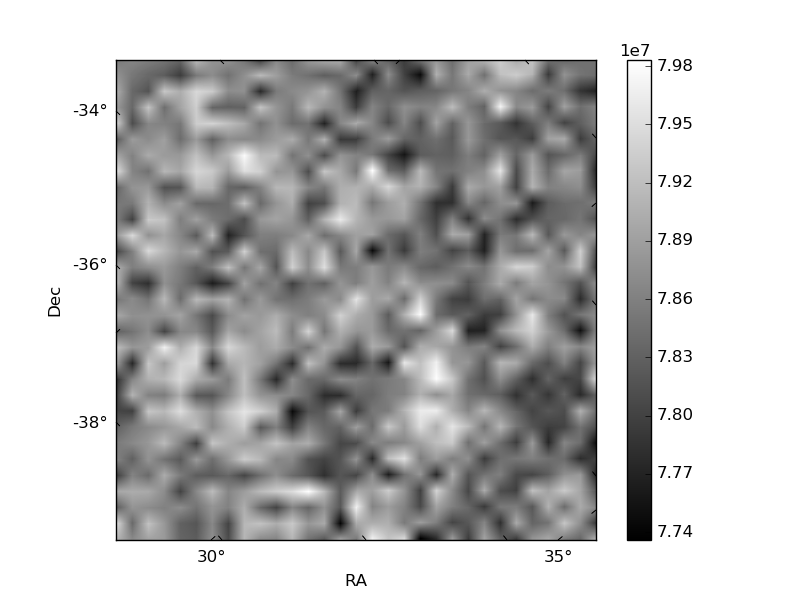
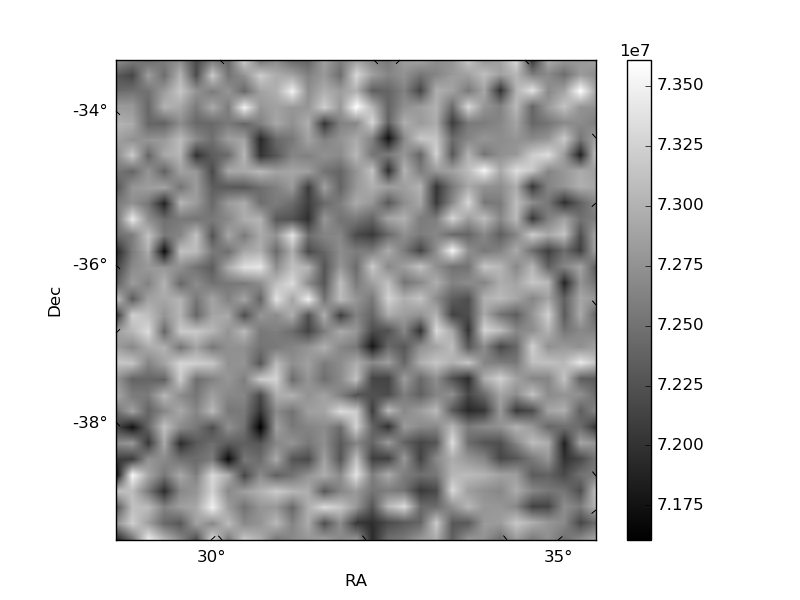
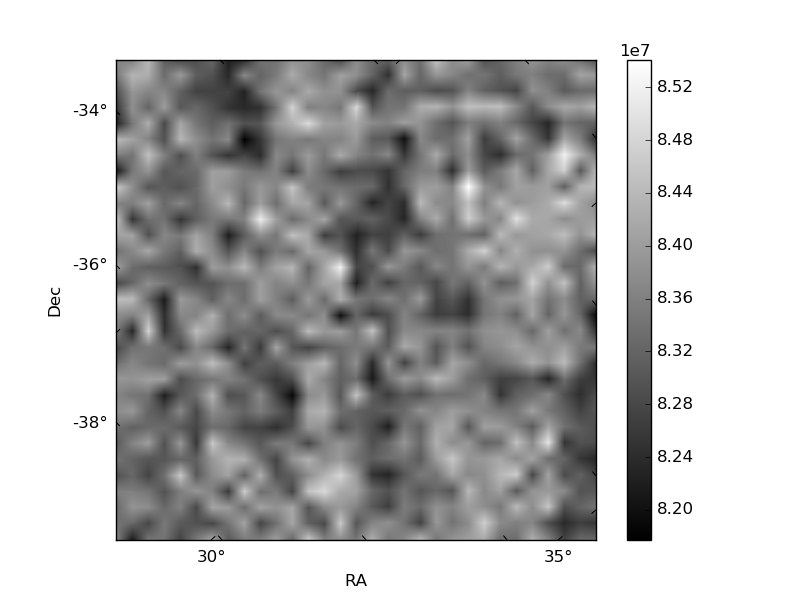
Histogram calculated using DETX and DETY for each event in the final _common_clean file
| Quadrant A | 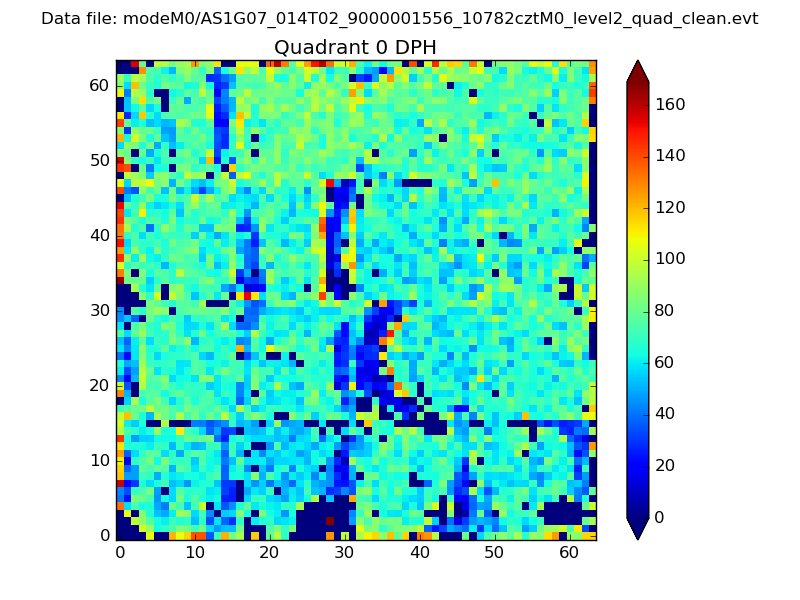 |
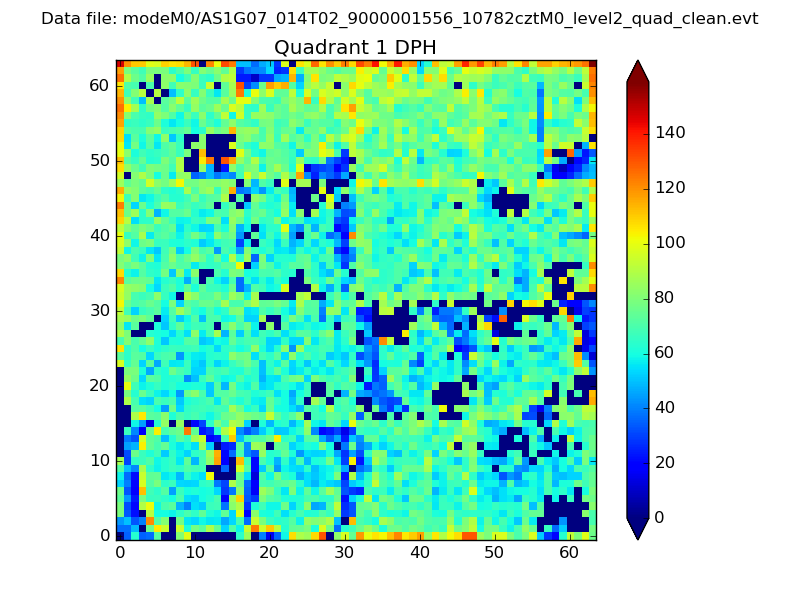 |
Quadrant B |
|---|---|---|---|
| Quadrant D | 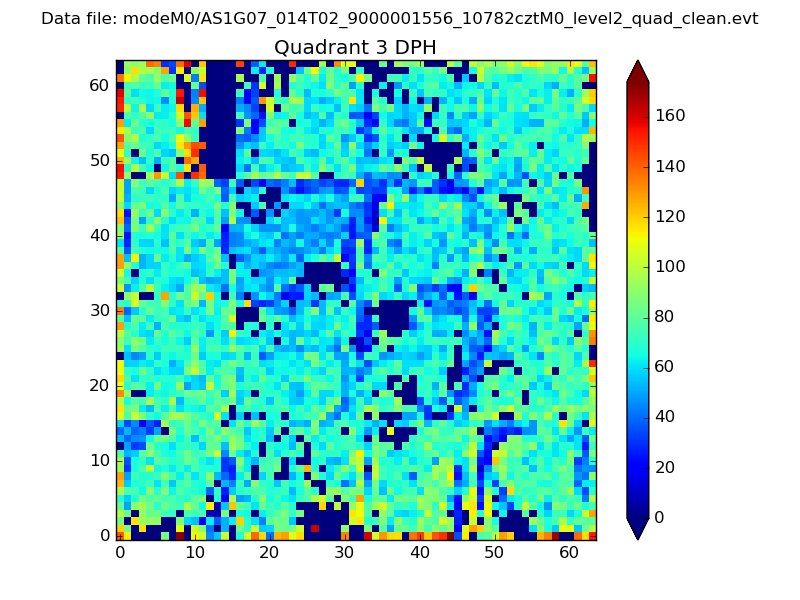 |
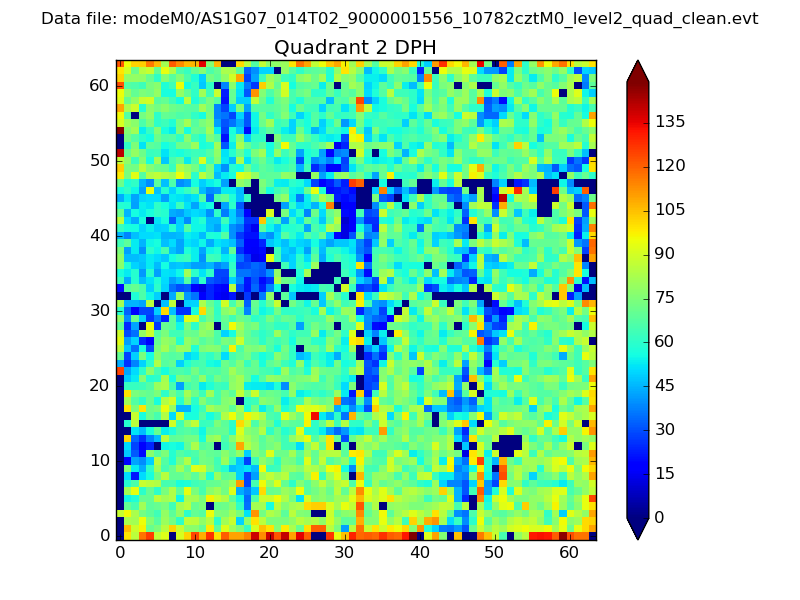 |
Quadrant C |
| Plot type | Count rate plots | Images |
|---|---|---|
| Comparison with Poisson distribution Blue bars denote a histogram of data divided into 1 sec bins. Red curve is a Poisson curve with rate = median count rate of data. |
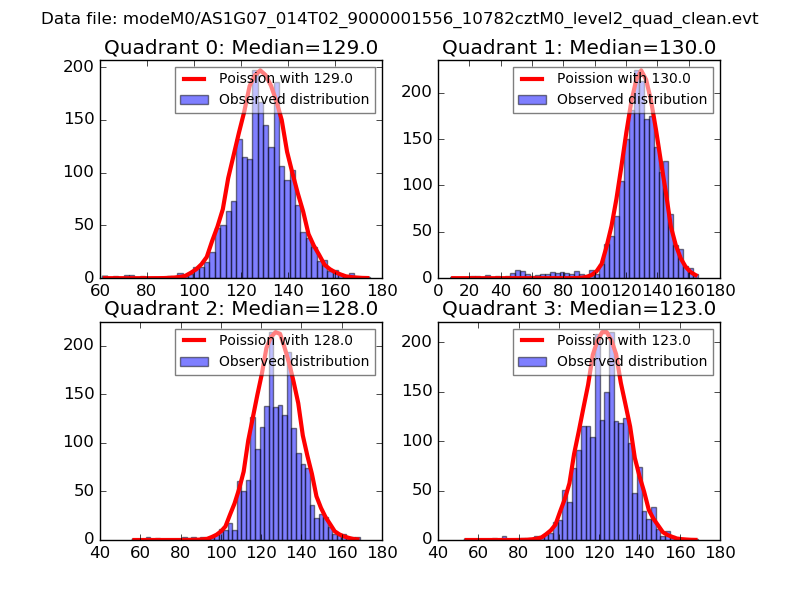 |
 |
| Quadrant-wise count rates Data is divided into 100 sec bins |
 |
|
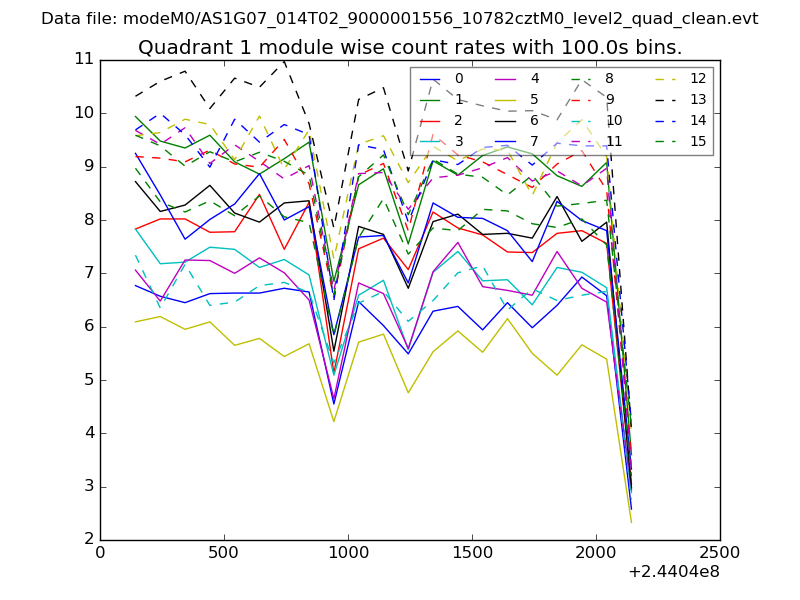
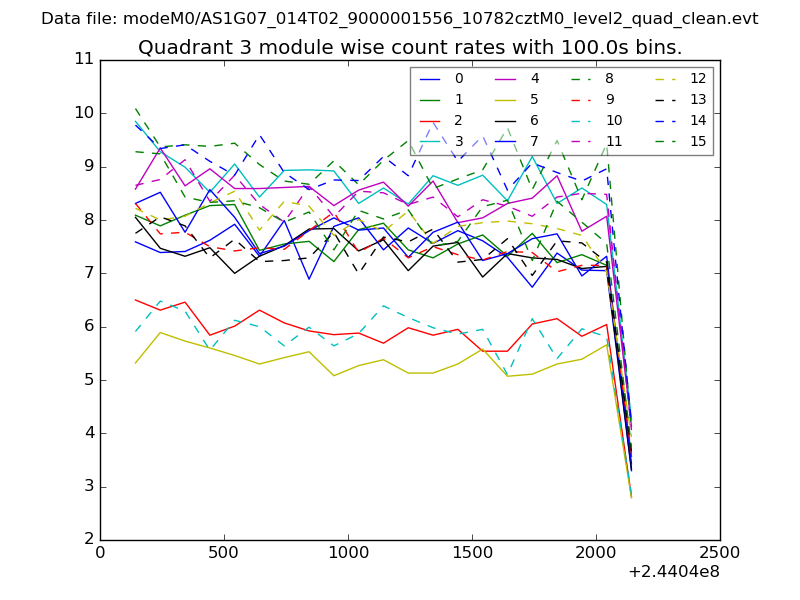
| Module-wise count rates for Quadrant A Data is divided into 100 sec bins |
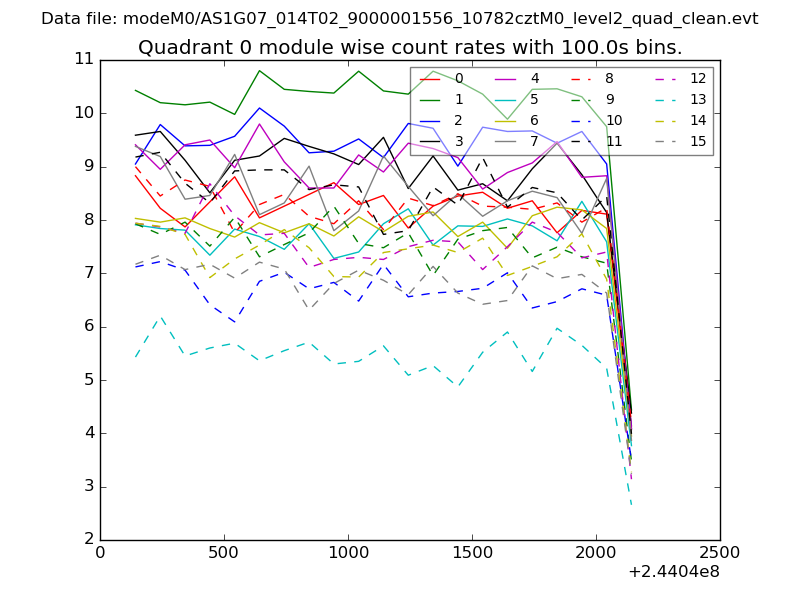 |
 |
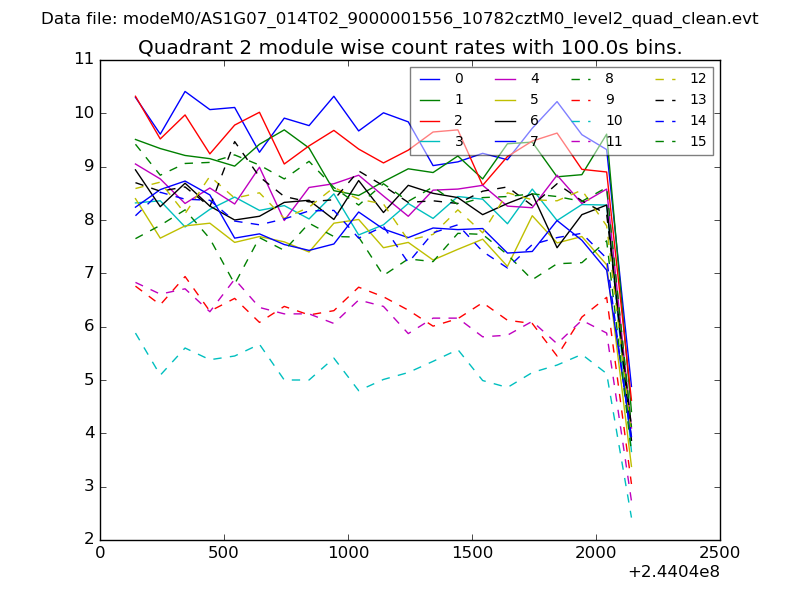
| Module-wise count rates for Quadrant B Data is divided into 100 sec bins |
 |
 |
| Module-wise count rates for Quadrant C Data is divided into 100 sec bins |
 |
 |
| Module-wise count rates for Quadrant D Data is divided into 100 sec bins |
 |
 |
| Parameter | Plot |
|---|---|
| CZT HV Monitor | 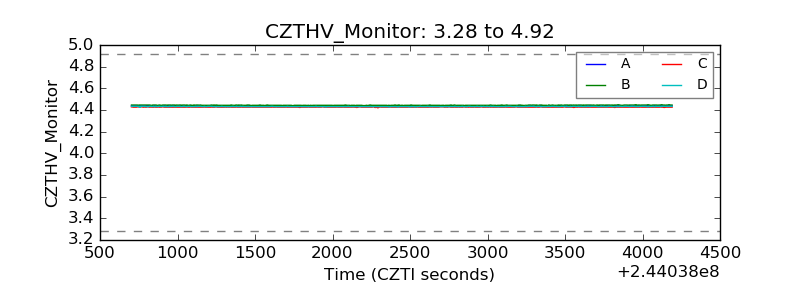 |
| D_VDD | 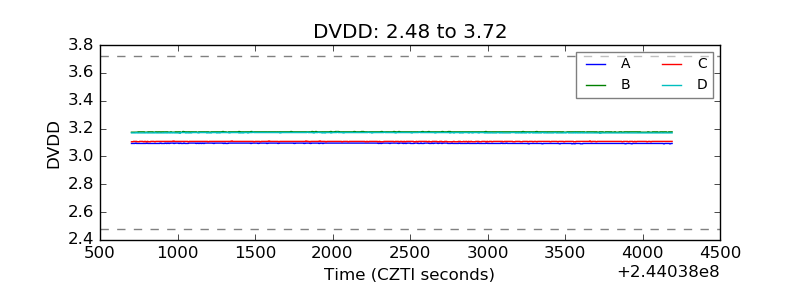 |
| Temperature 1 | 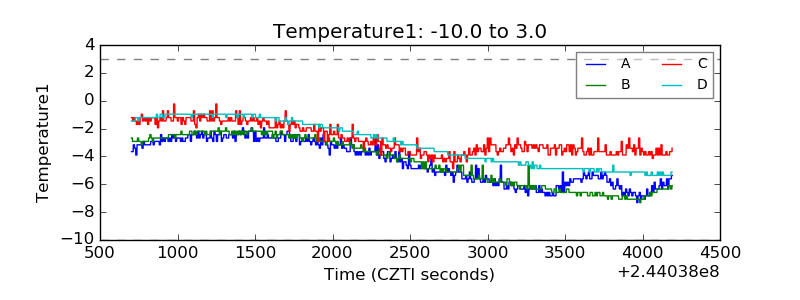 |
| Veto HV Monitor | 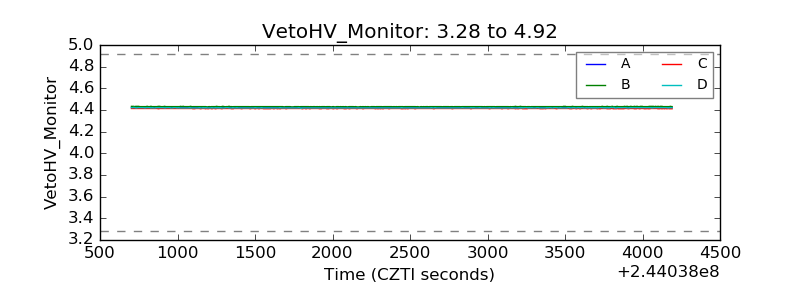 |
| Veto LLD | 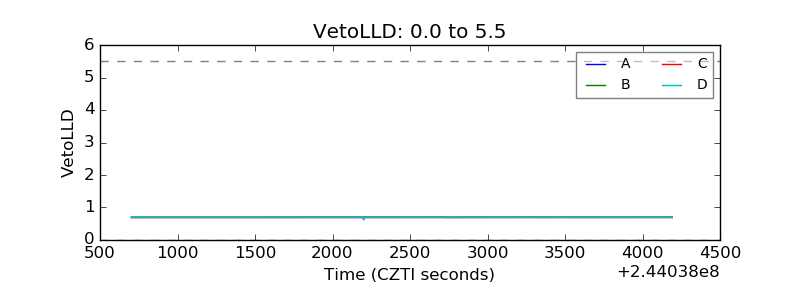 |
| Alpha Counter | 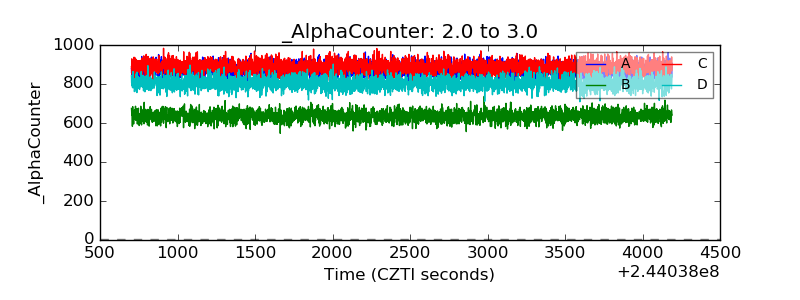 |
| _CPM_Rate | 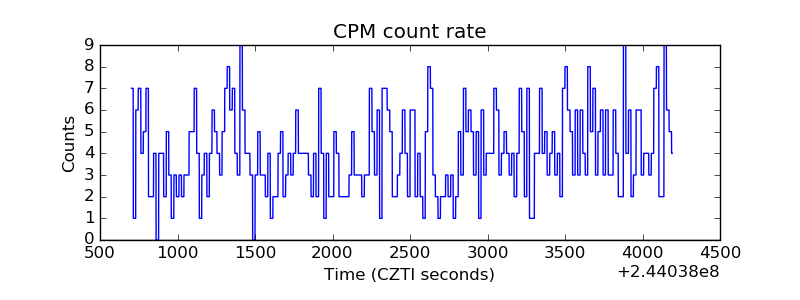 |
| CZT Counter | 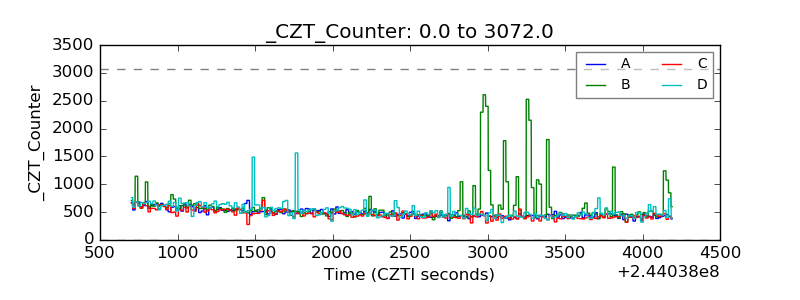 |
| +2.5 Volts monitor |  |
| +5 Volts monitor |  |
| _ROLL_ROT | 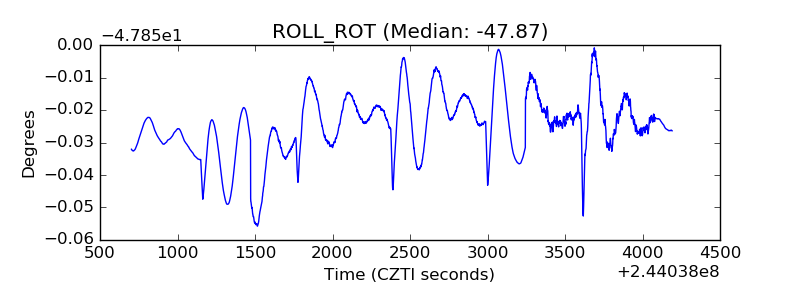 |
| _Roll_DEC | 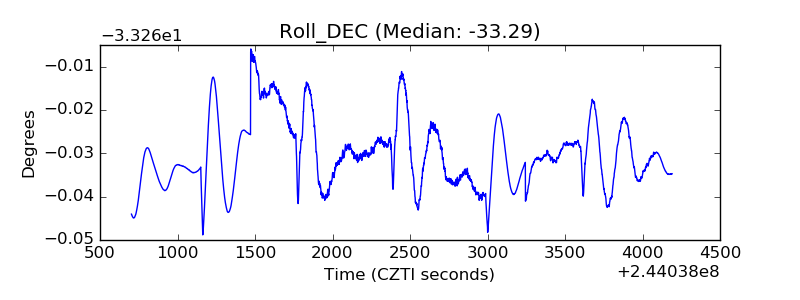 |
| _Roll_RA | 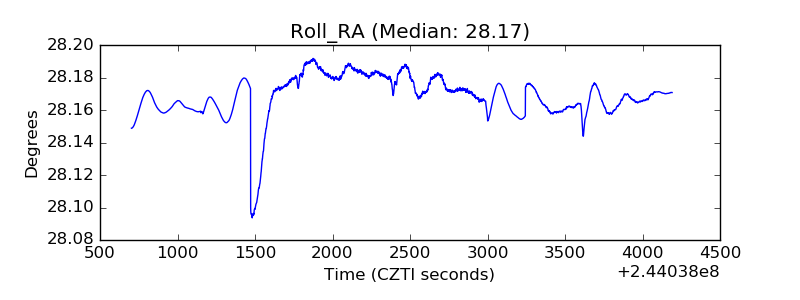 |
| Veto Counter | 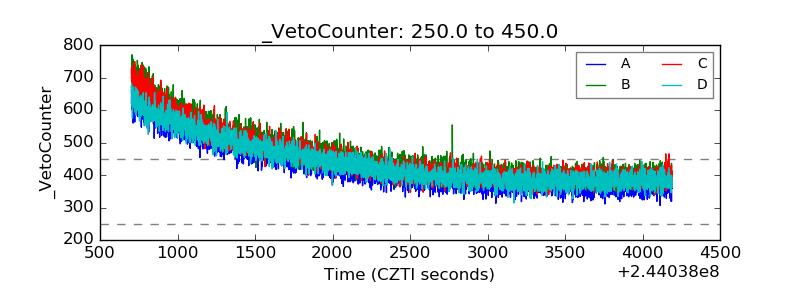 |