| Param | Original file | Final file |
|---|---|---|
| Filename | modeM0/AS1G07_032T01_9000001554_10773cztM0_level2.evt | modeM0/AS1G07_032T01_9000001554_10773cztM0_level2_quad_clean.evt |
| Size (bytes) | 477,504,000 | 69,310,080 |
| Size | 455.4 MB | 66.1 MB |
| Events in quadrant A | 3,701,205 | 418,888 |
| Events in quadrant B | 4,157,940 | 436,118 |
| Events in quadrant C | 2,546,870 | 440,455 |
| Events in quadrant D | 3,675,570 | 412,209 |
| Mode SS | |||
|---|---|---|---|
| Quadrant | BADHDUFLAG | Total packets | Discarded packets |
| A | 0 | 126 | 8 |
| B | 0 | 126 | 14 |
| C | 0 | 126 | 18 |
| D | 0 | 126 | 18 |
| Mode M9 | |||
|---|---|---|---|
| Quadrant | BADHDUFLAG | Total packets | Discarded packets |
| A | 0 | 9 | 1 |
| B | 0 | 9 | 1 |
| C | 0 | 9 | 1 |
| D | 0 | 9 | 2 |
| Mode M0 | |||
|---|---|---|---|
| Quadrant | BADHDUFLAG | Total packets | Discarded packets |
| A | 0 | 16933 | 2146 |
| B | 0 | 17787 | 1722 |
| C | 0 | 12747 | 1095 |
| D | 0 | 16244 | 1720 |
| Quadrant | Total seconds | Saturated seconds | Saturation percentage |
|---|---|---|---|
| A | 5503 | 155 | 2.816645% |
| B | 5602 | 539 | 9.621564% |
| C | 5659 | 26 | 0.459445% |
| D | 5565 | 119 | 2.138365% |
Noise dominated data is calculated using 1-second bins in cleaned event files. If a bin has >2000 counts, and if more than 50% of those come from <1% of pixels, then it is considered to be noise-dominated and hence unusable.
| Quadrant | # 1 sec bins | Bins with >0 counts | Bins with >2000 counts | High rate bins dominated by noise | Noise dominated (total time) | Noise dominated (detector-on time) | Marked lightcurve |
|---|---|---|---|---|---|---|---|
| A | 7084 | 5979 | 79 | 79 | 1.12% | 1.32% | 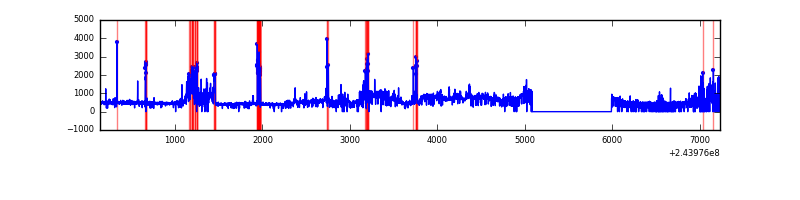 |
| B | 7086 | 6066 | 211 | 211 | 2.98% | 3.48% | 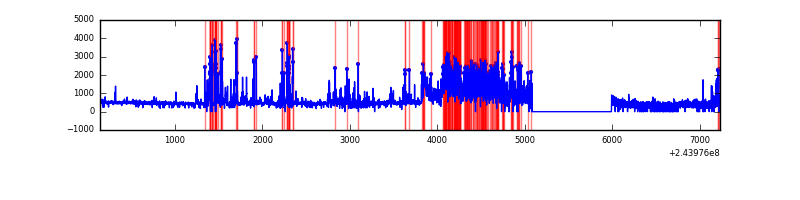 |
| C | 7086 | 6085 | 7 | 7 | 0.10% | 0.12% | 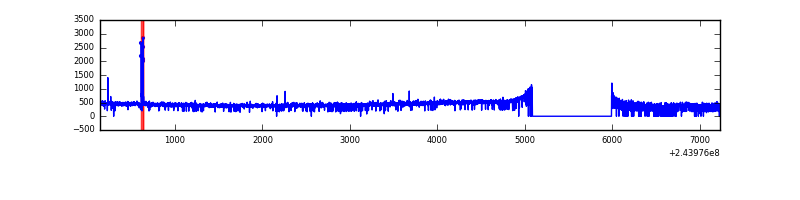 |
| D | 7086 | 6027 | 75 | 75 | 1.06% | 1.24% | 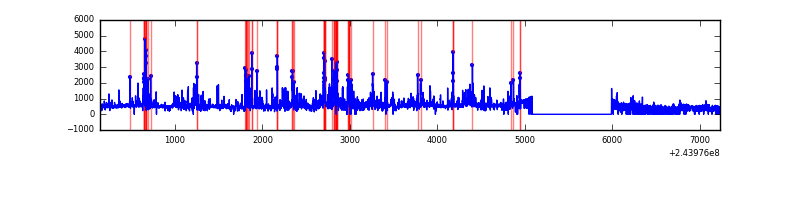 |
Top three noisy pixels from each quadrant. If the there are fewer than three noisy pixels in the level2.evt file, extra rows are filled as -1
| Pixel properties | Quadrant properties | ||||||
|---|---|---|---|---|---|---|---|
| Quadrant | DetID | PixID | Counts | Sigma | Mean | Median | Sigma |
| A | 15 | 239 | 1050141 | 8033.15 | 643 | 631 | 130.6 |
| A | 15 | 223 | 130449 | 993.65 | 643 | 631 | 130.6 |
| A | 15 | 174 | 8934 | 63.55 | 643 | 631 | 130.6 |
| B | 0 | 85 | 1018525 | 8196.8 | 646 | 630 | 124.2 |
| B | 4 | 239 | 551367 | 4434.92 | 646 | 630 | 124.2 |
| B | 0 | 214 | 28691 | 225.97 | 646 | 630 | 124.2 |
| C | 14 | 234 | 24765 | 159.86 | 647 | 651 | 150.8 |
| C | 13 | 61 | 4819 | 27.63 | 647 | 651 | 150.8 |
| C | 5 | 207 | 1811 | 7.69 | 647 | 651 | 150.8 |
| D | 1 | 52 | 383452 | 2515.91 | 627 | 610 | 152.2 |
| D | 13 | 104 | 376345 | 2469.2 | 627 | 610 | 152.2 |
| D | 8 | 195 | 222185 | 1456.12 | 627 | 610 | 152.2 |
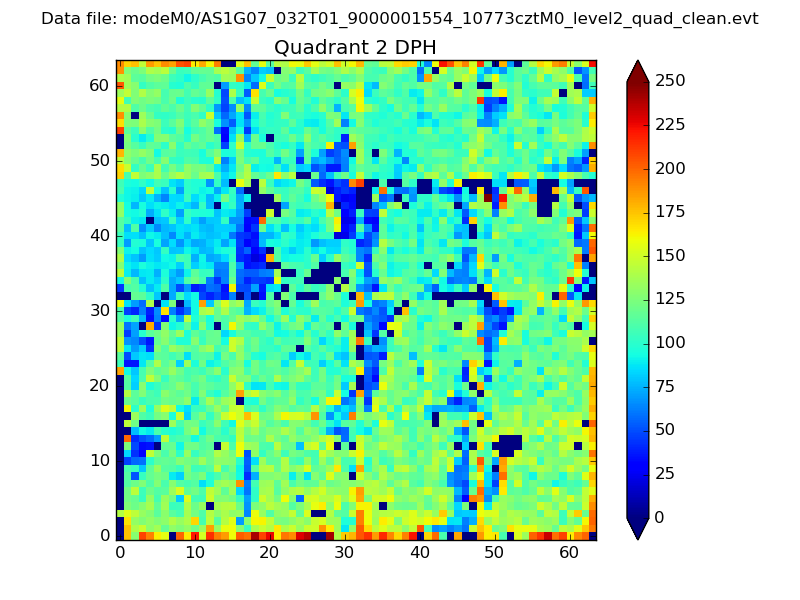
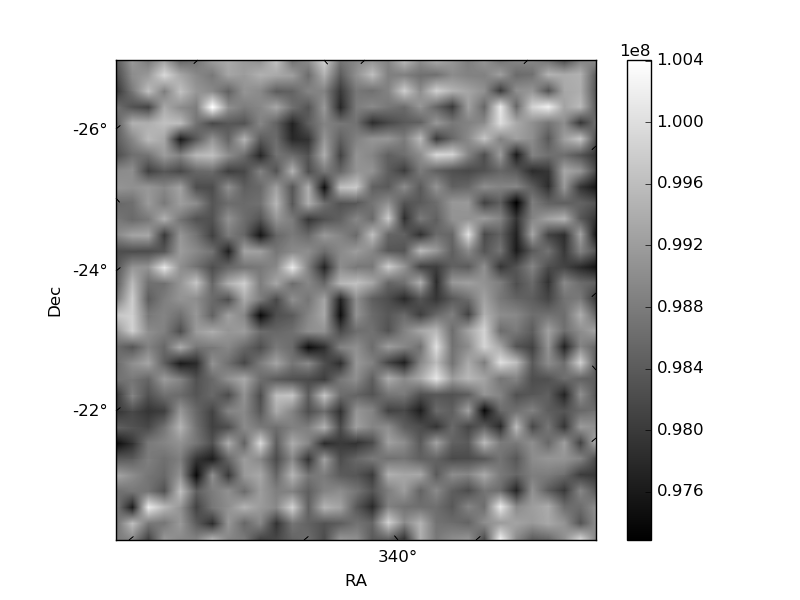
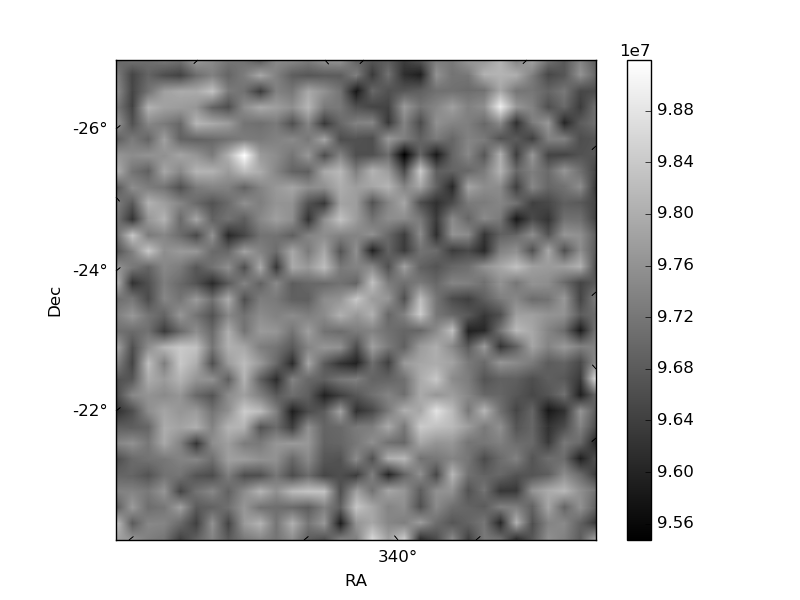
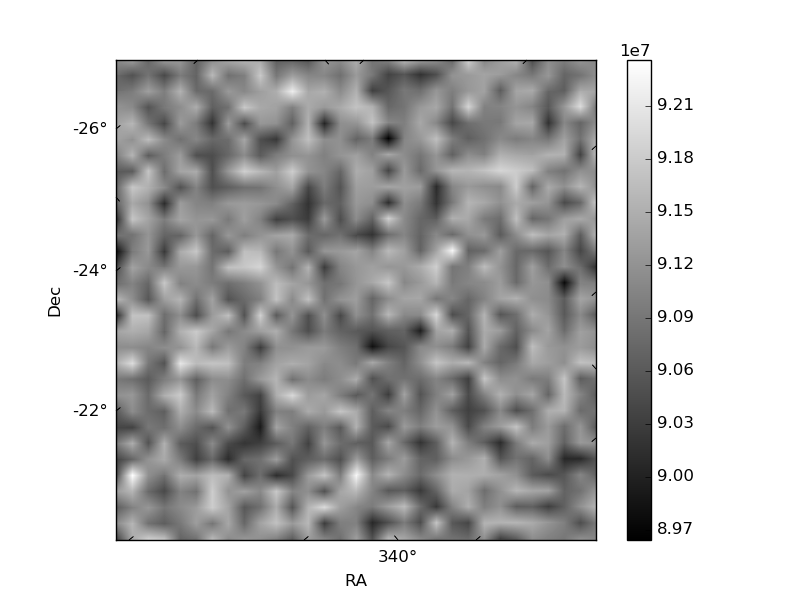
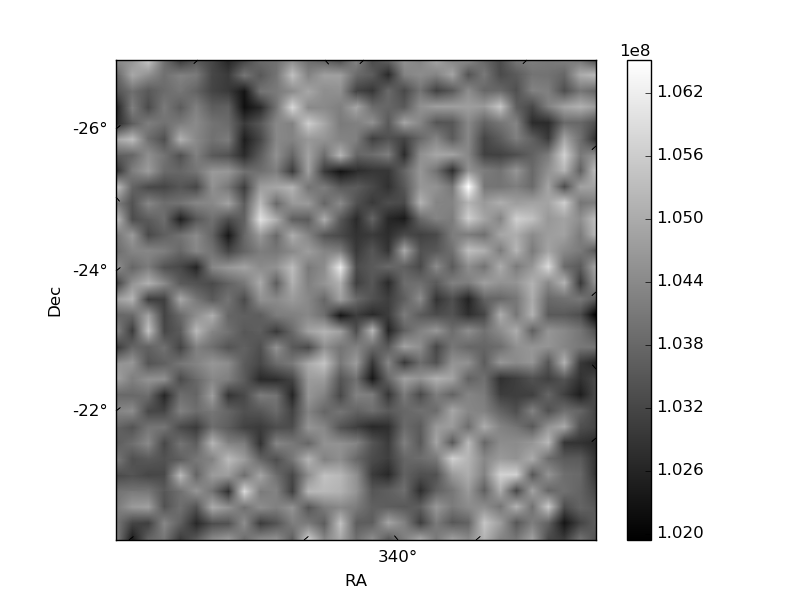
Histogram calculated using DETX and DETY for each event in the final _common_clean file
| Quadrant A | 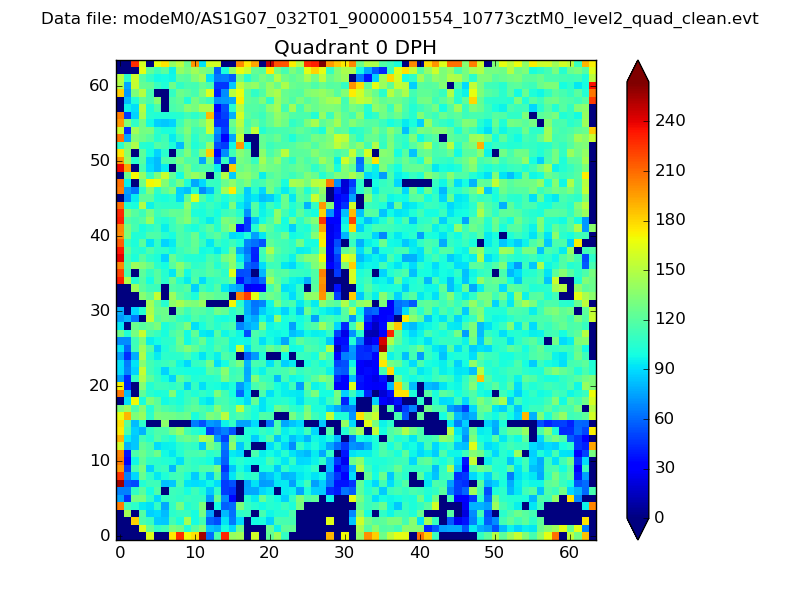 |
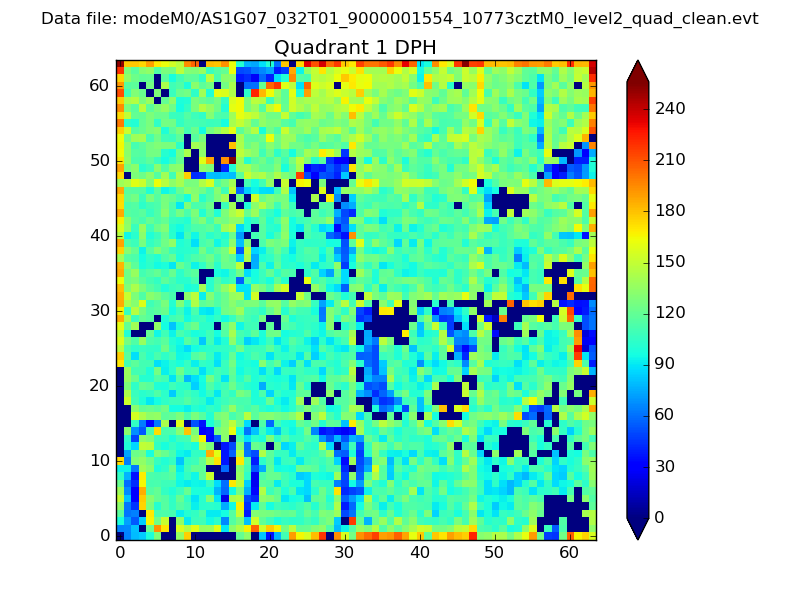 |
Quadrant B |
|---|---|---|---|
| Quadrant D | 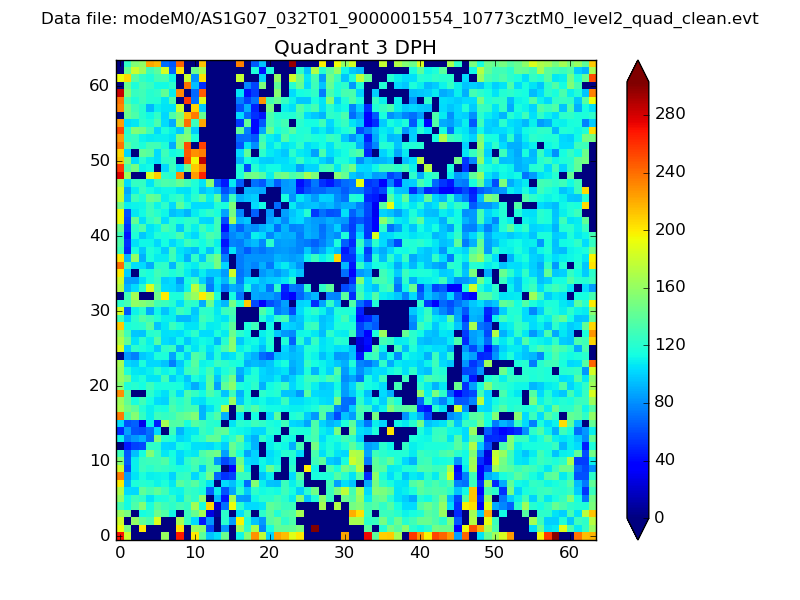 |
 |
Quadrant C |
| Plot type | Count rate plots | Images |
|---|---|---|
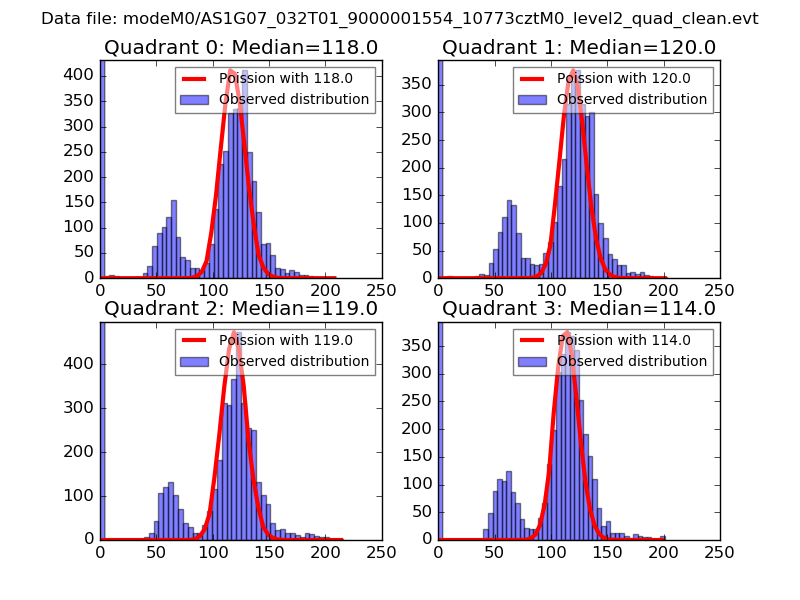
| Comparison with Poisson distribution Blue bars denote a histogram of data divided into 1 sec bins. Red curve is a Poisson curve with rate = median count rate of data. |
 |
 |
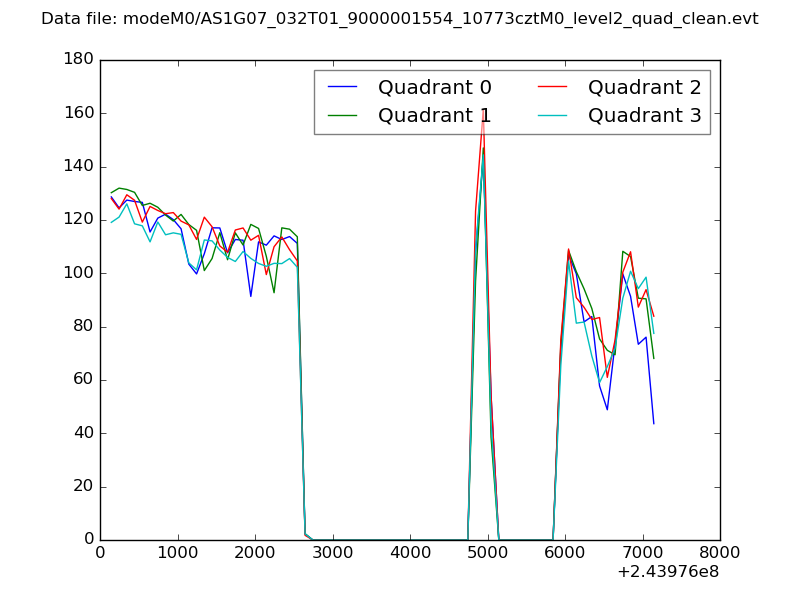
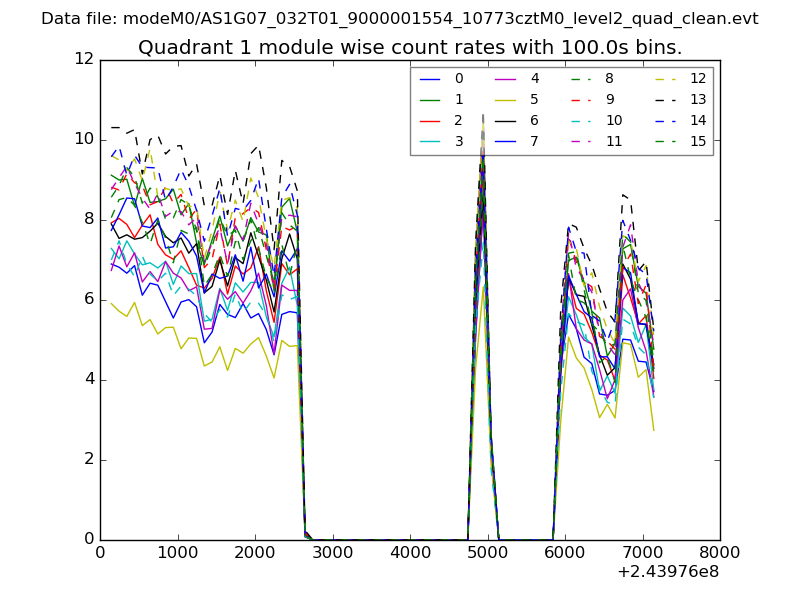
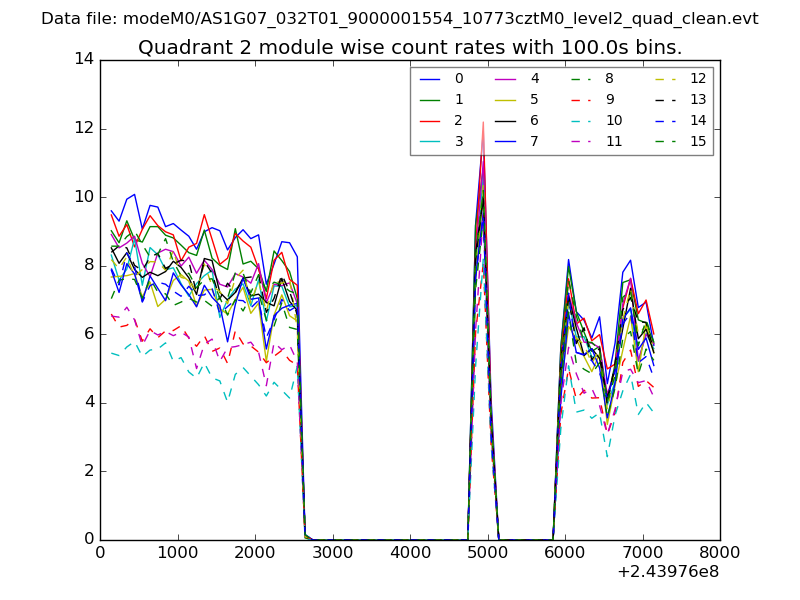
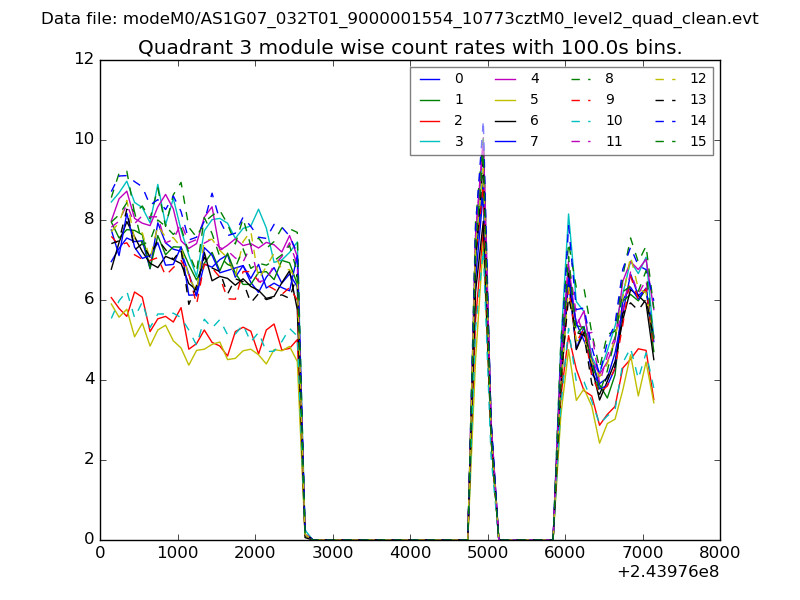
| Quadrant-wise count rates Data is divided into 100 sec bins |
 |
|
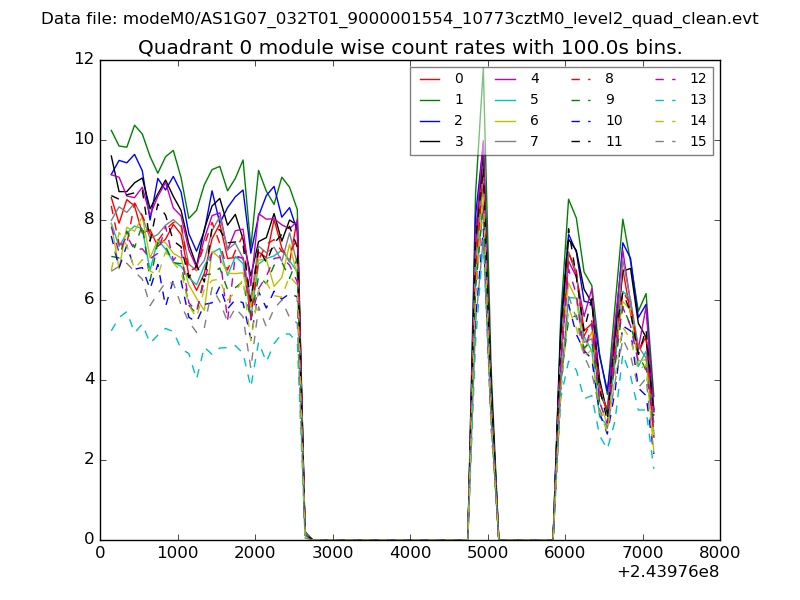
| Module-wise count rates for Quadrant A Data is divided into 100 sec bins |
 |
 |
| Module-wise count rates for Quadrant B Data is divided into 100 sec bins |
 |
 |
| Module-wise count rates for Quadrant C Data is divided into 100 sec bins |
 |
 |
| Module-wise count rates for Quadrant D Data is divided into 100 sec bins |
 |
 |
| Parameter | Plot |
|---|---|
| CZT HV Monitor | 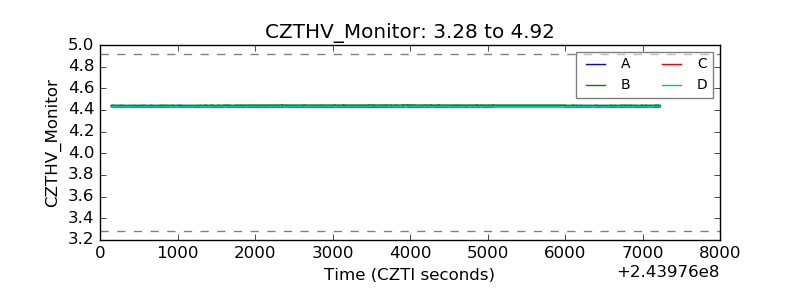 |
| D_VDD | 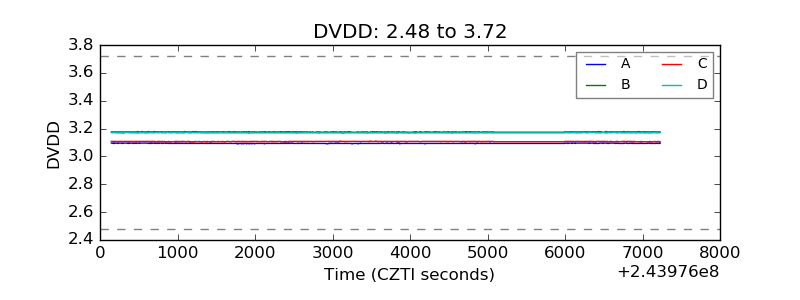 |
| Temperature 1 | 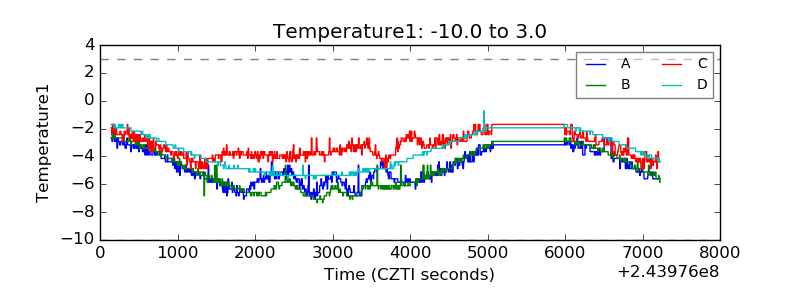 |
| Veto HV Monitor | 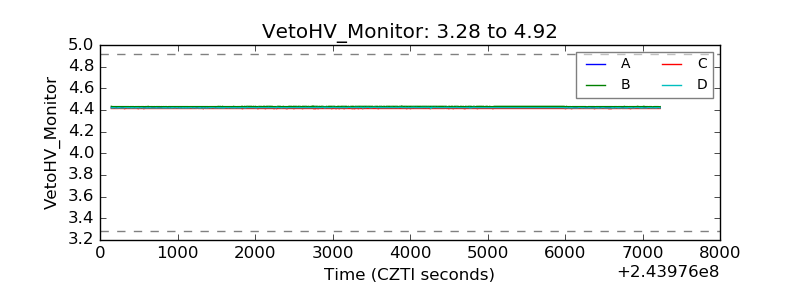 |
| Veto LLD | 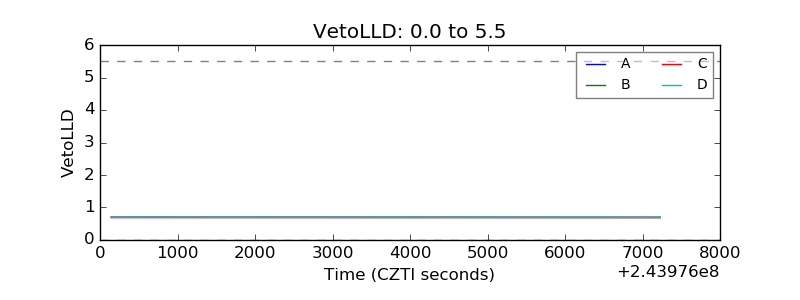 |
| Alpha Counter | 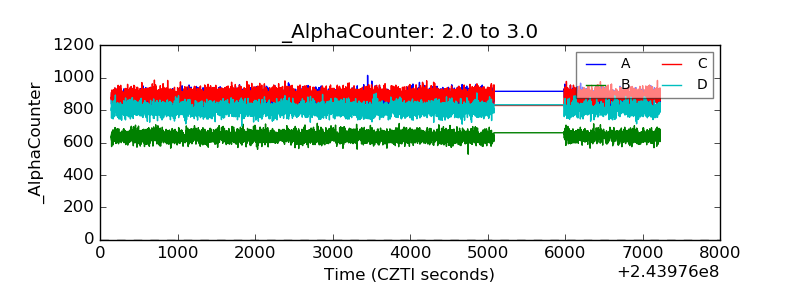 |
| _CPM_Rate | 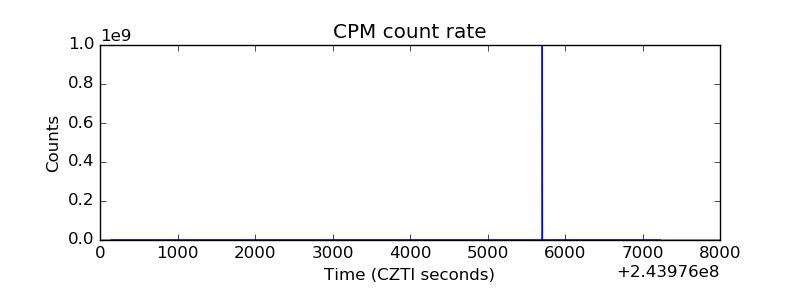 |
| CZT Counter | 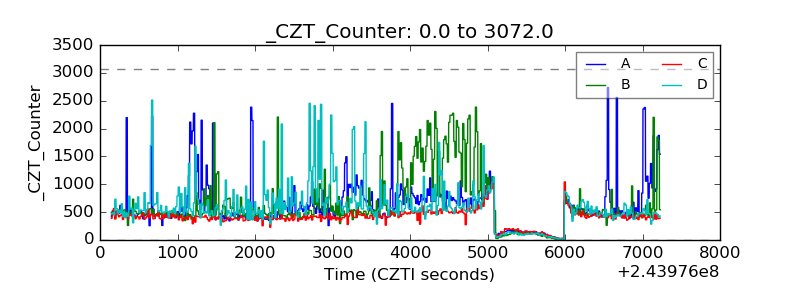 |
| +2.5 Volts monitor |  |
| +5 Volts monitor | 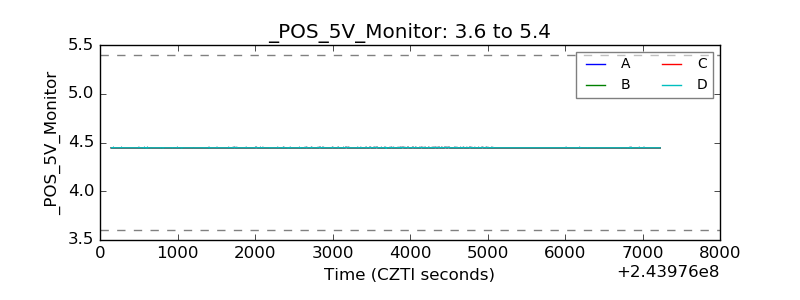 |
| _ROLL_ROT | 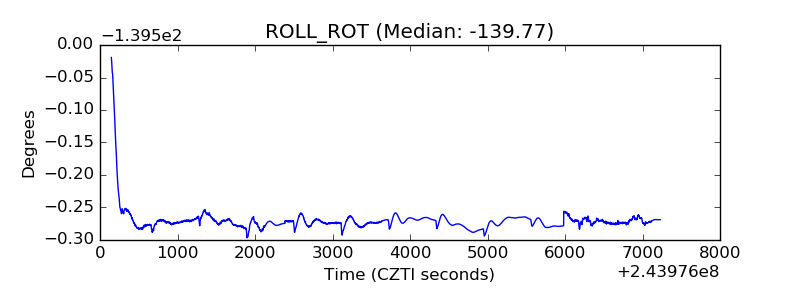 |
| _Roll_DEC | 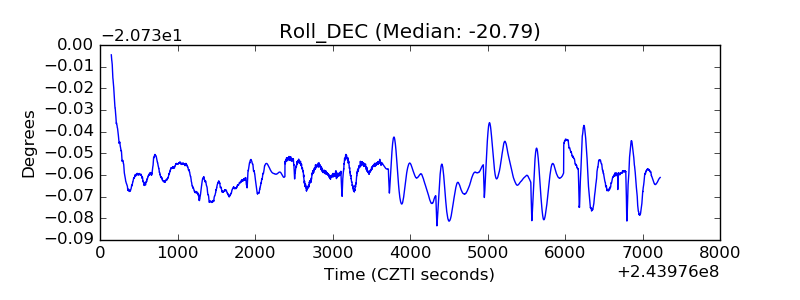 |
| _Roll_RA | 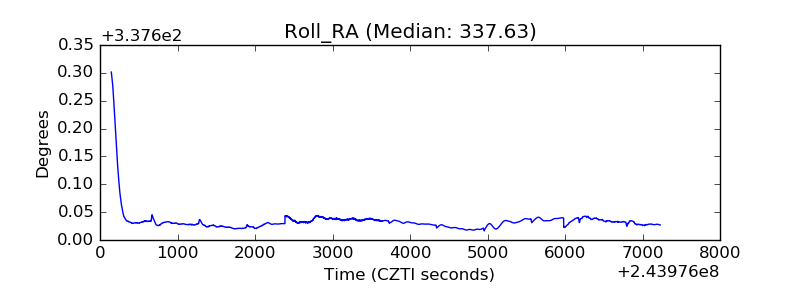 |
| Veto Counter | 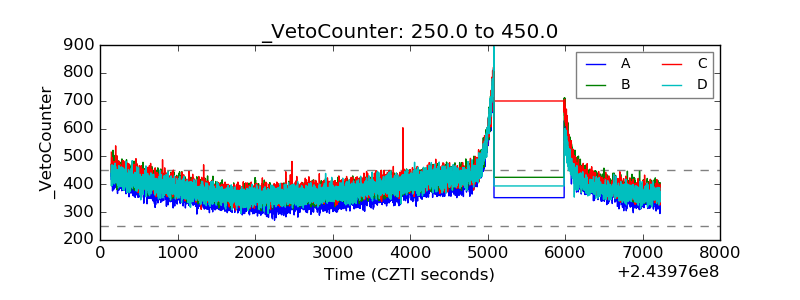 |