| Param | Original file | Final file |
|---|---|---|
| Filename | modeM0/AS1G07_057T03_9000001552cztM0_level2.fits | modeM0/AS1G07_057T03_9000001552cztM0_level2_quad_clean.evt |
| Size (bytes) | 225,688,320 | 238,893,120 |
| Size | 215.2 MB | 227.8 MB |
| Events in quadrant A | 1,382,560 | 1,479,433 |
| Events in quadrant B | 1,280,628 | 1,357,243 |
| Events in quadrant C | 1,404,242 | 1,484,707 |
| Events in quadrant D | 1,179,796 | 1,326,433 |
| Mode M9 | |||
|---|---|---|---|
| Quadrant | BADHDUFLAG | Total packets | Discarded packets |
| A | 0 | 61 | 0 |
| B | 0 | 61 | 0 |
| C | 0 | 61 | 0 |
| D | 0 | 61 | 0 |
| Mode SS | |||
|---|---|---|---|
| Quadrant | BADHDUFLAG | Total packets | Discarded packets |
| A | 0 | 470 | 0 |
| B | 0 | 470 | 0 |
| C | 0 | 470 | 0 |
| D | 0 | 470 | 0 |
| Mode M0 | |||
|---|---|---|---|
| Quadrant | BADHDUFLAG | Total packets | Discarded packets |
| A | 0 | 51546 | 0 |
| B | 0 | 73273 | 0 |
| C | 0 | 47306 | 0 |
| D | 0 | 67812 | 0 |
| Quadrant | Total seconds | Saturated seconds | Saturation percentage |
|---|---|---|---|
| A | 23058 | 492 | 2.133750% |
| B | 23058 | 2594 | 11.249892% |
| C | 23058 | 194 | 0.841357% |
| D | 23058 | 1088 | 4.718536% |
Noise dominated data is calculated using 1-second bins in cleaned event files. If a bin has >2000 counts, and if more than 50% of those come from <1% of pixels, then it is considered to be noise-dominated and hence unusable.
| Quadrant | # 1 sec bins | Bins with >0 counts | Bins with >2000 counts | High rate bins dominated by noise | Noise dominated (total time) | Noise dominated (detector-on time) | Marked lightcurve |
|---|---|---|---|---|---|---|---|
| A | 29123 | 23056 | 0 | 0 | 0.00% | 0.00% | 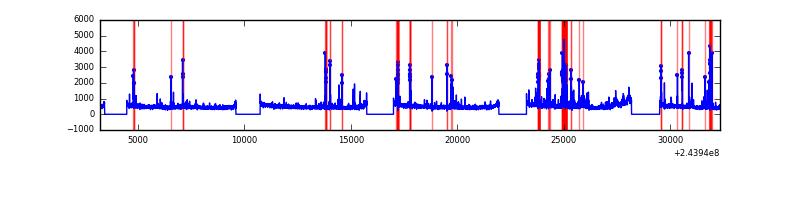 |
| B | 29123 | 23050 | 0 | 0 | 0.00% | 0.00% |  |
| C | 29123 | 23058 | 0 | 0 | 0.00% | 0.00% |  |
| D | 29123 | 23049 | 0 | 0 | 0.00% | 0.00% |  |
Top three noisy pixels from each quadrant. If the there are fewer than three noisy pixels in the level2.evt file, extra rows are filled as -1
| Pixel properties | Quadrant properties | ||||||
|---|---|---|---|---|---|---|---|
| Quadrant | DetID | PixID | Counts | Sigma | Mean | Median | Sigma |
| A | 0 | 29 | 1314 | 10.78 | 360 | 341 | 90.2 |
| A | 7 | 110 | 1137 | 8.82 | 360 | 341 | 90.2 |
| A | 0 | 30 | 1057 | 7.93 | 360 | 341 | 90.2 |
| B | 2 | 9 | 1095 | 11.23 | 339 | 325 | 68.6 |
| B | 3 | 80 | 857 | 7.76 | 339 | 325 | 68.6 |
| B | 3 | 17 | 842 | 7.54 | 339 | 325 | 68.6 |
| C | 1 | 81 | 1019 | 6.87 | 370 | 348 | 97.7 |
| C | 1 | 80 | 987 | 6.54 | 370 | 348 | 97.7 |
| C | 12 | 241 | 957 | 6.23 | 370 | 348 | 97.7 |
| D | 6 | 231 | 861 | 6.16 | 336 | 308 | 89.7 |
| D | 7 | 3 | 853 | 6.07 | 336 | 308 | 89.7 |
| D | 10 | 189 | 841 | 5.94 | 336 | 308 | 89.7 |
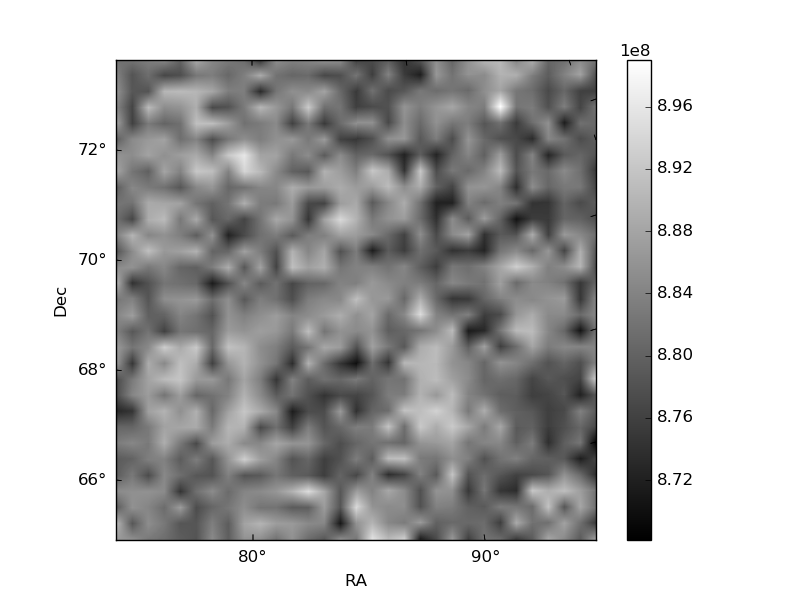
Histogram calculated using DETX and DETY for each event in the final _common_clean file
| Quadrant A | 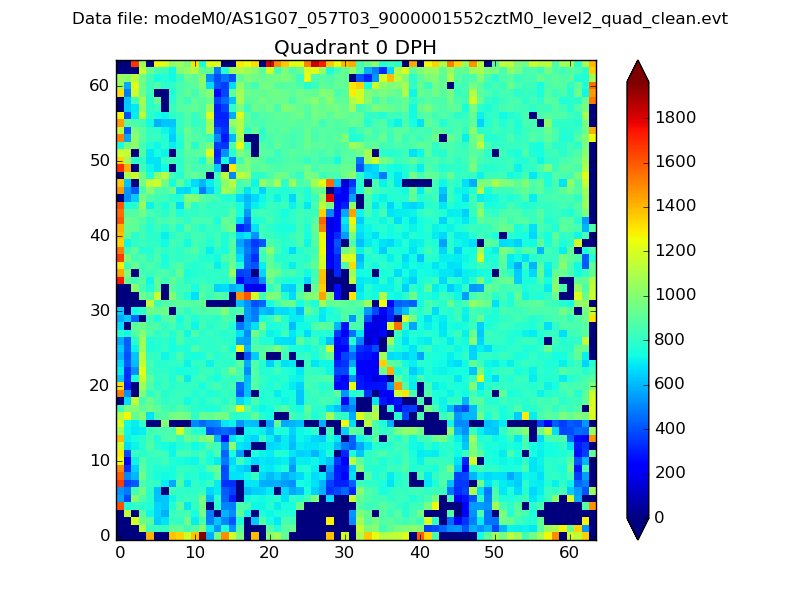 |
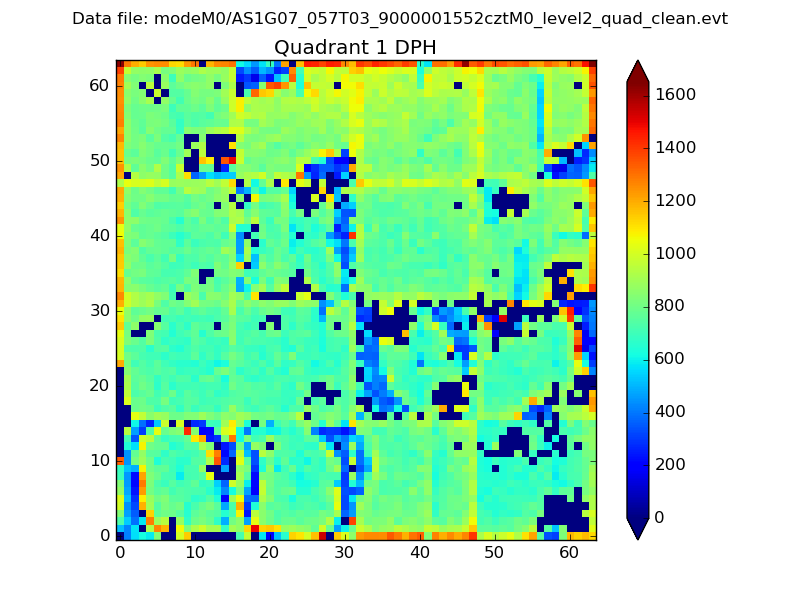 |
Quadrant B |
|---|---|---|---|
| Quadrant D |  |
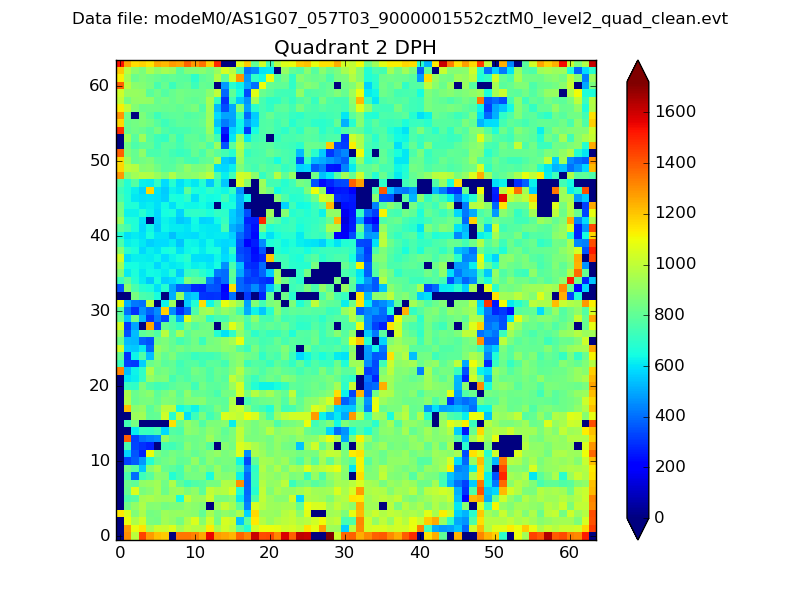 |
Quadrant C |
| Plot type | Count rate plots | Images |
|---|---|---|
| Comparison with Poisson distribution Blue bars denote a histogram of data divided into 1 sec bins. Red curve is a Poisson curve with rate = median count rate of data. |
 |
 |
| Quadrant-wise count rates Data is divided into 100 sec bins |
 |
|
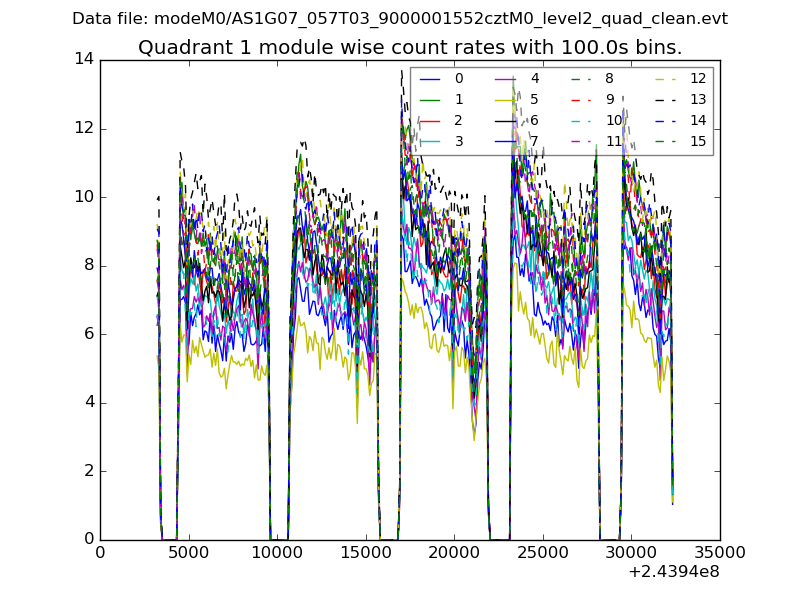
| Module-wise count rates for Quadrant A Data is divided into 100 sec bins |
 |
 |
| Module-wise count rates for Quadrant B Data is divided into 100 sec bins |
 |
 |
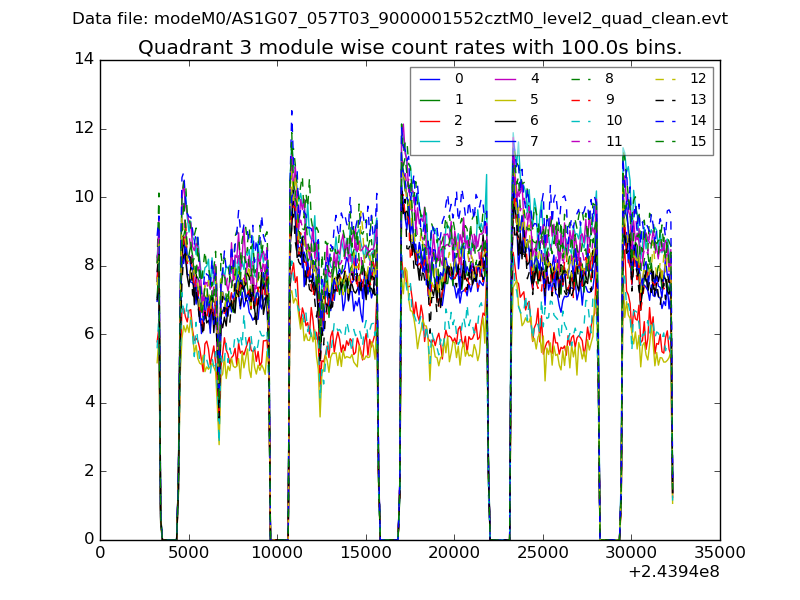
| Module-wise count rates for Quadrant C Data is divided into 100 sec bins |
 |
 |
| Module-wise count rates for Quadrant D Data is divided into 100 sec bins |
 |
 |
| Parameter | Plot |
|---|---|
| CZT HV Monitor |  |
| D_VDD | 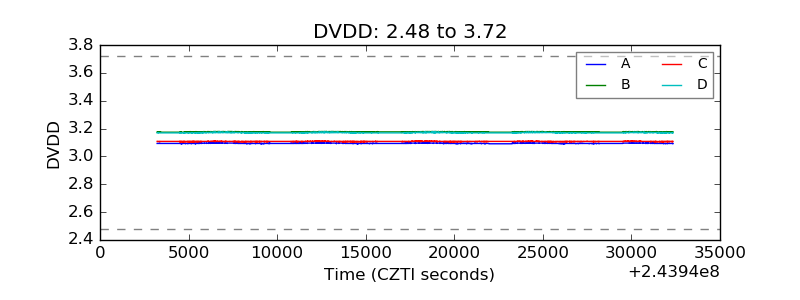 |
| Temperature 1 | 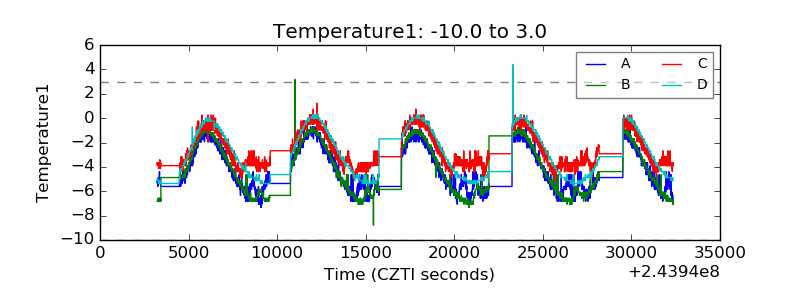 |
| Veto HV Monitor |  |
| Veto LLD |  |
| Alpha Counter | 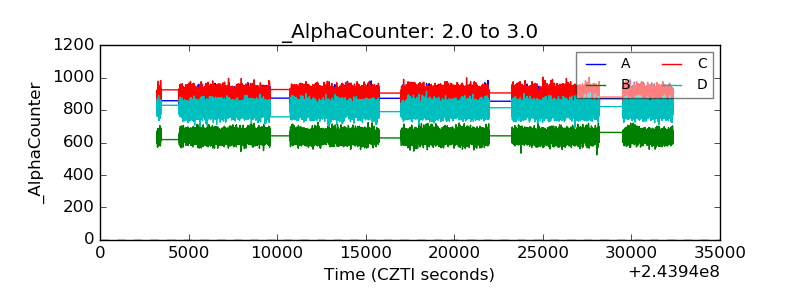 |
| _CPM_Rate |  |
| CZT Counter |  |
| +2.5 Volts monitor |  |
| +5 Volts monitor |  |
| _ROLL_ROT |  |
| _Roll_DEC |  |
| _Roll_RA |  |
| Veto Counter |  |