| Param | Original file | Final file |
|---|---|---|
| Filename | modeM0/AS1G07_057T03_9000001552_10764cztM0_level2.evt | modeM0/AS1G07_057T03_9000001552_10764cztM0_level2_quad_clean.evt |
| Size (bytes) | 159,491,520 | 31,576,320 |
| Size | 152.1 MB | 30.1 MB |
| Events in quadrant A | 846,376 | 215,579 |
| Events in quadrant B | 1,556,612 | 208,231 |
| Events in quadrant C | 767,754 | 219,763 |
| Events in quadrant D | 1,548,109 | 193,919 |
| Mode M9 | |||
|---|---|---|---|
| Quadrant | BADHDUFLAG | Total packets | Discarded packets |
| A | 0 | 10 | 0 |
| B | 0 | 10 | 0 |
| C | 0 | 10 | 0 |
| D | 0 | 10 | 0 |
| Mode SS | |||
|---|---|---|---|
| Quadrant | BADHDUFLAG | Total packets | Discarded packets |
| A | 0 | 34 | 0 |
| B | 0 | 34 | 0 |
| C | 0 | 34 | 0 |
| D | 0 | 34 | 0 |
| Mode M0 | |||
|---|---|---|---|
| Quadrant | BADHDUFLAG | Total packets | Discarded packets |
| A | 0 | 3469 | 2 |
| B | 0 | 5712 | 1 |
| C | 0 | 3290 | 1 |
| D | 0 | 5659 | 1 |
| Quadrant | Total seconds | Saturated seconds | Saturation percentage |
|---|---|---|---|
| A | 1602 | 47 | 2.933833% |
| B | 1602 | 214 | 13.358302% |
| C | 1602 | 14 | 0.873908% |
| D | 1602 | 187 | 11.672909% |
Noise dominated data is calculated using 1-second bins in cleaned event files. If a bin has >2000 counts, and if more than 50% of those come from <1% of pixels, then it is considered to be noise-dominated and hence unusable.
| Quadrant | # 1 sec bins | Bins with >0 counts | Bins with >2000 counts | High rate bins dominated by noise | Noise dominated (total time) | Noise dominated (detector-on time) | Marked lightcurve |
|---|---|---|---|---|---|---|---|
| A | 2647 | 1603 | 4 | 4 | 0.15% | 0.25% | 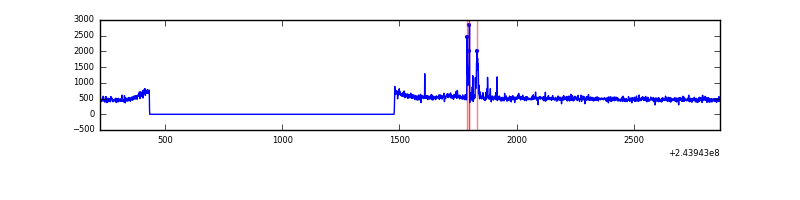 |
| B | 2647 | 1603 | 87 | 87 | 3.29% | 5.43% | 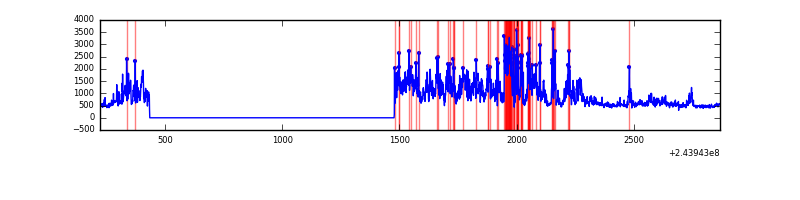 |
| C | 2647 | 1603 | 0 | 0 | 0.00% | 0.00% | 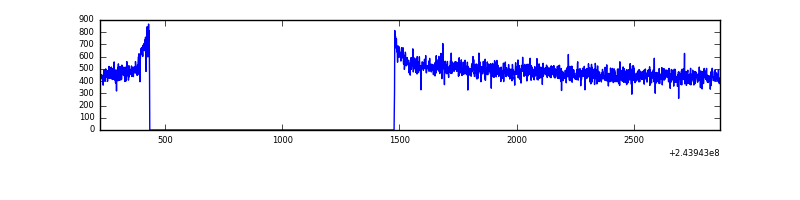 |
| D | 2647 | 1603 | 147 | 147 | 5.55% | 9.17% | 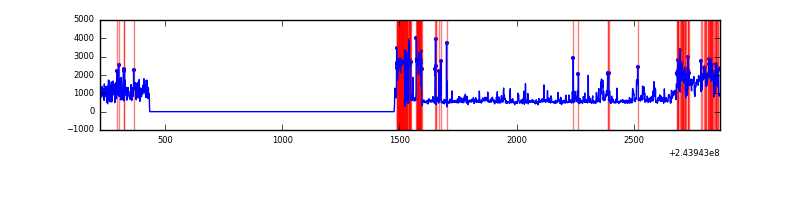 |
Top three noisy pixels from each quadrant. If the there are fewer than three noisy pixels in the level2.evt file, extra rows are filled as -1
| Pixel properties | Quadrant properties | ||||||
|---|---|---|---|---|---|---|---|
| Quadrant | DetID | PixID | Counts | Sigma | Mean | Median | Sigma |
| A | 15 | 223 | 24178 | 547.52 | 207 | 202 | 43.8 |
| A | 15 | 239 | 12993 | 292.1 | 207 | 202 | 43.8 |
| A | 1 | 162 | 6418 | 141.95 | 207 | 202 | 43.8 |
| B | 4 | 239 | 416462 | 10569.61 | 196 | 191 | 39.4 |
| B | 0 | 85 | 358550 | 9099.15 | 196 | 191 | 39.4 |
| B | 0 | 214 | 9309 | 231.52 | 196 | 191 | 39.4 |
| C | 13 | 61 | 1402 | 25.68 | 196 | 197 | 46.9 |
| C | 14 | 234 | 554 | 7.61 | 196 | 197 | 46.9 |
| C | 3 | 202 | 477 | 5.97 | 196 | 197 | 46.9 |
| D | 10 | 157 | 591289 | 12830.01 | 187 | 182 | 46.1 |
| D | 1 | 52 | 179802 | 3898.66 | 187 | 182 | 46.1 |
| D | 13 | 249 | 30364 | 655.1 | 187 | 182 | 46.1 |
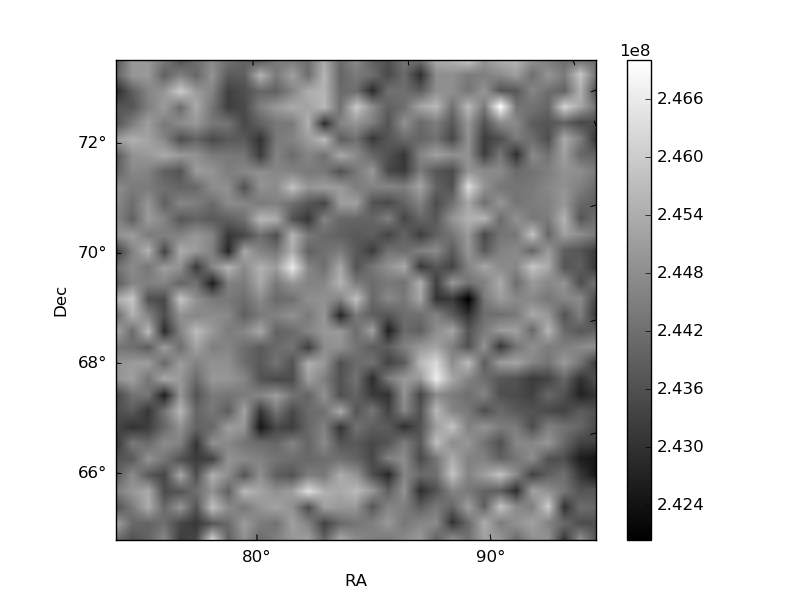
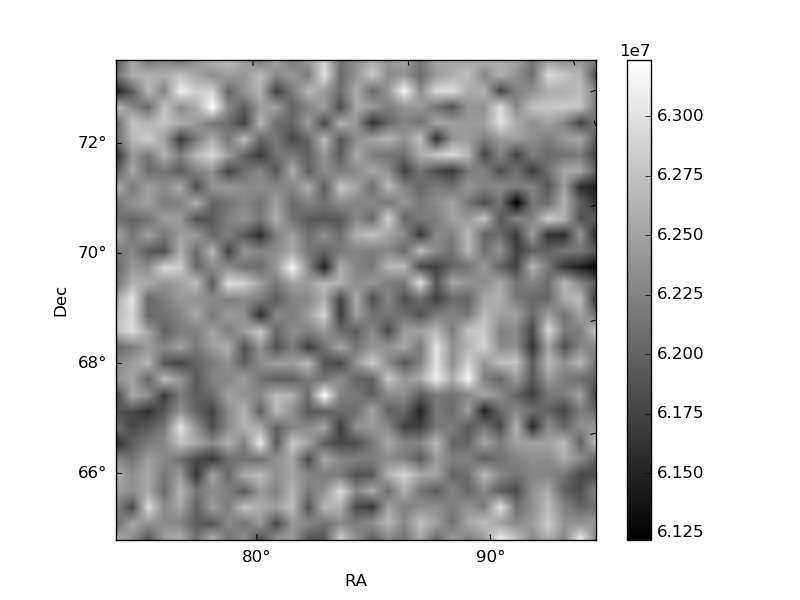
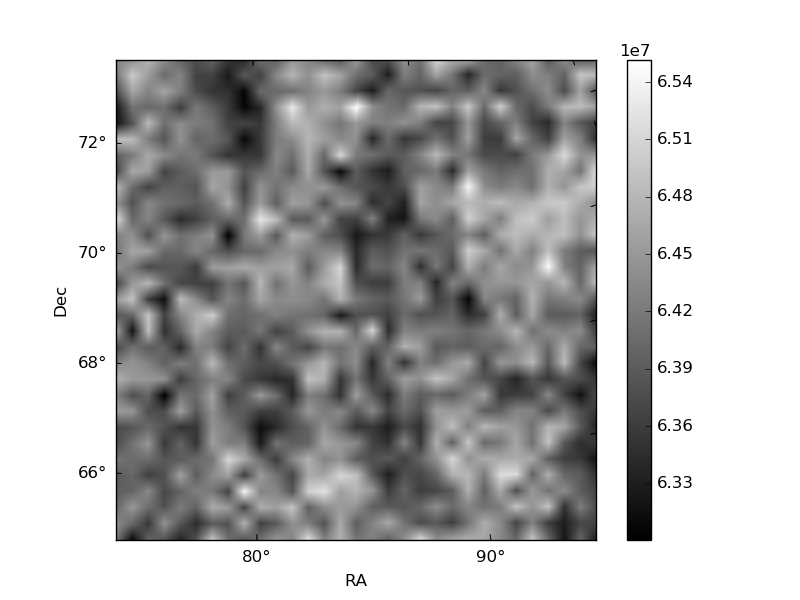
Histogram calculated using DETX and DETY for each event in the final _common_clean file
| Quadrant A | 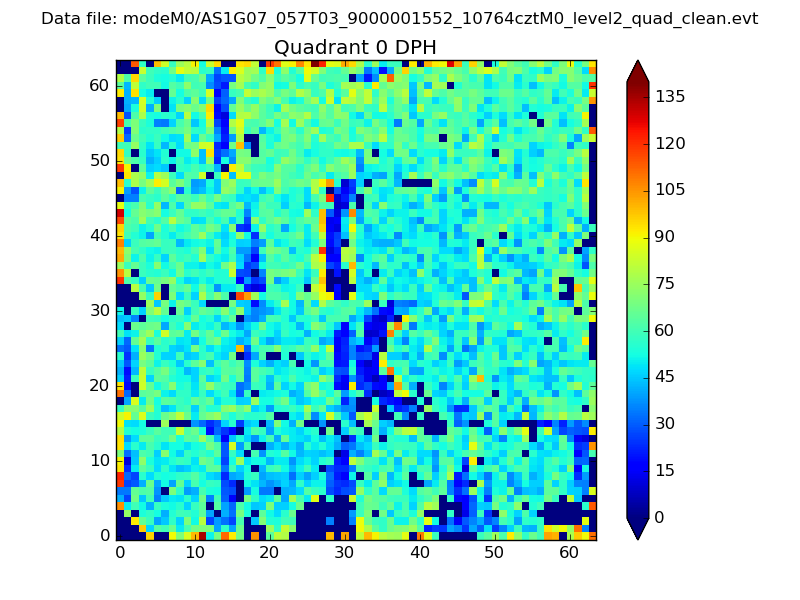 |
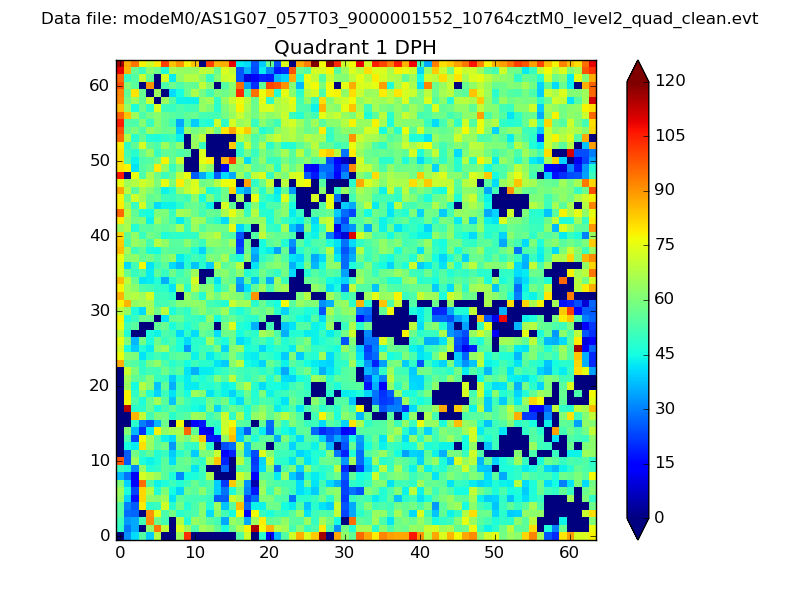 |
Quadrant B |
|---|---|---|---|
| Quadrant D | 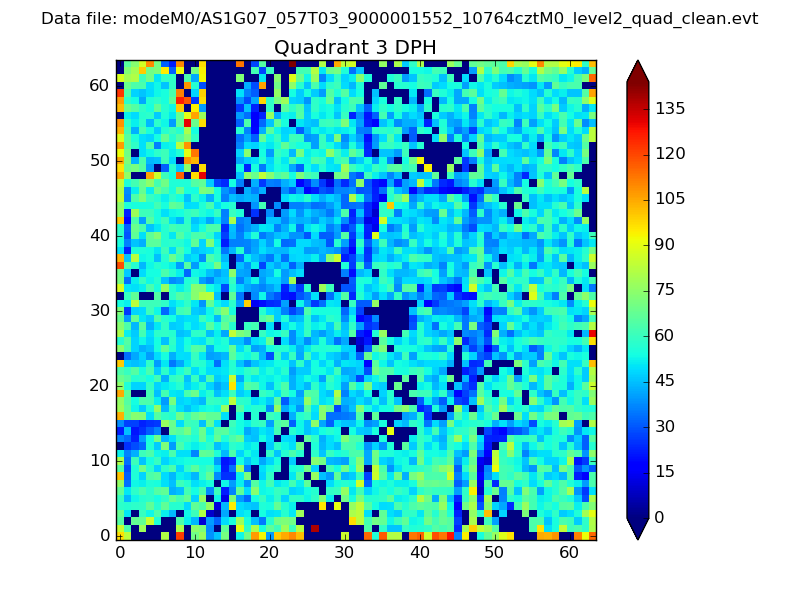 |
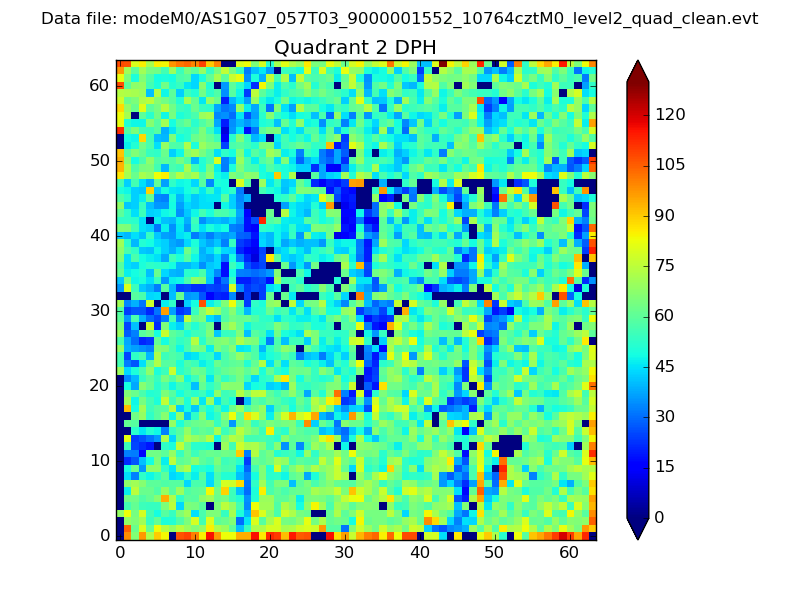 |
Quadrant C |
| Plot type | Count rate plots | Images |
|---|---|---|
| Comparison with Poisson distribution Blue bars denote a histogram of data divided into 1 sec bins. Red curve is a Poisson curve with rate = median count rate of data. |
 |
 |
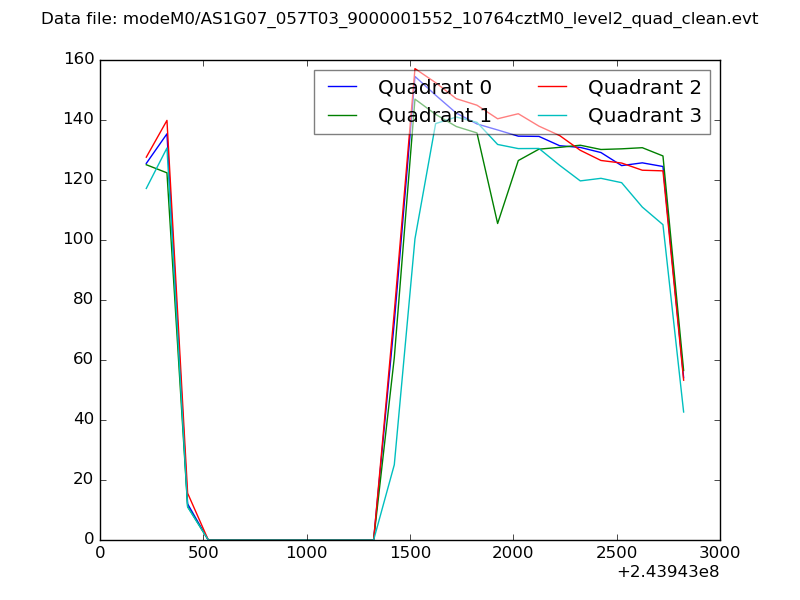
| Quadrant-wise count rates Data is divided into 100 sec bins |
 |
|
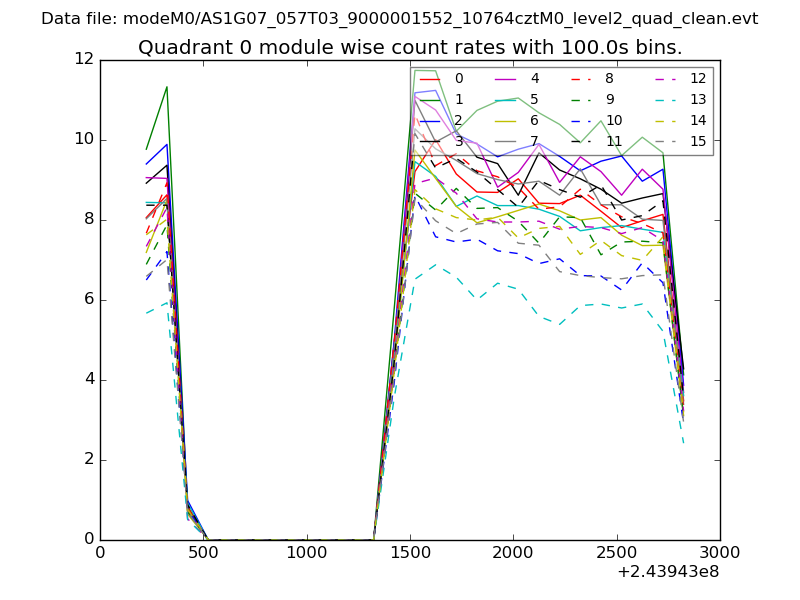
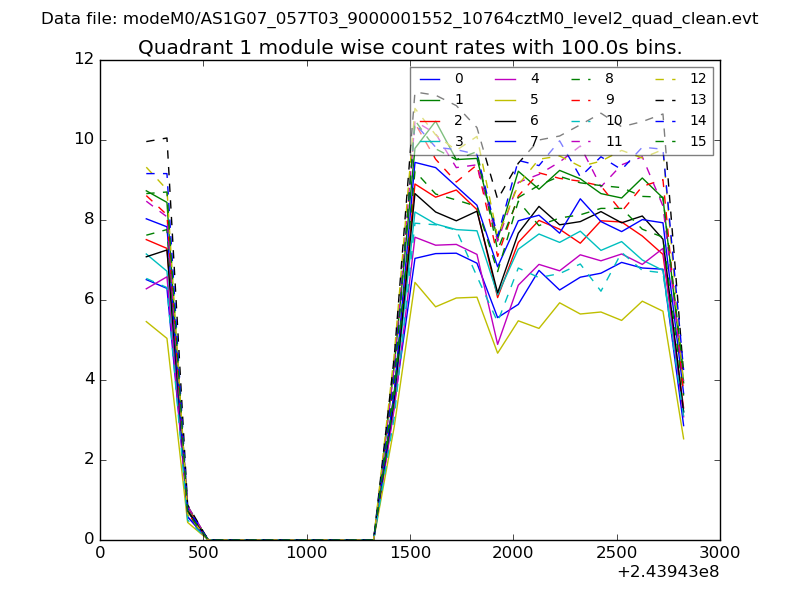
| Module-wise count rates for Quadrant A Data is divided into 100 sec bins |
 |
 |
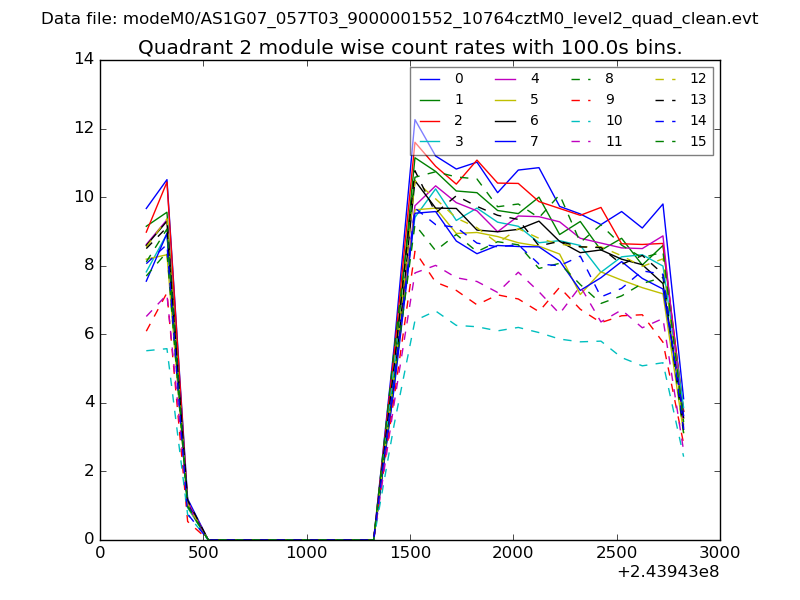
| Module-wise count rates for Quadrant B Data is divided into 100 sec bins |
 |
 |
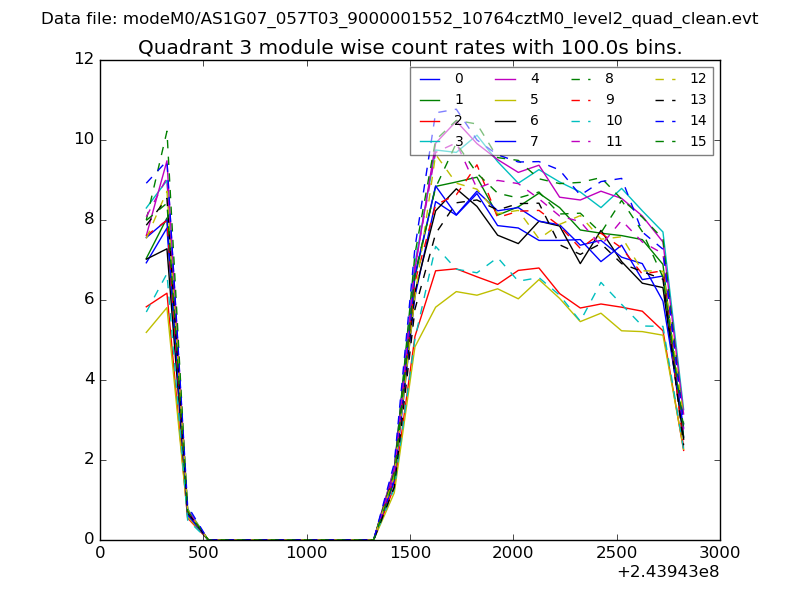
| Module-wise count rates for Quadrant C Data is divided into 100 sec bins |
 |
 |
| Module-wise count rates for Quadrant D Data is divided into 100 sec bins |
 |
 |
| Parameter | Plot |
|---|---|
| CZT HV Monitor | 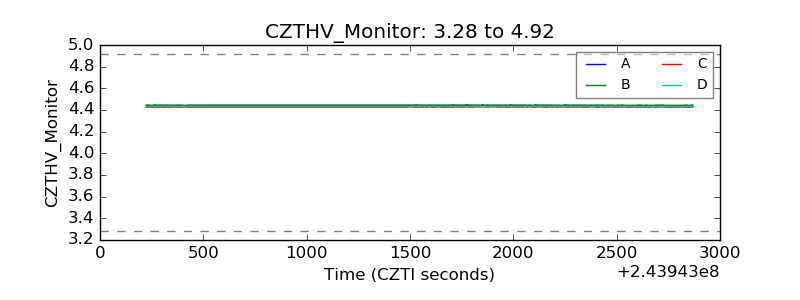 |
| D_VDD | 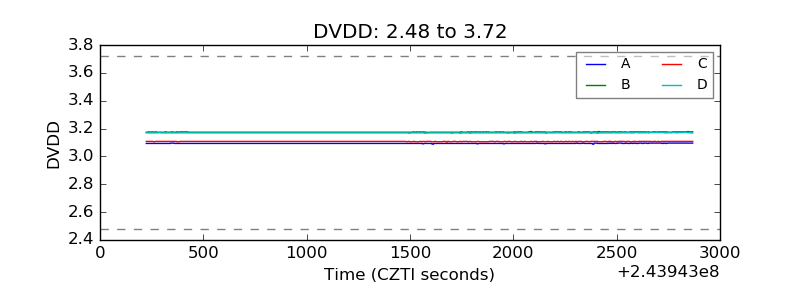 |
| Temperature 1 | 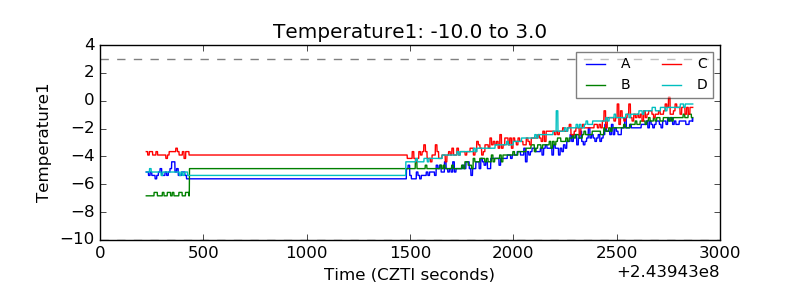 |
| Veto HV Monitor |  |
| Veto LLD | 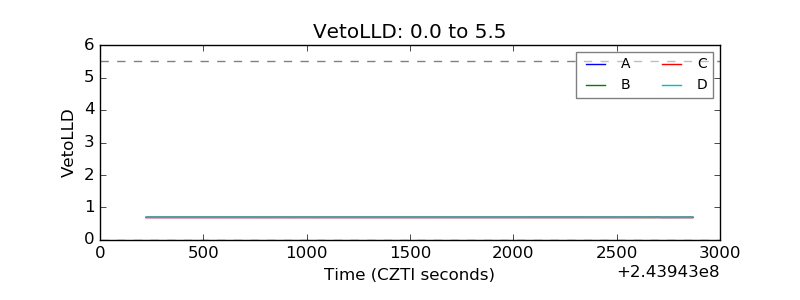 |
| Alpha Counter | 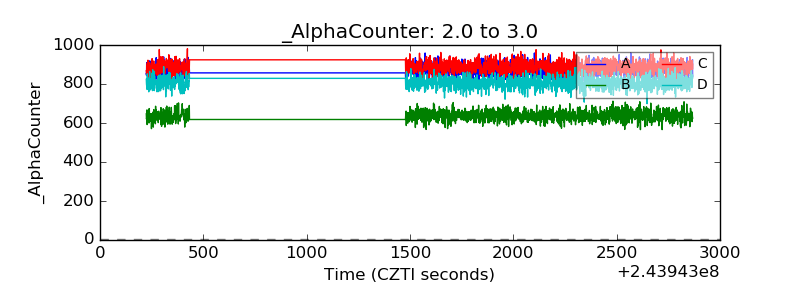 |
| _CPM_Rate | 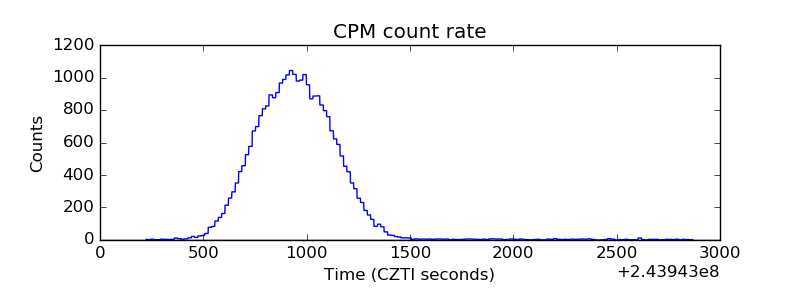 |
| CZT Counter | 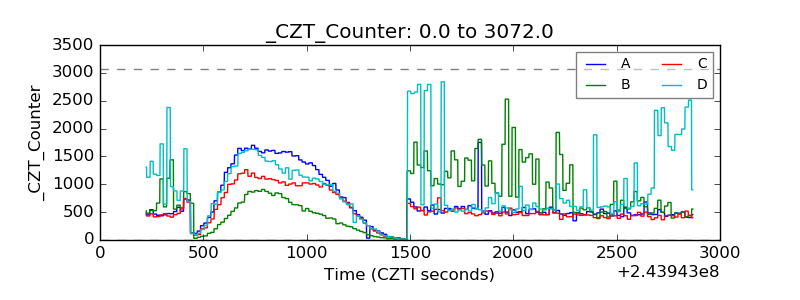 |
| +2.5 Volts monitor |  |
| +5 Volts monitor |  |
| _ROLL_ROT | 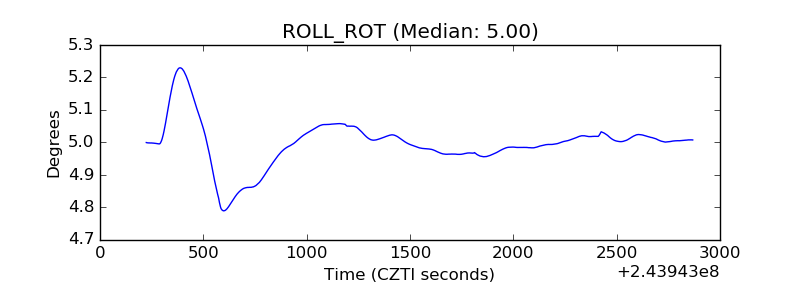 |
| _Roll_DEC | 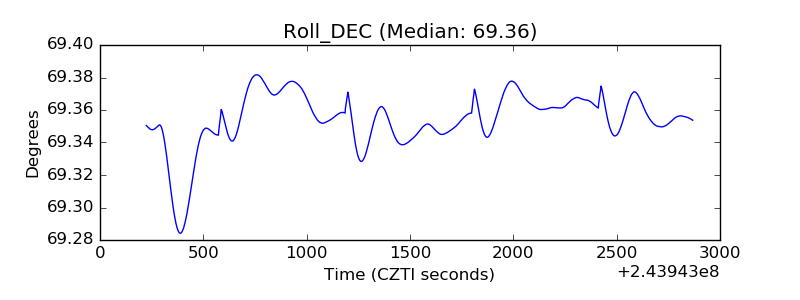 |
| _Roll_RA | 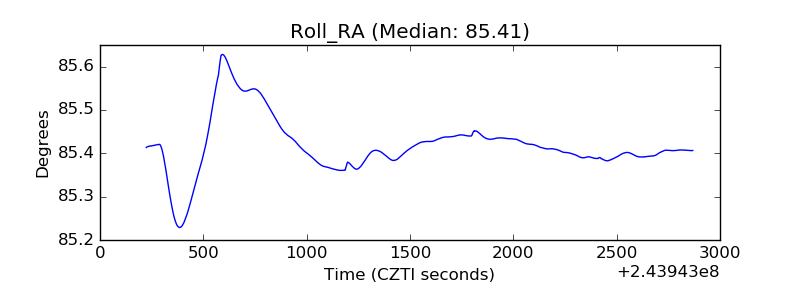 |
| Veto Counter | 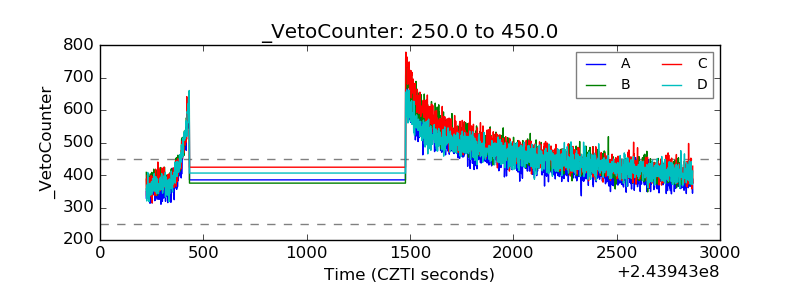 |