| Param | Original file | Final file |
|---|---|---|
| Filename | modeM0/AS1G07_057T03_9000001552_10766cztM0_level2.evt | modeM0/AS1G07_057T03_9000001552_10766cztM0_level2_quad_clean.evt |
| Size (bytes) | 597,553,920 | 125,585,280 |
| Size | 569.9 MB | 119.8 MB |
| Events in quadrant A | 3,232,222 | 858,467 |
| Events in quadrant B | 6,032,583 | 822,492 |
| Events in quadrant C | 3,006,328 | 862,832 |
| Events in quadrant D | 5,377,800 | 798,125 |
| Mode M9 | |||
|---|---|---|---|
| Quadrant | BADHDUFLAG | Total packets | Discarded packets |
| A | 0 | 11 | 0 |
| B | 0 | 11 | 0 |
| C | 0 | 11 | 0 |
| D | 0 | 11 | 0 |
| Mode SS | |||
|---|---|---|---|
| Quadrant | BADHDUFLAG | Total packets | Discarded packets |
| A | 0 | 136 | 0 |
| B | 0 | 136 | 0 |
| C | 0 | 136 | 0 |
| D | 0 | 136 | 0 |
| Mode M0 | |||
|---|---|---|---|
| Quadrant | BADHDUFLAG | Total packets | Discarded packets |
| A | 0 | 13907 | 2 |
| B | 0 | 22334 | 1 |
| C | 0 | 13418 | 1 |
| D | 0 | 20376 | 1 |
| Quadrant | Total seconds | Saturated seconds | Saturation percentage |
|---|---|---|---|
| A | 6611 | 70 | 1.058841% |
| B | 6611 | 783 | 11.843897% |
| C | 6611 | 42 | 0.635305% |
| D | 6611 | 406 | 6.141280% |
Noise dominated data is calculated using 1-second bins in cleaned event files. If a bin has >2000 counts, and if more than 50% of those come from <1% of pixels, then it is considered to be noise-dominated and hence unusable.
| Quadrant | # 1 sec bins | Bins with >0 counts | Bins with >2000 counts | High rate bins dominated by noise | Noise dominated (total time) | Noise dominated (detector-on time) | Marked lightcurve |
|---|---|---|---|---|---|---|---|
| A | 7751 | 6611 | 8 | 8 | 0.10% | 0.12% | 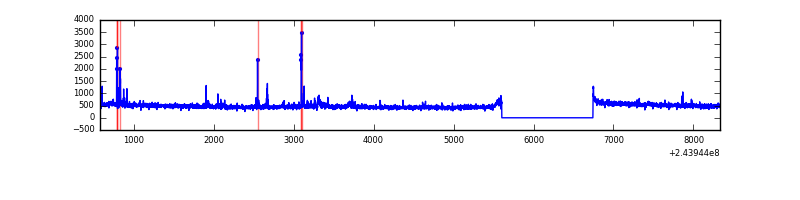 |
| B | 7751 | 6611 | 434 | 434 | 5.60% | 6.56% | 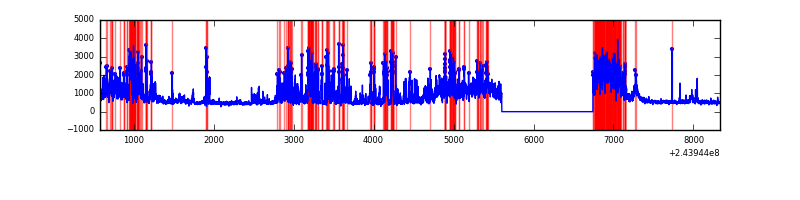 |
| C | 7751 | 6612 | 1 | 1 | 0.01% | 0.02% | 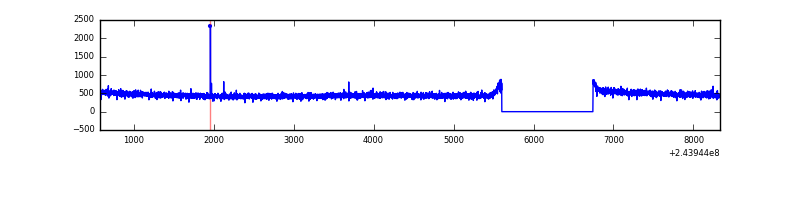 |
| D | 7751 | 6612 | 342 | 342 | 4.41% | 5.17% | 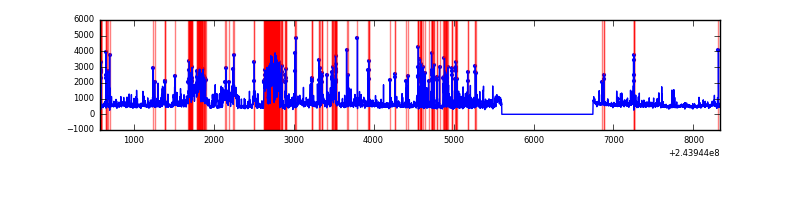 |
Top three noisy pixels from each quadrant. If the there are fewer than three noisy pixels in the level2.evt file, extra rows are filled as -1
| Pixel properties | Quadrant properties | ||||||
|---|---|---|---|---|---|---|---|
| Quadrant | DetID | PixID | Counts | Sigma | Mean | Median | Sigma |
| A | 13 | 251 | 45473 | 281.25 | 794 | 778 | 158.9 |
| A | 15 | 223 | 36180 | 222.77 | 794 | 778 | 158.9 |
| A | 15 | 174 | 32810 | 201.56 | 794 | 778 | 158.9 |
| B | 0 | 85 | 1473607 | 10377.82 | 760 | 743 | 141.9 |
| B | 4 | 239 | 1451974 | 10225.39 | 760 | 743 | 141.9 |
| B | 0 | 214 | 31970 | 220.03 | 760 | 743 | 141.9 |
| C | 13 | 61 | 5667 | 27.99 | 769 | 772 | 174.9 |
| C | 14 | 234 | 4725 | 22.6 | 769 | 772 | 174.9 |
| C | 8 | 222 | 2414 | 9.39 | 769 | 772 | 174.9 |
| D | 10 | 157 | 1134731 | 6240.3 | 756 | 735 | 181.7 |
| D | 10 | 199 | 478424 | 2628.69 | 756 | 735 | 181.7 |
| D | 1 | 52 | 467627 | 2569.27 | 756 | 735 | 181.7 |
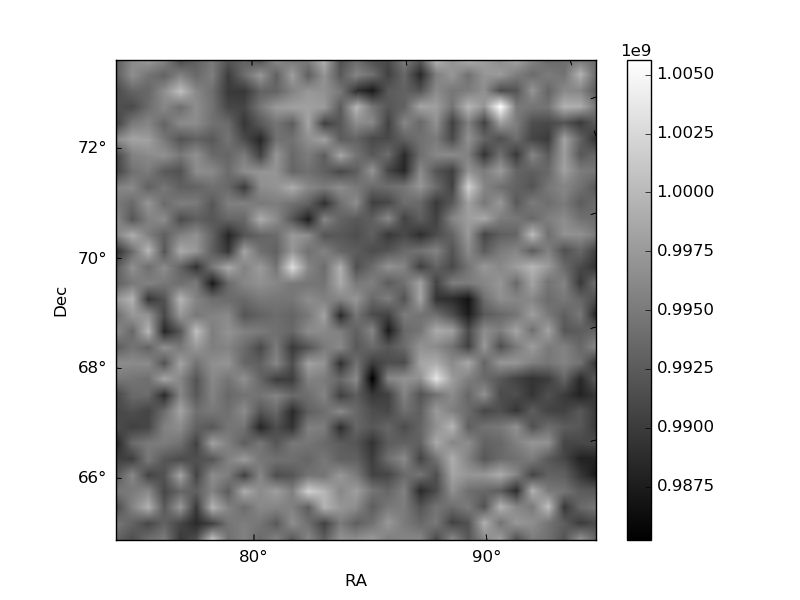
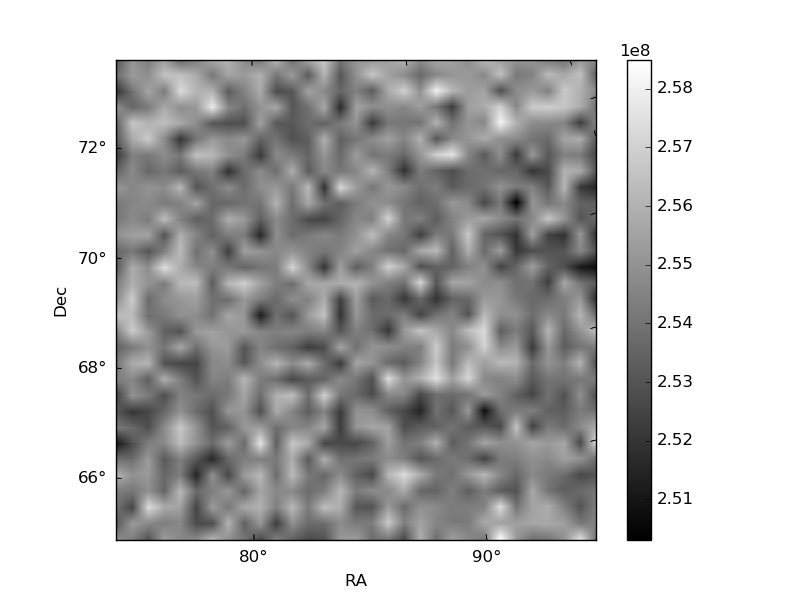
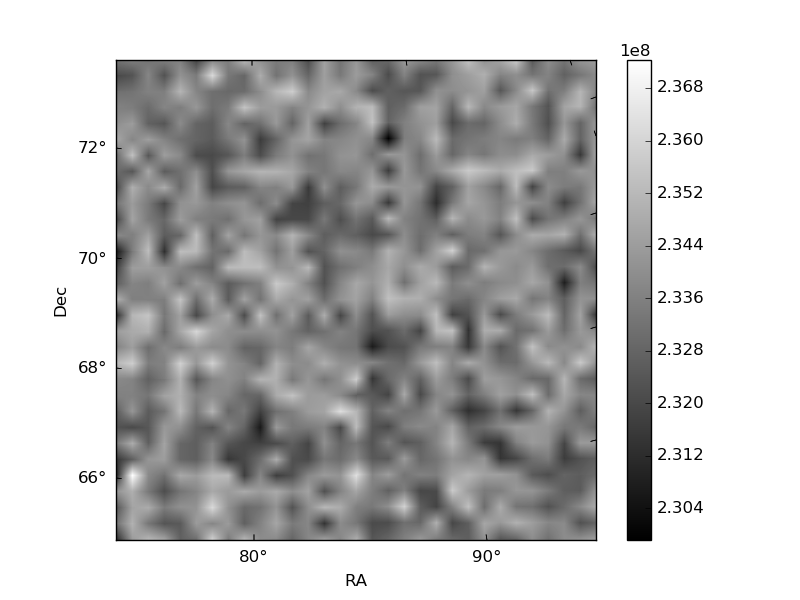
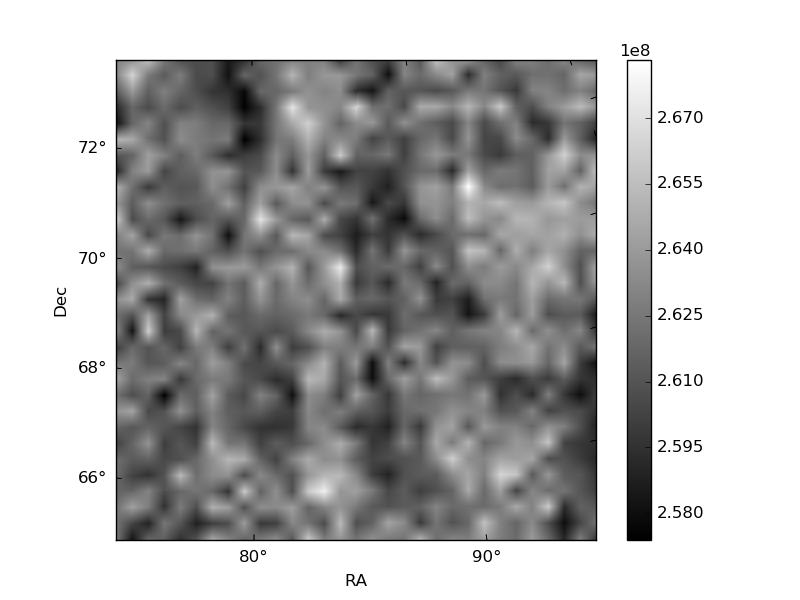
Histogram calculated using DETX and DETY for each event in the final _common_clean file
| Quadrant A | 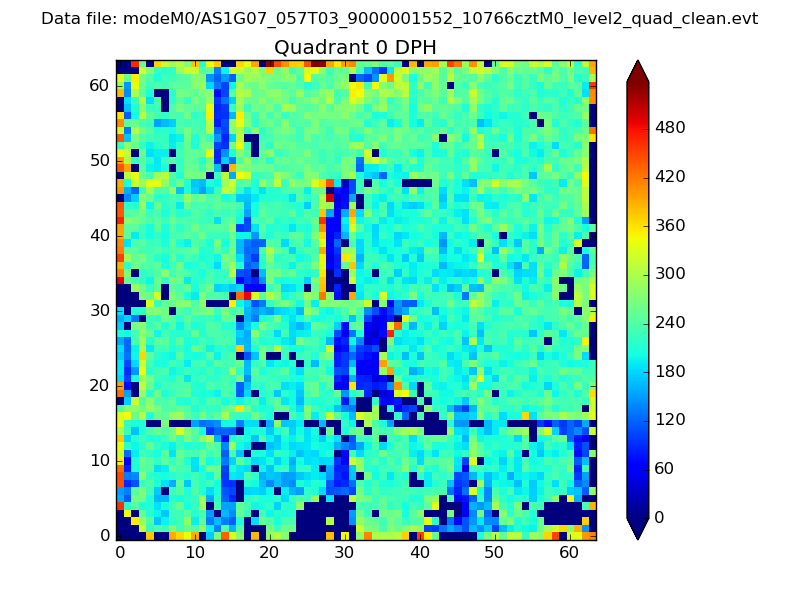 |
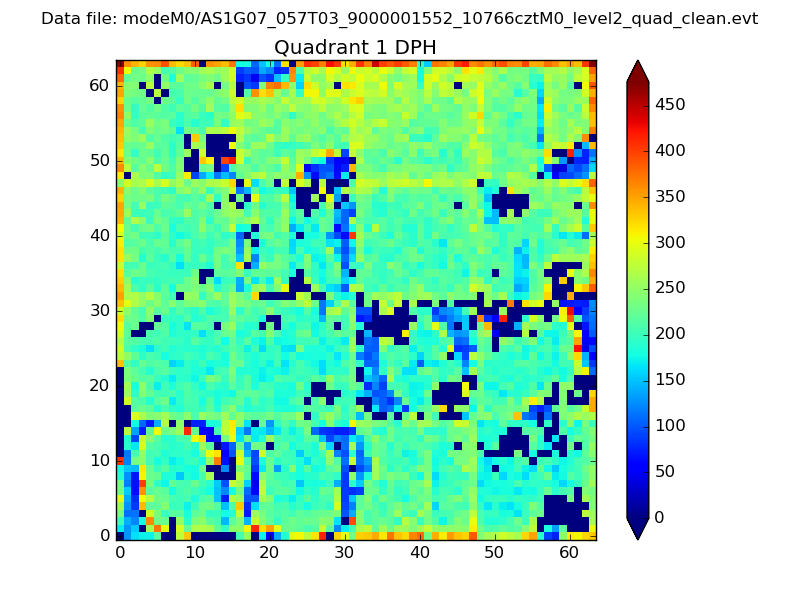 |
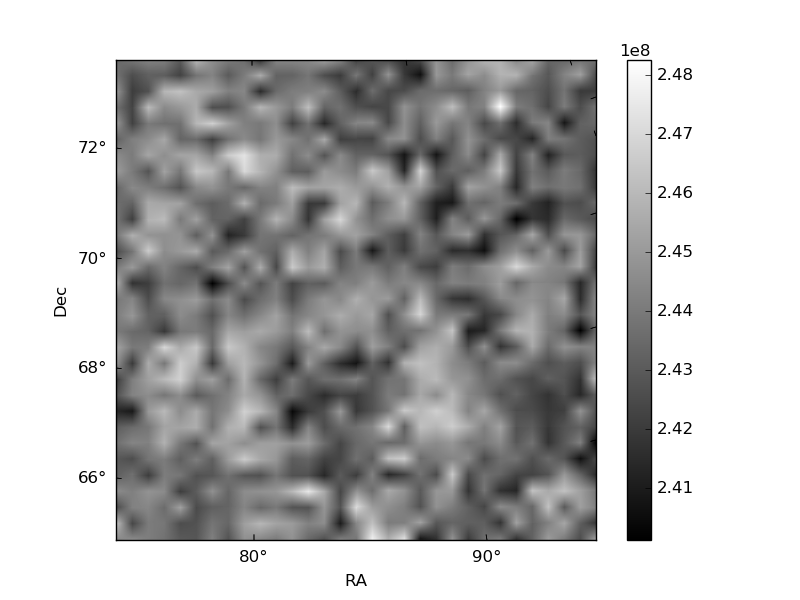
Quadrant B |
|---|---|---|---|
| Quadrant D | 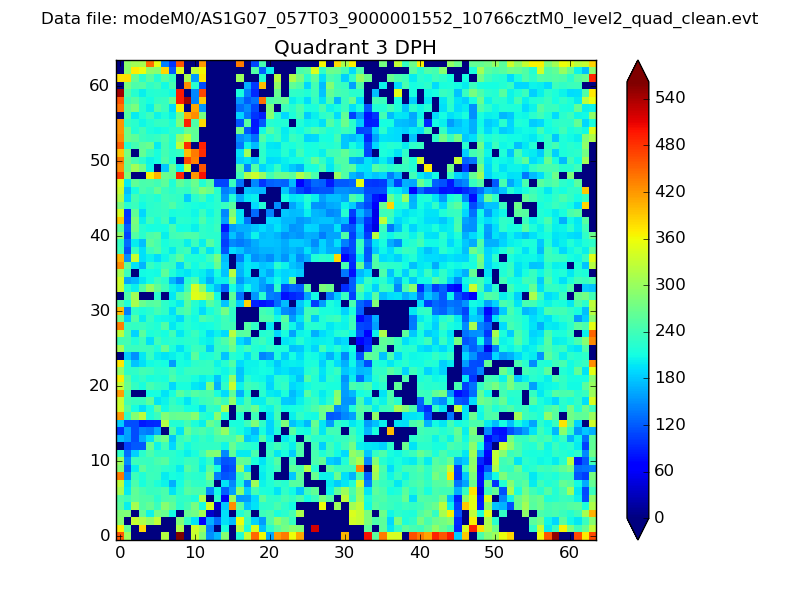 |
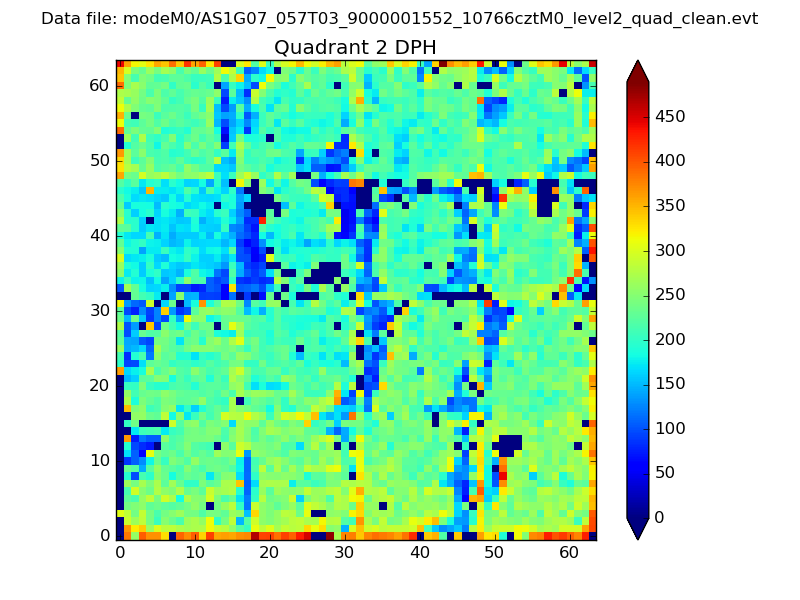 |
Quadrant C |
| Plot type | Count rate plots | Images |
|---|---|---|
| Comparison with Poisson distribution Blue bars denote a histogram of data divided into 1 sec bins. Red curve is a Poisson curve with rate = median count rate of data. |
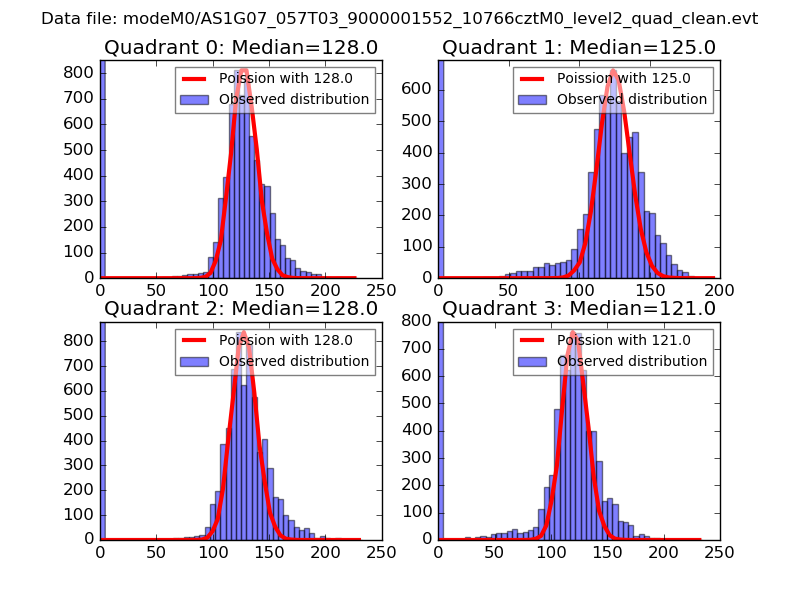 |
 |
| Quadrant-wise count rates Data is divided into 100 sec bins |
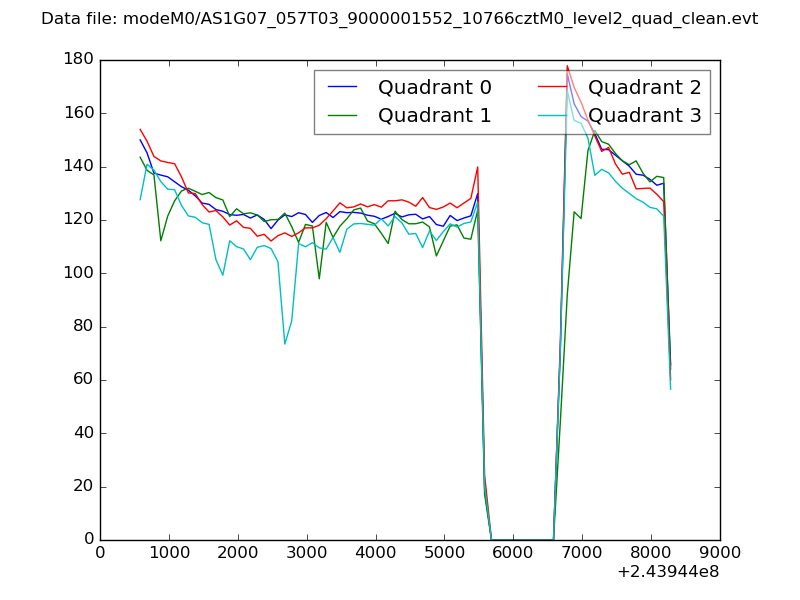 |
|
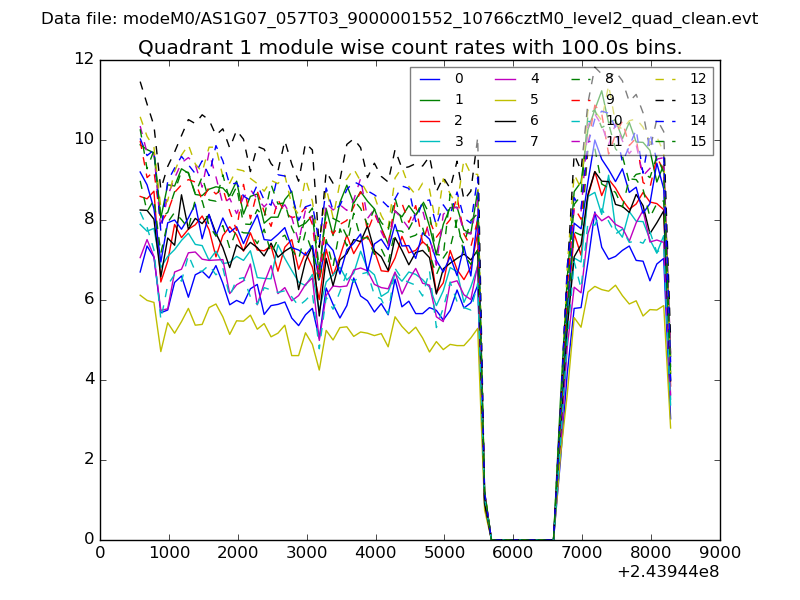
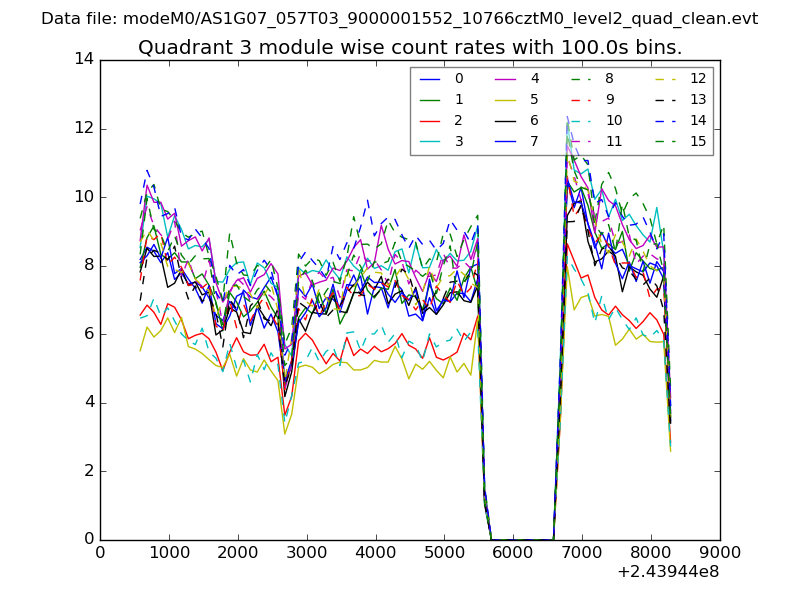
| Module-wise count rates for Quadrant A Data is divided into 100 sec bins |
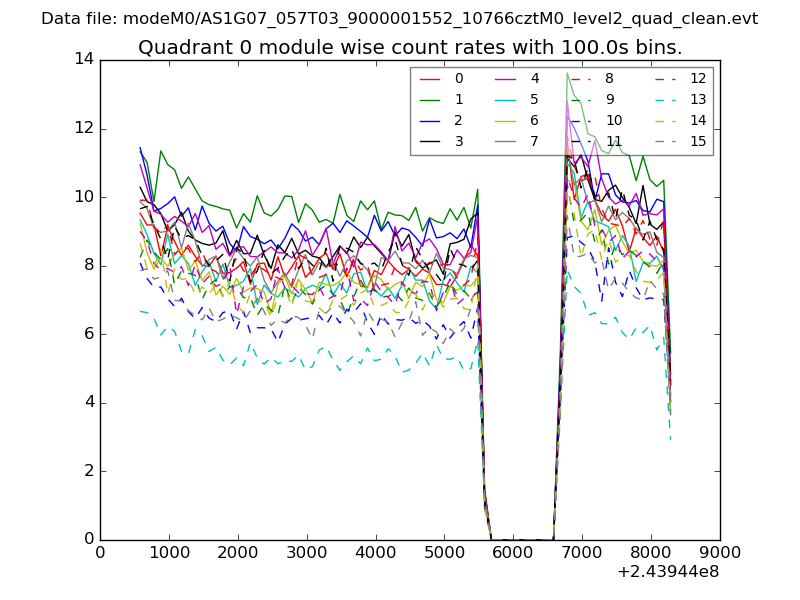 |
 |
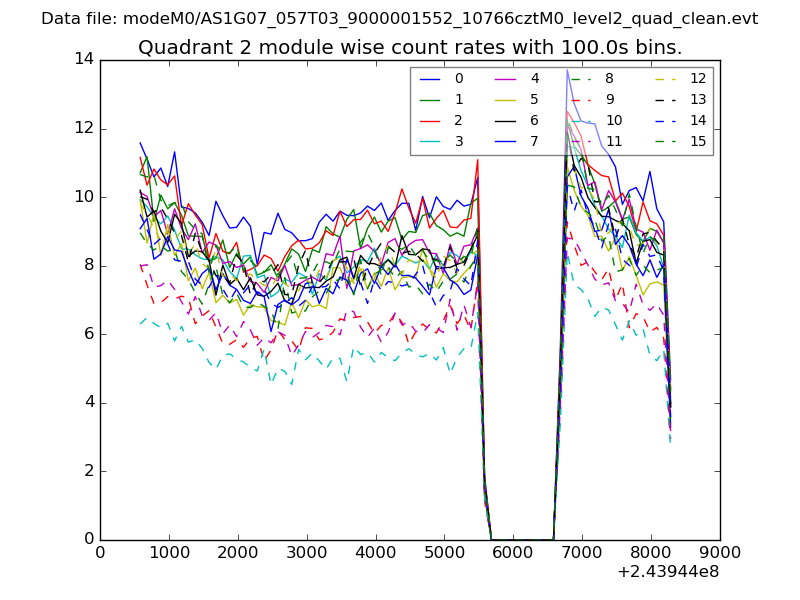
| Module-wise count rates for Quadrant B Data is divided into 100 sec bins |
 |
 |
| Module-wise count rates for Quadrant C Data is divided into 100 sec bins |
 |
 |
| Module-wise count rates for Quadrant D Data is divided into 100 sec bins |
 |
 |
| Parameter | Plot |
|---|---|
| CZT HV Monitor | 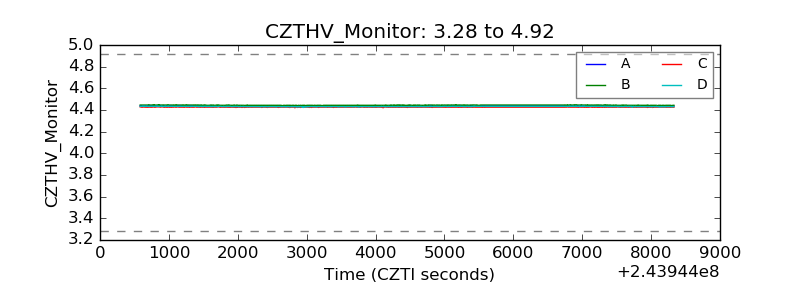 |
| D_VDD | 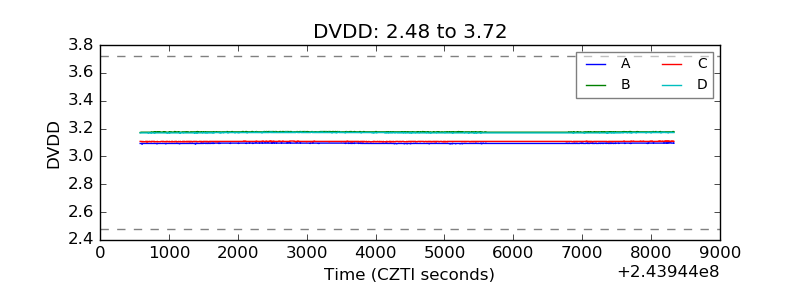 |
| Temperature 1 | 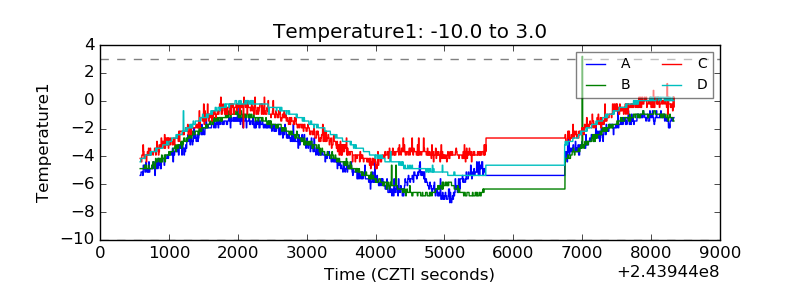 |
| Veto HV Monitor |  |
| Veto LLD | 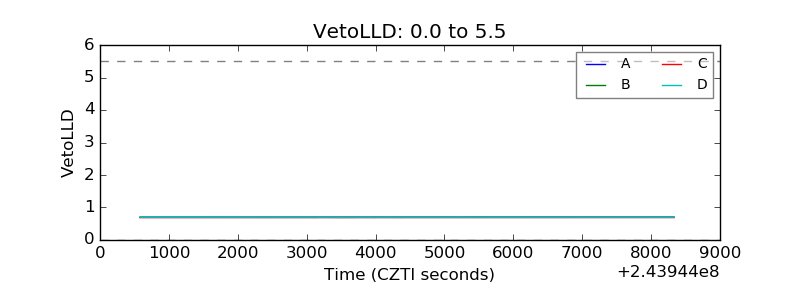 |
| Alpha Counter | 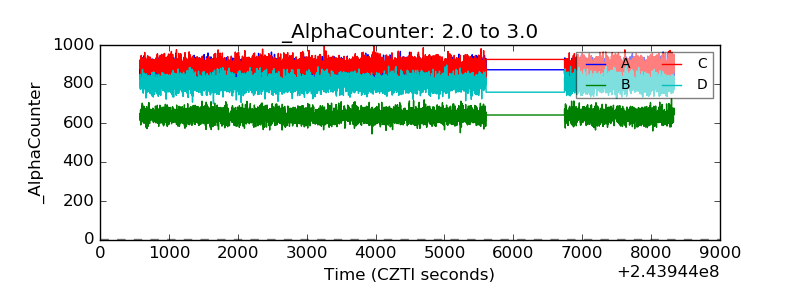 |
| _CPM_Rate | 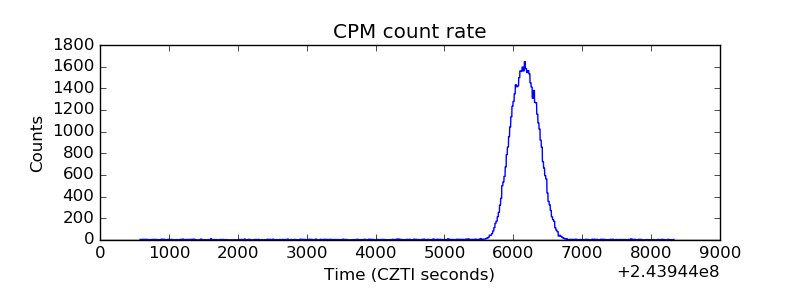 |
| CZT Counter | 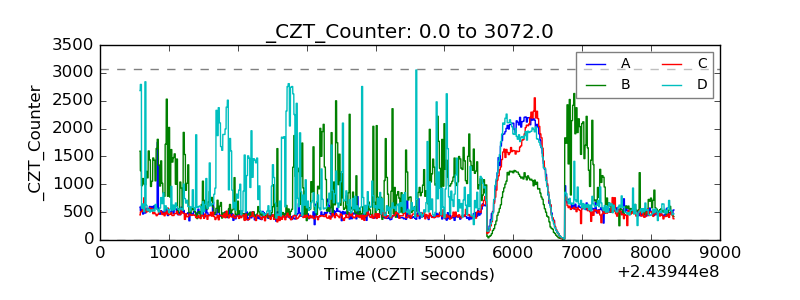 |
| +2.5 Volts monitor |  |
| +5 Volts monitor |  |
| _ROLL_ROT | 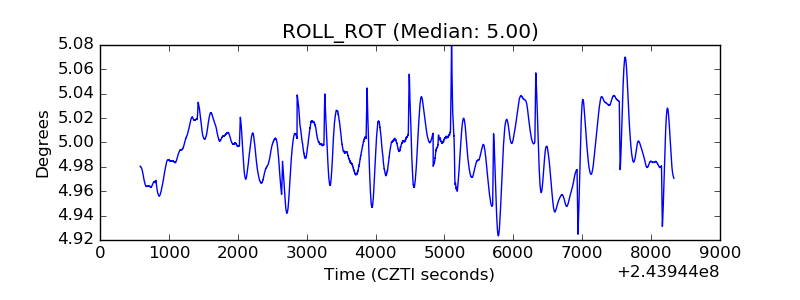 |
| _Roll_DEC | 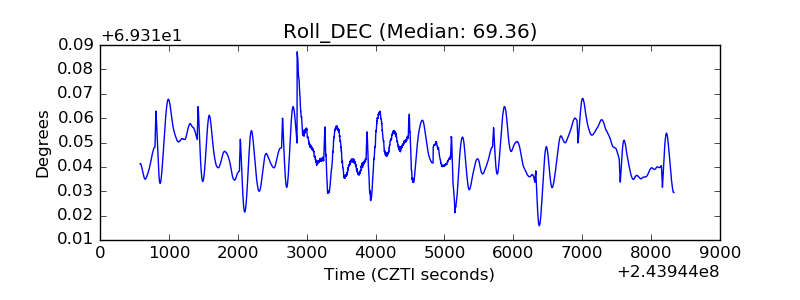 |
| _Roll_RA | 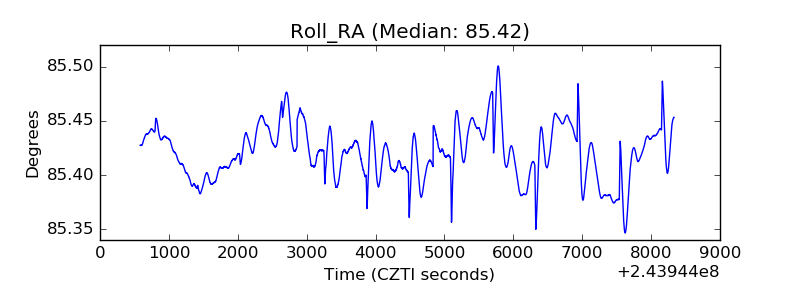 |
| Veto Counter | 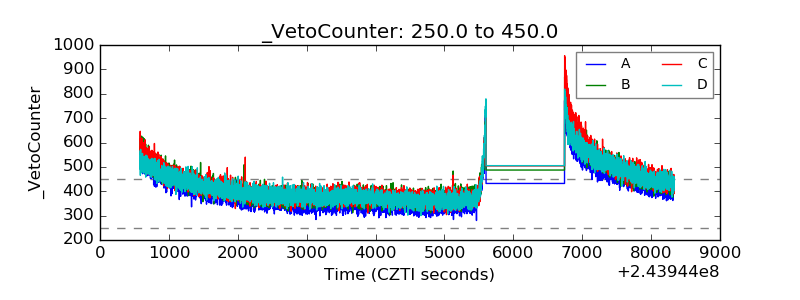 |