| Param | Original file | Final file |
|---|---|---|
| Filename | modeM0/AS1G07_057T03_9000001552_10767cztM0_level2.evt | modeM0/AS1G07_057T03_9000001552_10767cztM0_level2_quad_clean.evt |
| Size (bytes) | 501,742,080 | 118,589,760 |
| Size | 478.5 MB | 113.1 MB |
| Events in quadrant A | 3,038,592 | 807,102 |
| Events in quadrant B | 4,669,503 | 794,384 |
| Events in quadrant C | 2,804,650 | 811,827 |
| Events in quadrant D | 4,276,745 | 760,308 |
| Mode M9 | |||
|---|---|---|---|
| Quadrant | BADHDUFLAG | Total packets | Discarded packets |
| A | 0 | 13 | 0 |
| B | 0 | 13 | 0 |
| C | 0 | 13 | 0 |
| D | 0 | 13 | 0 |
| Mode SS | |||
|---|---|---|---|
| Quadrant | BADHDUFLAG | Total packets | Discarded packets |
| A | 0 | 122 | 0 |
| B | 0 | 122 | 0 |
| C | 0 | 122 | 0 |
| D | 0 | 122 | 0 |
| Mode M0 | |||
|---|---|---|---|
| Quadrant | BADHDUFLAG | Total packets | Discarded packets |
| A | 0 | 12928 | 2 |
| B | 0 | 17753 | 1 |
| C | 0 | 12275 | 1 |
| D | 0 | 16820 | 1 |
| Quadrant | Total seconds | Saturated seconds | Saturation percentage |
|---|---|---|---|
| A | 5983 | 88 | 1.470834% |
| B | 5983 | 459 | 7.671737% |
| C | 5983 | 30 | 0.501421% |
| D | 5983 | 156 | 2.607388% |
Noise dominated data is calculated using 1-second bins in cleaned event files. If a bin has >2000 counts, and if more than 50% of those come from <1% of pixels, then it is considered to be noise-dominated and hence unusable.
| Quadrant | # 1 sec bins | Bins with >0 counts | Bins with >2000 counts | High rate bins dominated by noise | Noise dominated (total time) | Noise dominated (detector-on time) | Marked lightcurve |
|---|---|---|---|---|---|---|---|
| A | 7243 | 5984 | 28 | 28 | 0.39% | 0.47% | 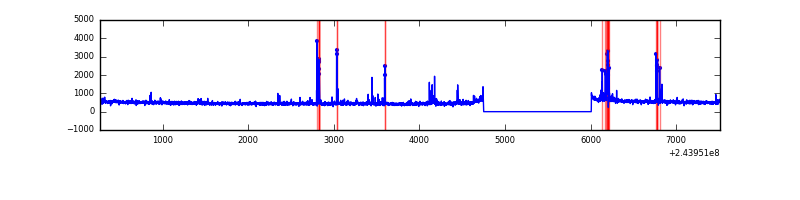 |
| B | 7243 | 5984 | 257 | 257 | 3.55% | 4.29% | 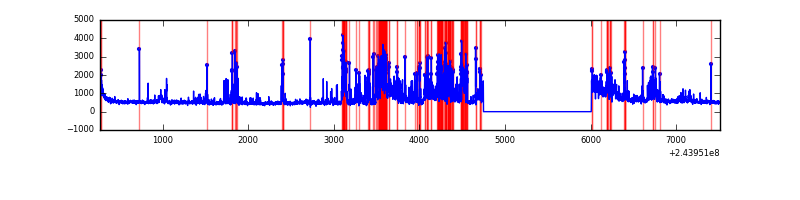 |
| C | 7243 | 5984 | 0 | 0 | 0.00% | 0.00% | 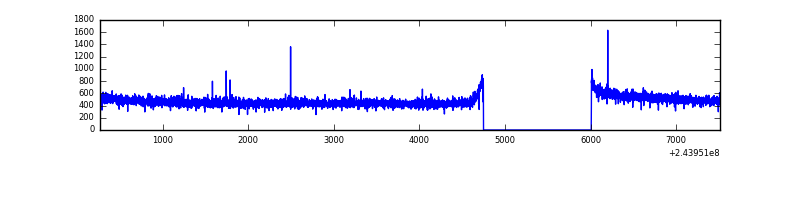 |
| D | 7243 | 5984 | 99 | 99 | 1.37% | 1.65% | 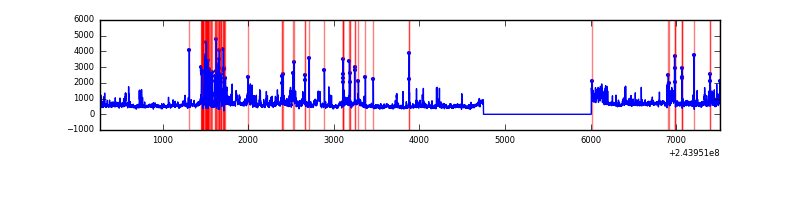 |
Top three noisy pixels from each quadrant. If the there are fewer than three noisy pixels in the level2.evt file, extra rows are filled as -1
| Pixel properties | Quadrant properties | ||||||
|---|---|---|---|---|---|---|---|
| Quadrant | DetID | PixID | Counts | Sigma | Mean | Median | Sigma |
| A | 15 | 223 | 76636 | 527.94 | 728 | 715 | 143.8 |
| A | 15 | 174 | 66274 | 455.88 | 728 | 715 | 143.8 |
| A | 15 | 239 | 34564 | 235.38 | 728 | 715 | 143.8 |
| B | 4 | 239 | 846609 | 6376.09 | 714 | 698 | 132.7 |
| B | 0 | 85 | 831876 | 6265.04 | 714 | 698 | 132.7 |
| B | 15 | 204 | 116912 | 875.97 | 714 | 698 | 132.7 |
| C | 13 | 61 | 5391 | 28.64 | 716 | 720 | 163.1 |
| C | 8 | 222 | 4205 | 21.37 | 716 | 720 | 163.1 |
| C | 8 | 208 | 3641 | 17.91 | 716 | 720 | 163.1 |
| D | 10 | 157 | 496232 | 2937.18 | 706 | 687 | 168.7 |
| D | 8 | 195 | 318764 | 1885.29 | 706 | 687 | 168.7 |
| D | 10 | 199 | 259955 | 1536.72 | 706 | 687 | 168.7 |
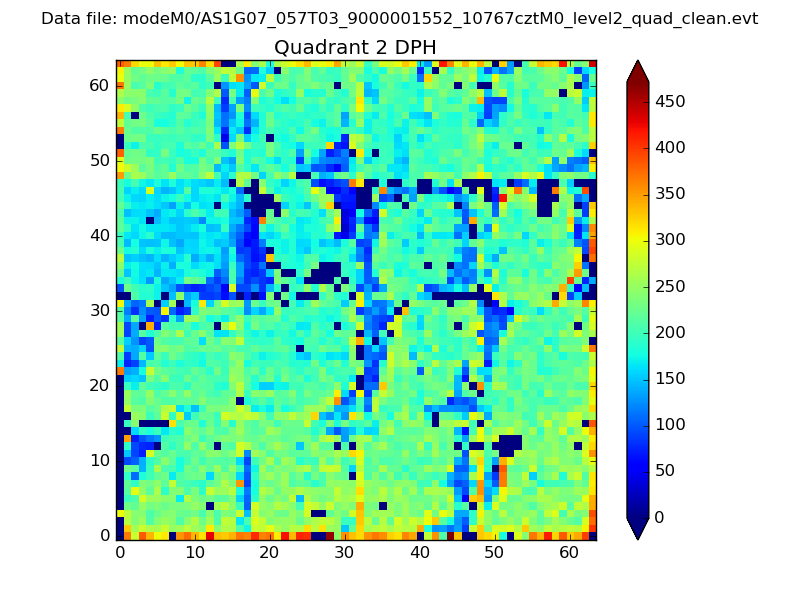
Histogram calculated using DETX and DETY for each event in the final _common_clean file
| Quadrant A | 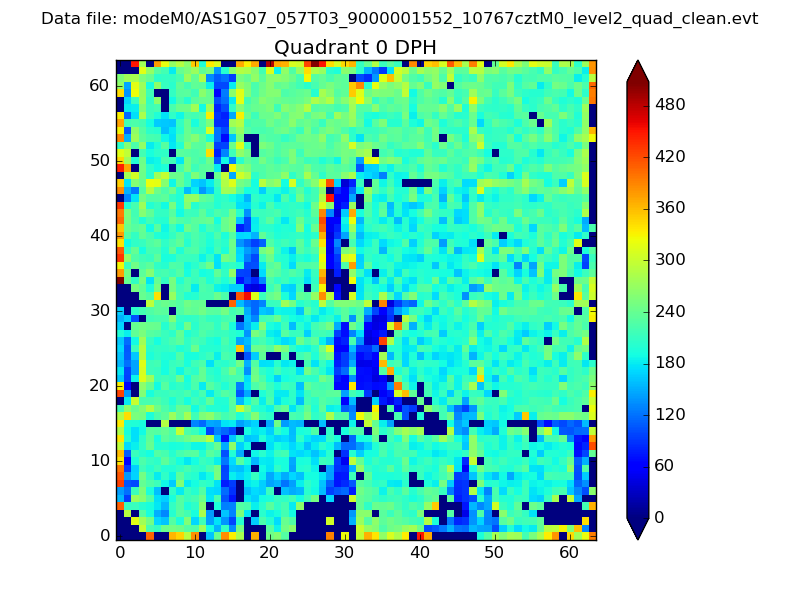 |
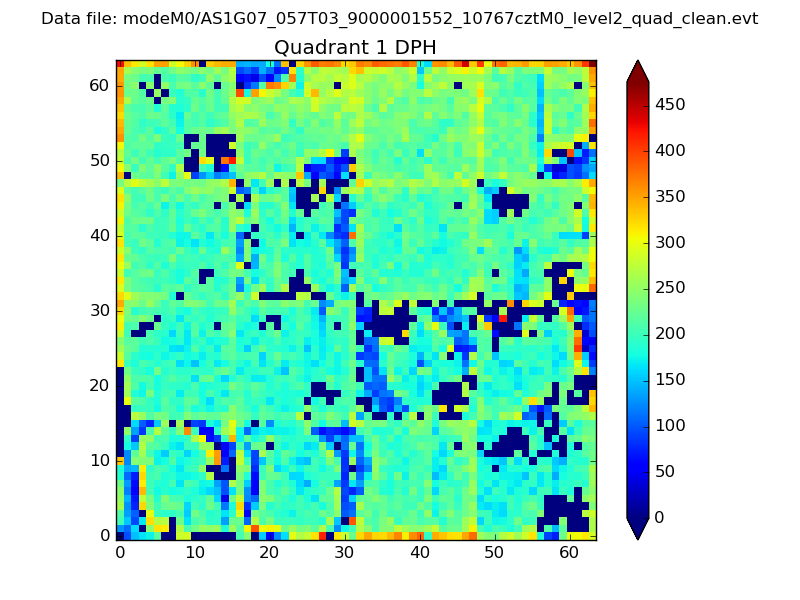 |
Quadrant B |
|---|---|---|---|
| Quadrant D | 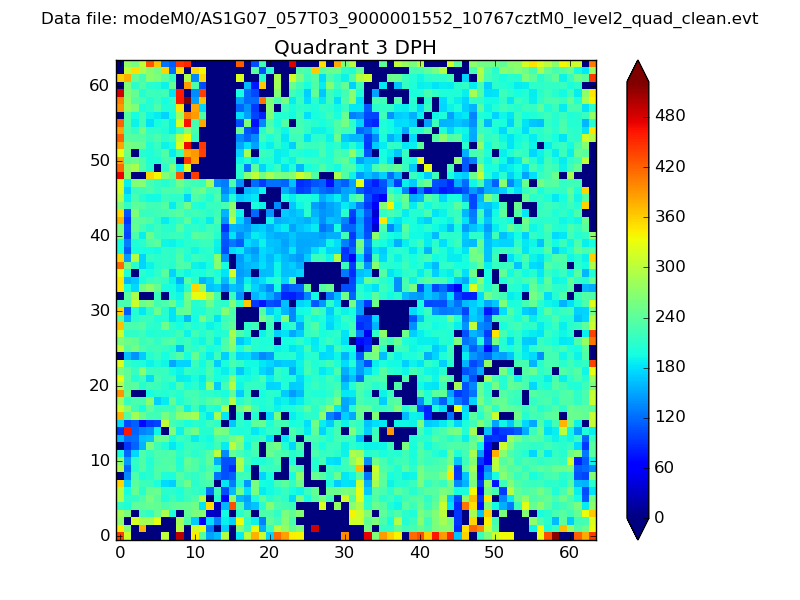 |
 |
Quadrant C |
| Plot type | Count rate plots | Images |
|---|---|---|
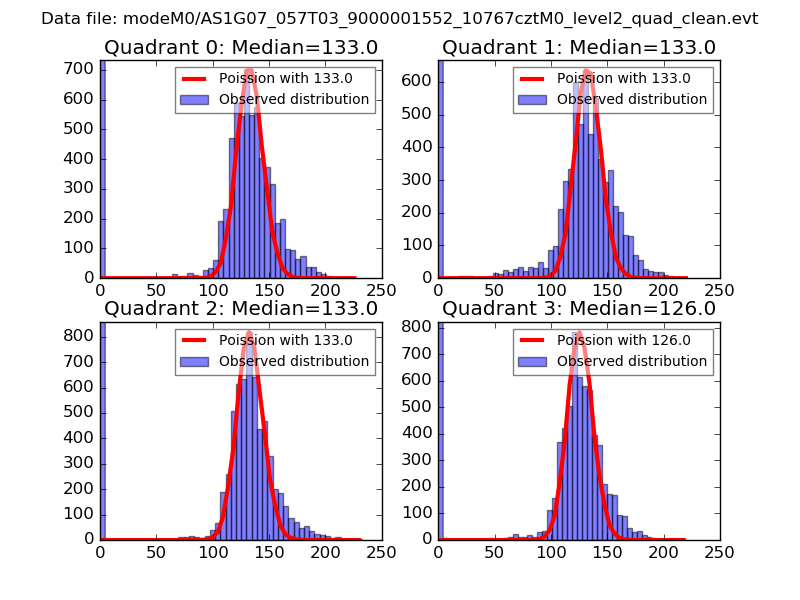
| Comparison with Poisson distribution Blue bars denote a histogram of data divided into 1 sec bins. Red curve is a Poisson curve with rate = median count rate of data. |
 |
 |
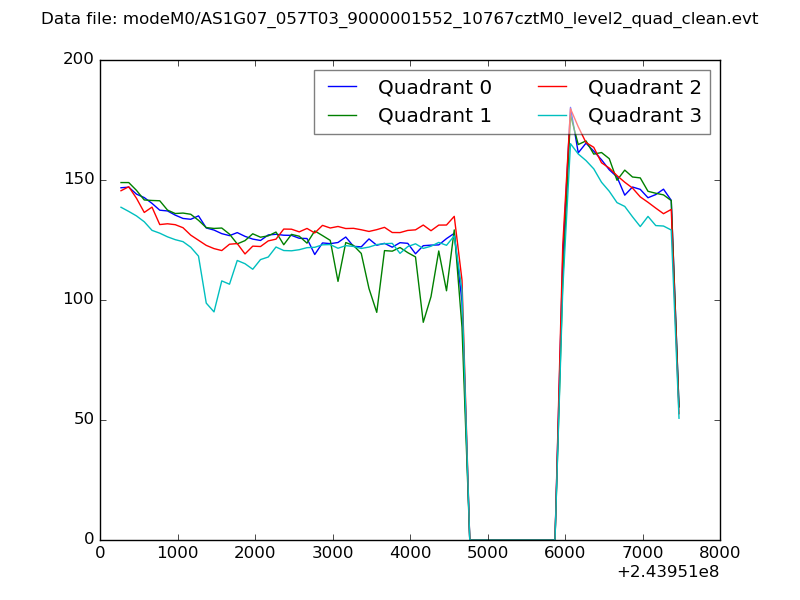
| Quadrant-wise count rates Data is divided into 100 sec bins |
 |
|
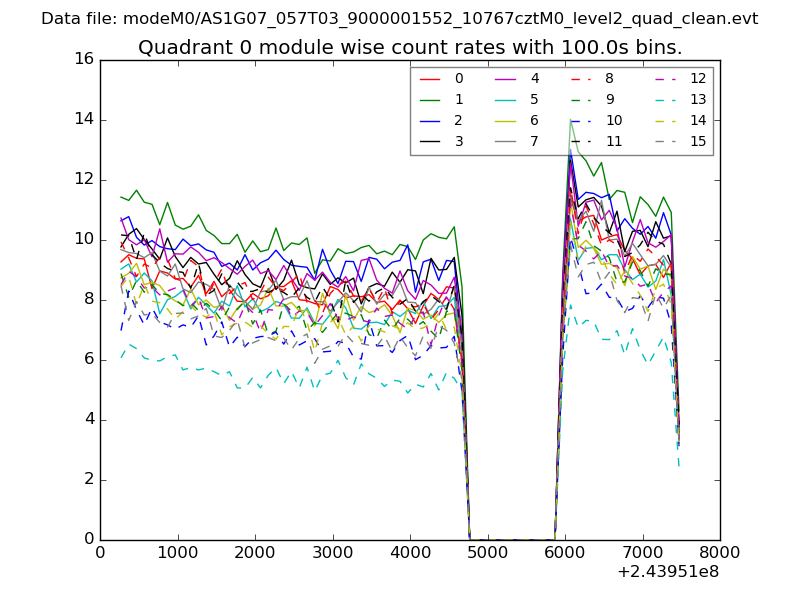
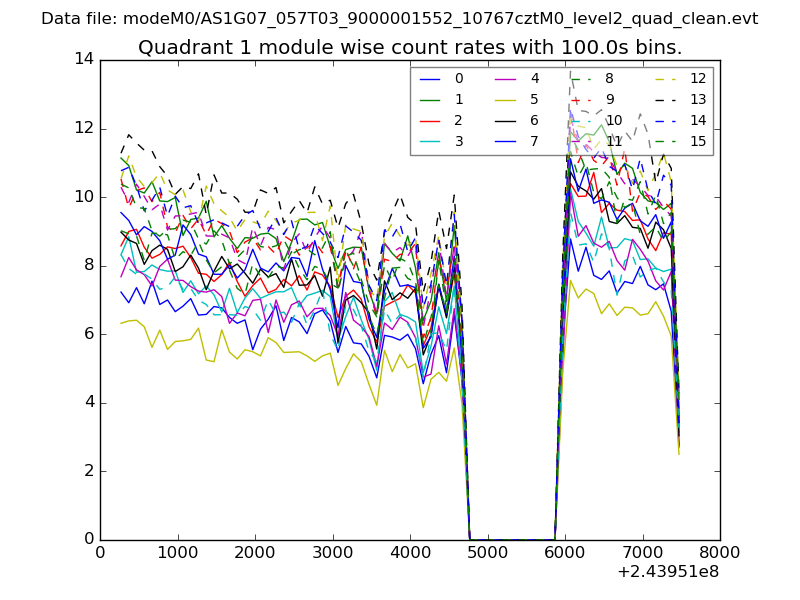
| Module-wise count rates for Quadrant A Data is divided into 100 sec bins |
 |
 |
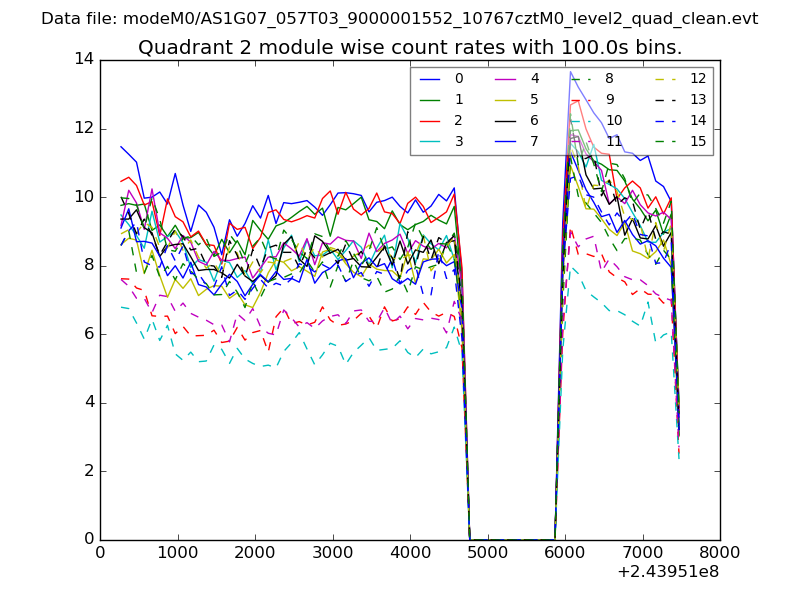
| Module-wise count rates for Quadrant B Data is divided into 100 sec bins |
 |
 |
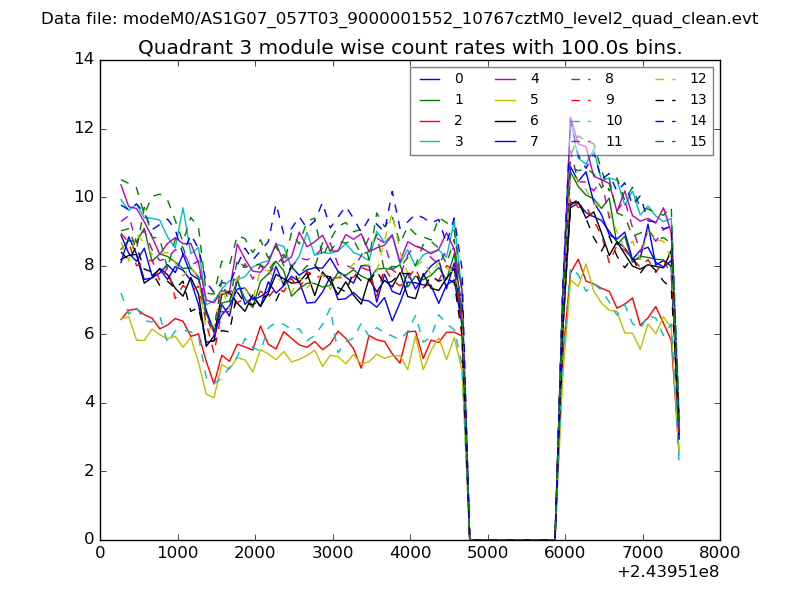
| Module-wise count rates for Quadrant C Data is divided into 100 sec bins |
 |
 |
| Module-wise count rates for Quadrant D Data is divided into 100 sec bins |
 |
 |
| Parameter | Plot |
|---|---|
| CZT HV Monitor | 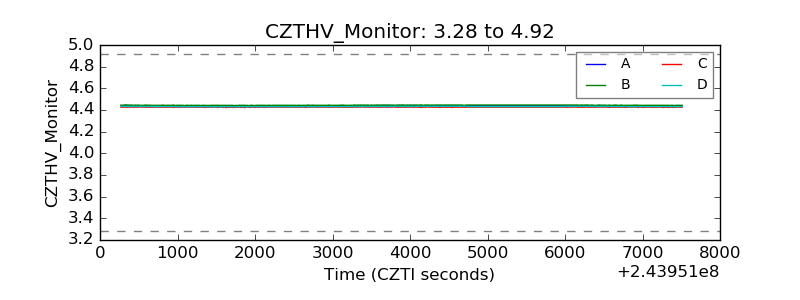 |
| D_VDD | 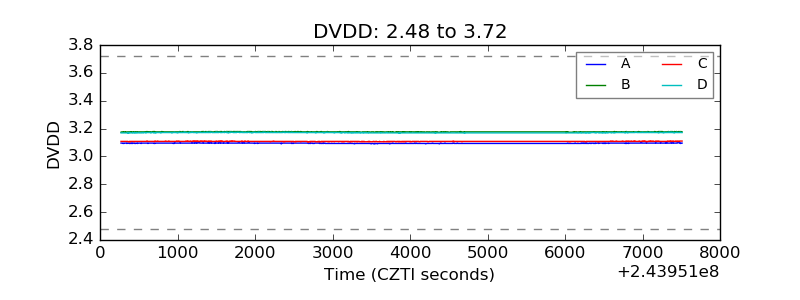 |
| Temperature 1 | 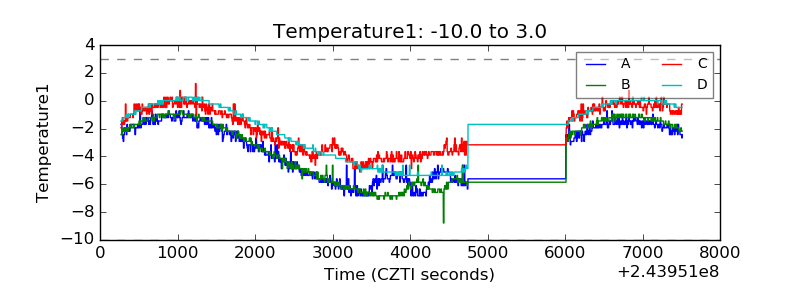 |
| Veto HV Monitor | 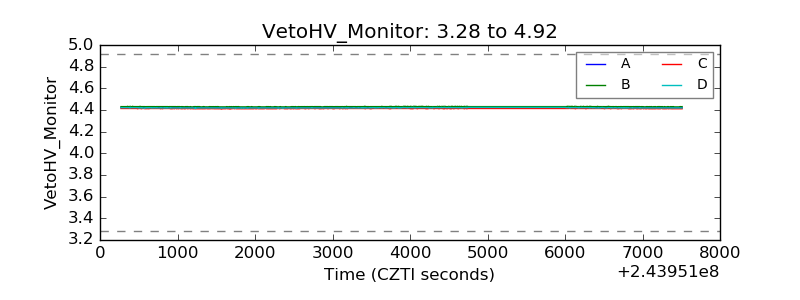 |
| Veto LLD | 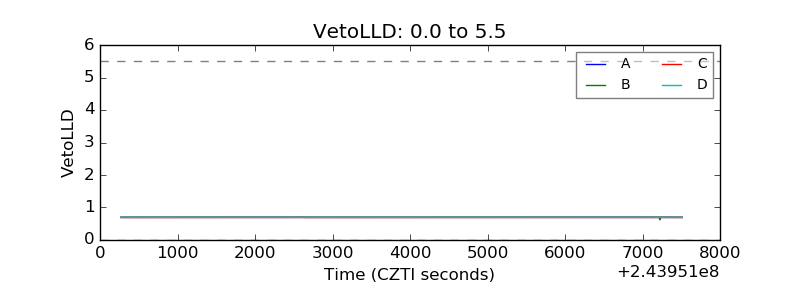 |
| Alpha Counter | 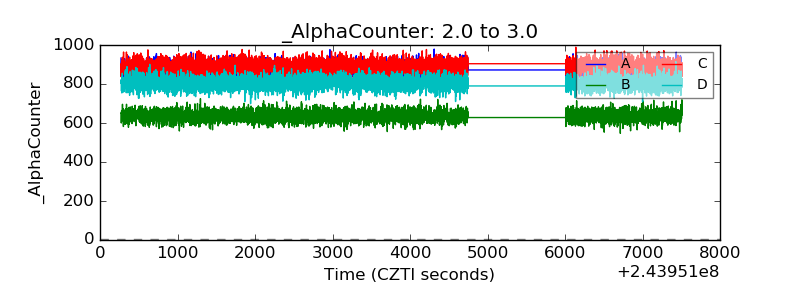 |
| _CPM_Rate | 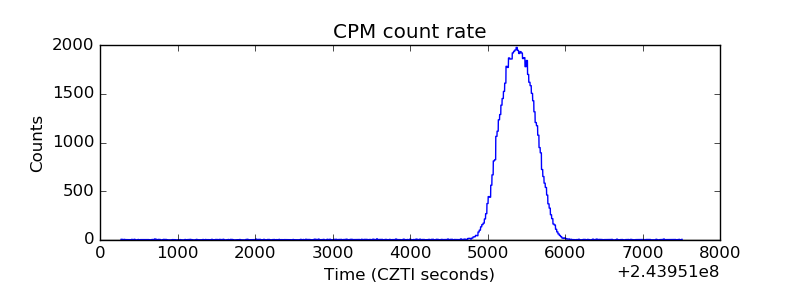 |
| CZT Counter | 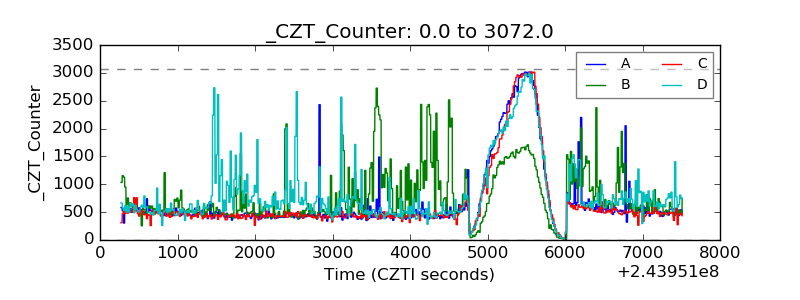 |
| +2.5 Volts monitor |  |
| +5 Volts monitor | 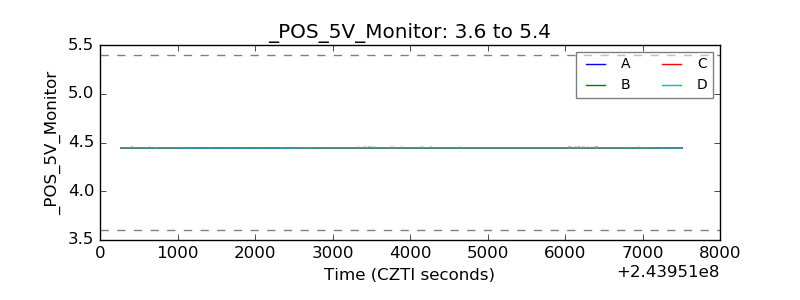 |
| _ROLL_ROT | 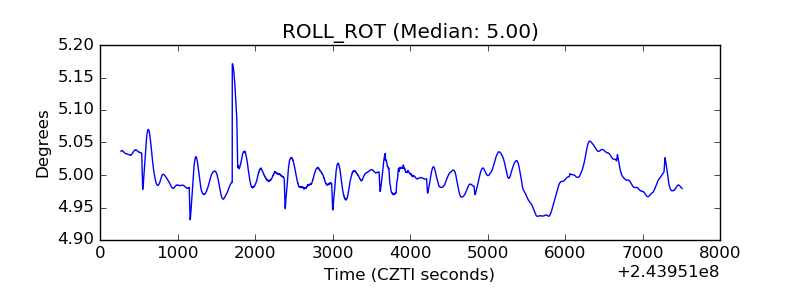 |
| _Roll_DEC |  |
| _Roll_RA | 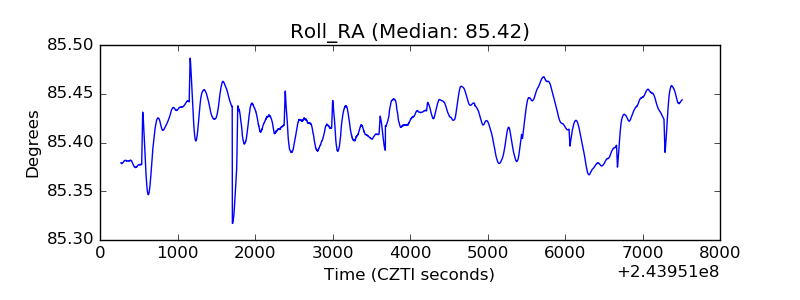 |
| Veto Counter | 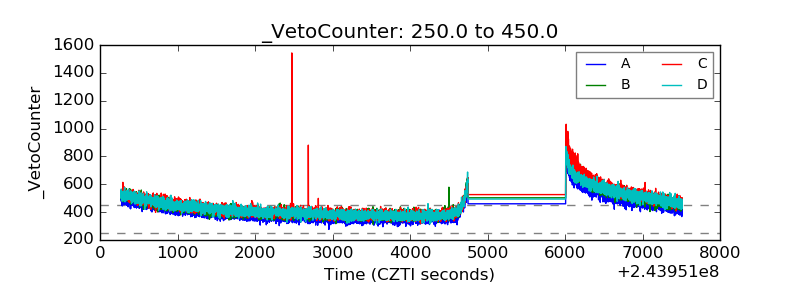 |