| Param | Original file | Final file |
|---|---|---|
| Filename | modeM0/AS1G07_057T03_9000001552_10768cztM0_level2.evt | modeM0/AS1G07_057T03_9000001552_10768cztM0_level2_quad_clean.evt |
| Size (bytes) | 531,420,480 | 119,995,200 |
| Size | 506.8 MB | 114.4 MB |
| Events in quadrant A | 3,146,132 | 816,790 |
| Events in quadrant B | 5,381,936 | 791,390 |
| Events in quadrant C | 2,847,436 | 834,807 |
| Events in quadrant D | 4,316,710 | 776,826 |
| Mode M9 | |||
|---|---|---|---|
| Quadrant | BADHDUFLAG | Total packets | Discarded packets |
| A | 0 | 13 | 0 |
| B | 0 | 13 | 0 |
| C | 0 | 13 | 0 |
| D | 0 | 13 | 0 |
| Mode SS | |||
|---|---|---|---|
| Quadrant | BADHDUFLAG | Total packets | Discarded packets |
| A | 0 | 122 | 0 |
| B | 0 | 122 | 0 |
| C | 0 | 122 | 0 |
| D | 0 | 122 | 0 |
| Mode M0 | |||
|---|---|---|---|
| Quadrant | BADHDUFLAG | Total packets | Discarded packets |
| A | 0 | 13203 | 2 |
| B | 0 | 19888 | 1 |
| C | 0 | 12196 | 1 |
| D | 0 | 17126 | 1 |
| Quadrant | Total seconds | Saturated seconds | Saturation percentage |
|---|---|---|---|
| A | 5920 | 132 | 2.229730% |
| B | 5920 | 873 | 14.746622% |
| C | 5920 | 56 | 0.945946% |
| D | 5920 | 222 | 3.750000% |
Noise dominated data is calculated using 1-second bins in cleaned event files. If a bin has >2000 counts, and if more than 50% of those come from <1% of pixels, then it is considered to be noise-dominated and hence unusable.
| Quadrant | # 1 sec bins | Bins with >0 counts | Bins with >2000 counts | High rate bins dominated by noise | Noise dominated (total time) | Noise dominated (detector-on time) | Marked lightcurve |
|---|---|---|---|---|---|---|---|
| A | 7220 | 5921 | 36 | 36 | 0.50% | 0.61% | 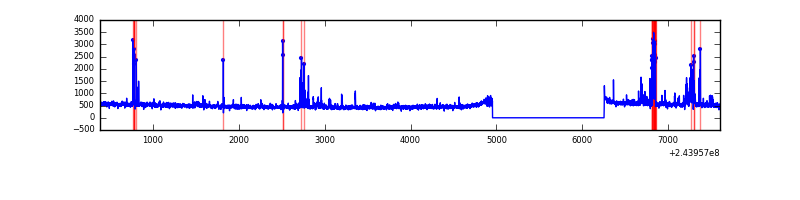 |
| B | 7220 | 5920 | 561 | 561 | 7.77% | 9.48% | 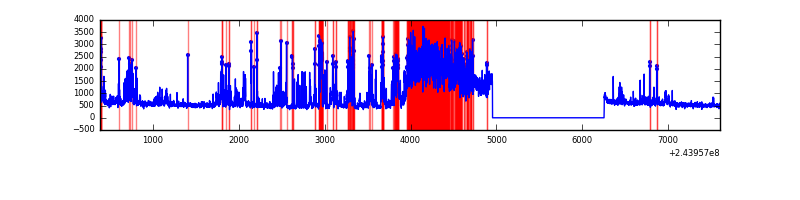 |
| C | 7220 | 5921 | 0 | 0 | 0.00% | 0.00% |  |
| D | 7220 | 5921 | 152 | 152 | 2.11% | 2.57% | 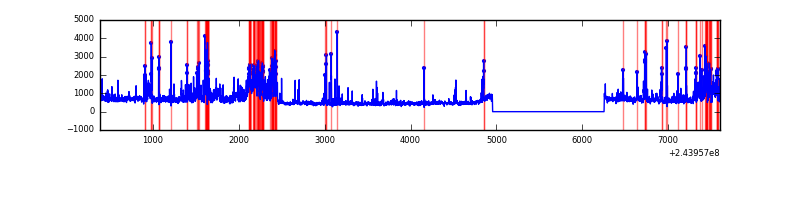 |
Top three noisy pixels from each quadrant. If the there are fewer than three noisy pixels in the level2.evt file, extra rows are filled as -1
| Pixel properties | Quadrant properties | ||||||
|---|---|---|---|---|---|---|---|
| Quadrant | DetID | PixID | Counts | Sigma | Mean | Median | Sigma |
| A | 15 | 223 | 135397 | 918.4 | 734 | 721 | 146.6 |
| A | 15 | 239 | 66969 | 451.77 | 734 | 721 | 146.6 |
| A | 15 | 174 | 50544 | 339.76 | 734 | 721 | 146.6 |
| B | 0 | 85 | 1669064 | 12719.44 | 709 | 692 | 131.2 |
| B | 4 | 239 | 778995 | 5933.67 | 709 | 692 | 131.2 |
| B | 15 | 204 | 117926 | 893.78 | 709 | 692 | 131.2 |
| C | 13 | 61 | 5498 | 28.76 | 728 | 730 | 165.8 |
| C | 8 | 222 | 3386 | 16.02 | 728 | 730 | 165.8 |
| C | 5 | 207 | 3292 | 15.45 | 728 | 730 | 165.8 |
| D | 10 | 199 | 584599 | 3409.47 | 718 | 699 | 171.3 |
| D | 10 | 157 | 357968 | 2086.14 | 718 | 699 | 171.3 |
| D | 8 | 195 | 174711 | 1016.08 | 718 | 699 | 171.3 |
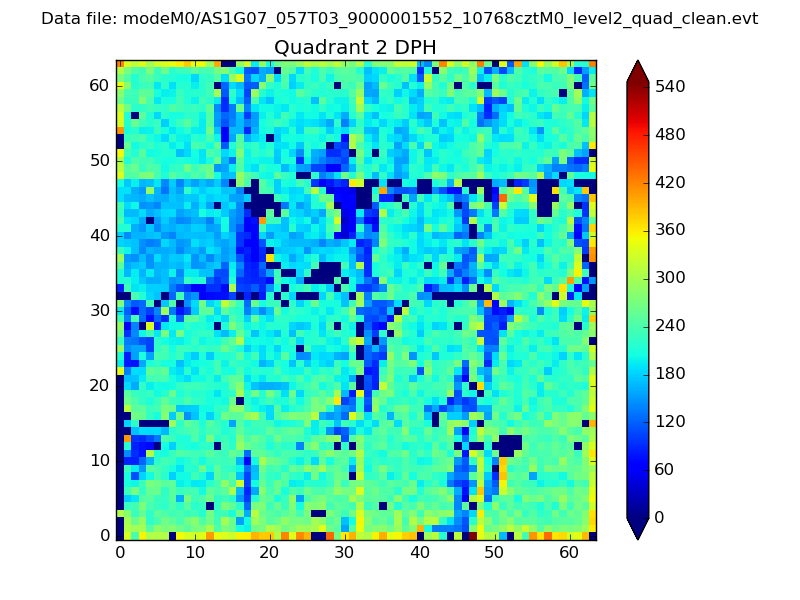
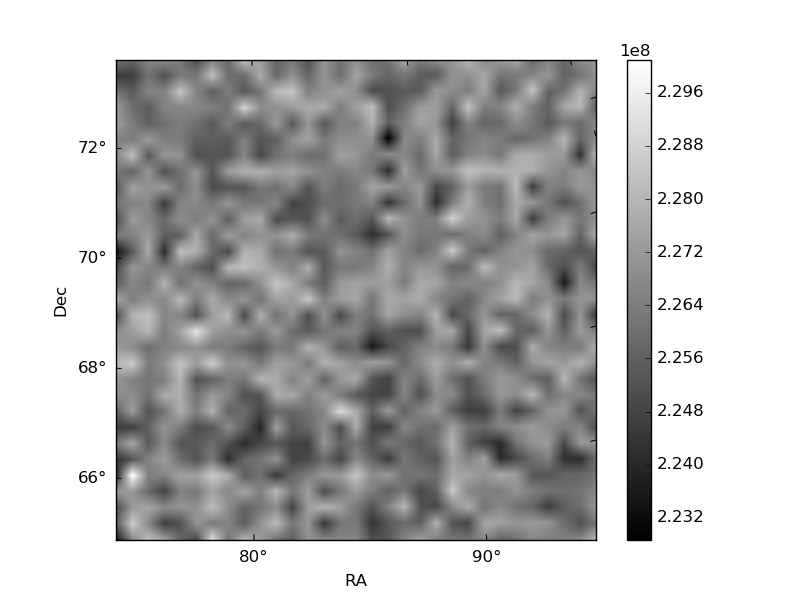
Histogram calculated using DETX and DETY for each event in the final _common_clean file
| Quadrant A | 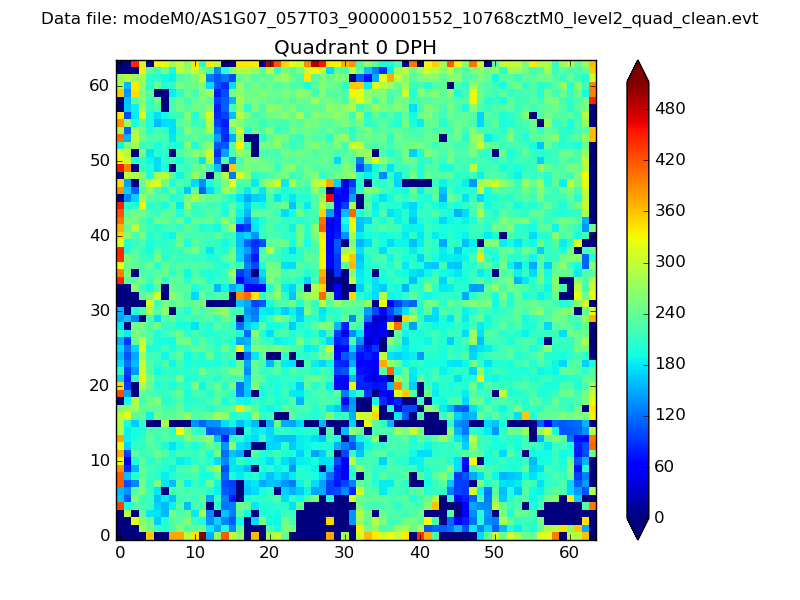 |
 |
Quadrant B |
|---|---|---|---|
| Quadrant D | 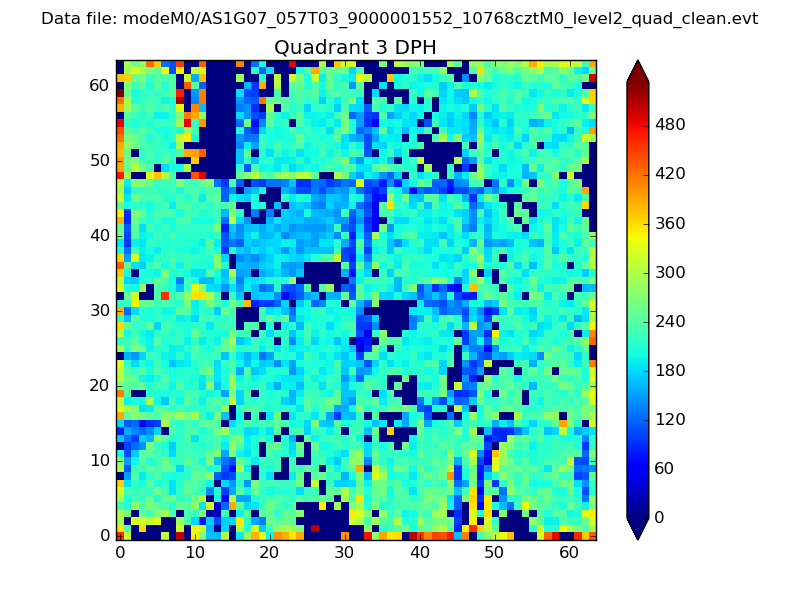 |
 |
Quadrant C |
| Plot type | Count rate plots | Images |
|---|---|---|
| Comparison with Poisson distribution Blue bars denote a histogram of data divided into 1 sec bins. Red curve is a Poisson curve with rate = median count rate of data. |
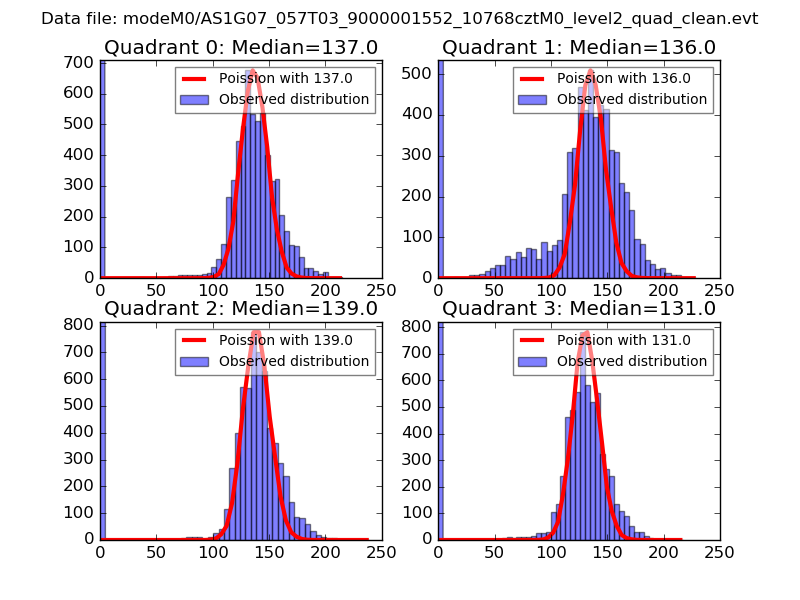 |
 |
| Quadrant-wise count rates Data is divided into 100 sec bins |
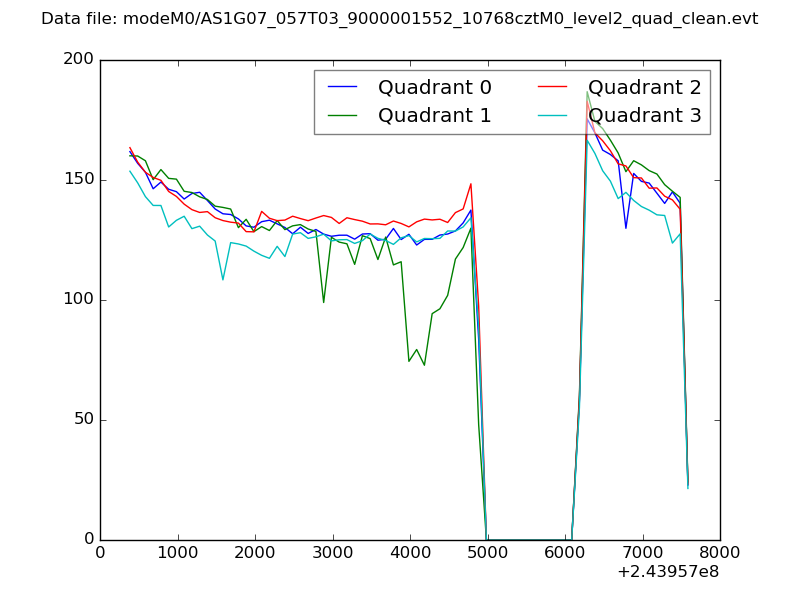 |
|
| Module-wise count rates for Quadrant A Data is divided into 100 sec bins |
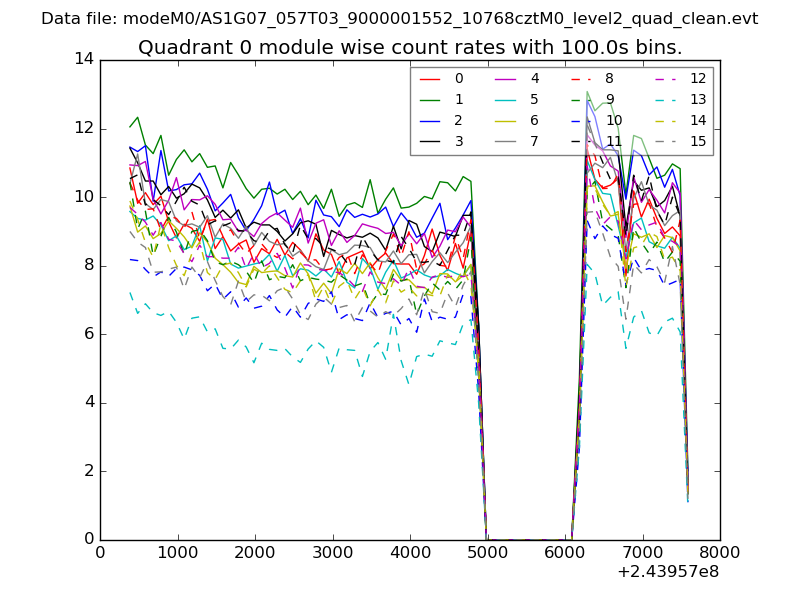 |
 |
| Module-wise count rates for Quadrant B Data is divided into 100 sec bins |
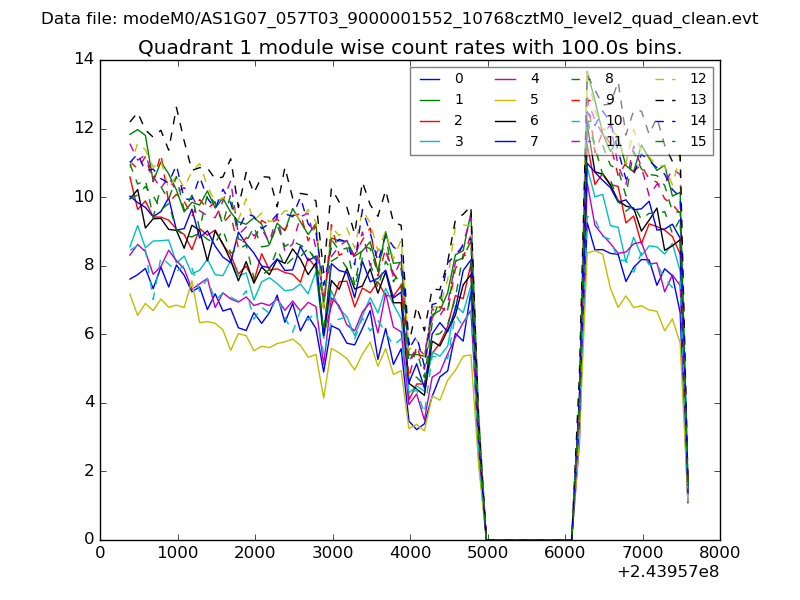 |
 |
| Module-wise count rates for Quadrant C Data is divided into 100 sec bins |
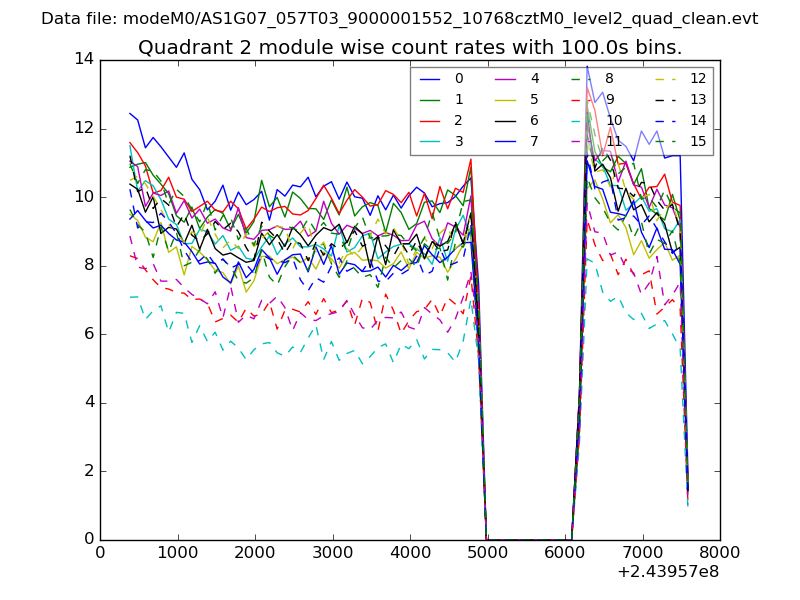 |
 |
| Module-wise count rates for Quadrant D Data is divided into 100 sec bins |
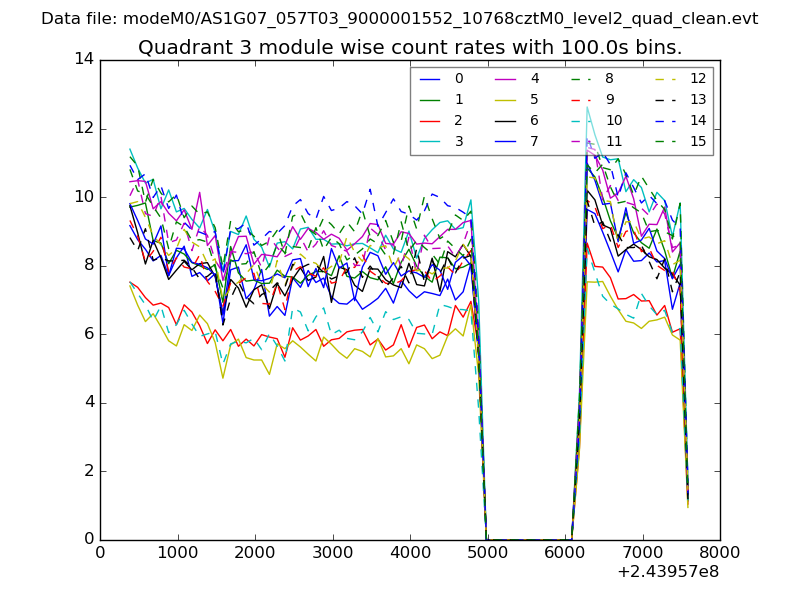 |
 |
| Parameter | Plot |
|---|---|
| CZT HV Monitor | 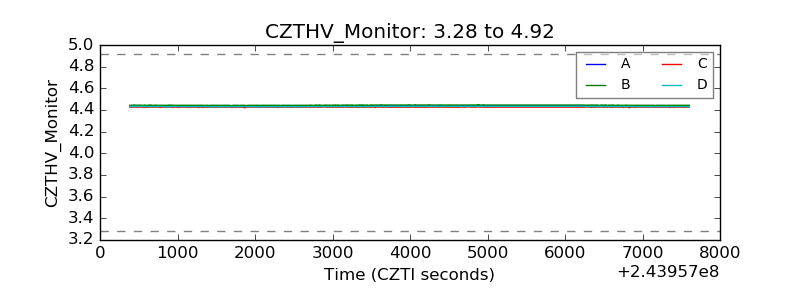 |
| D_VDD | 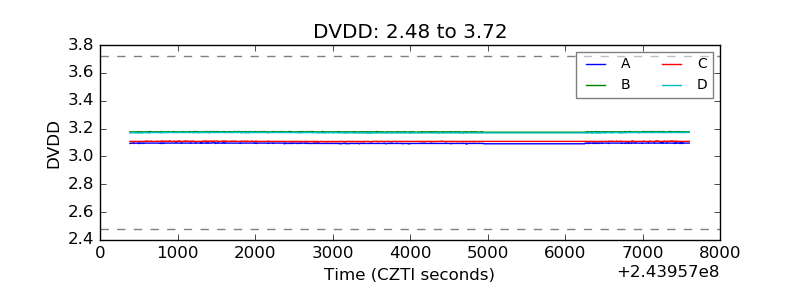 |
| Temperature 1 | 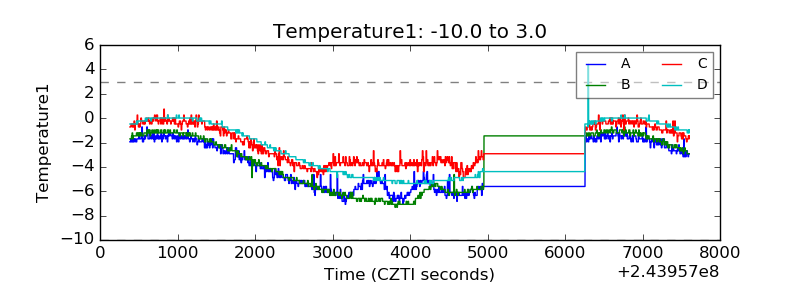 |
| Veto HV Monitor | 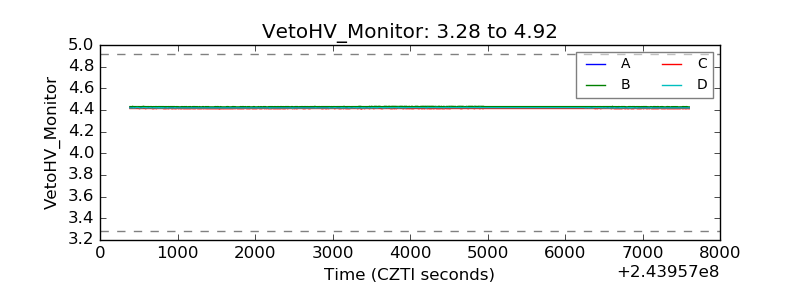 |
| Veto LLD | 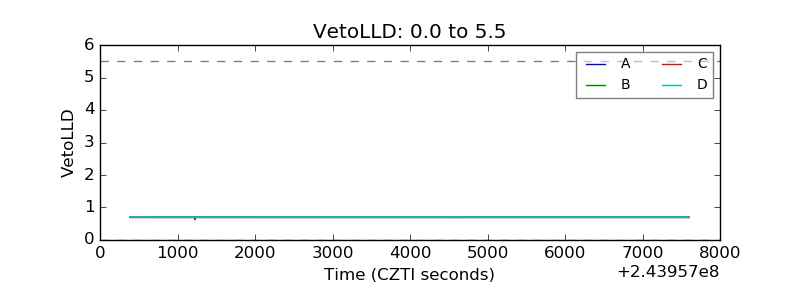 |
| Alpha Counter | 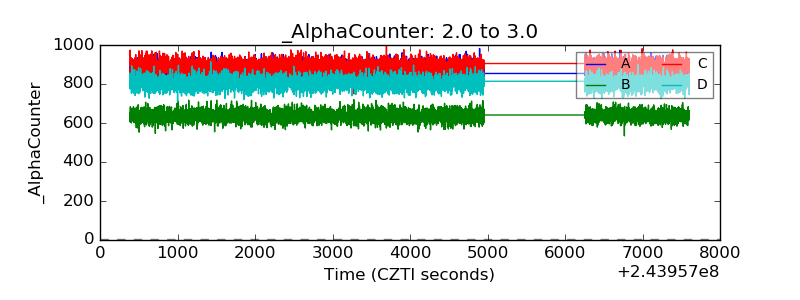 |
| _CPM_Rate | 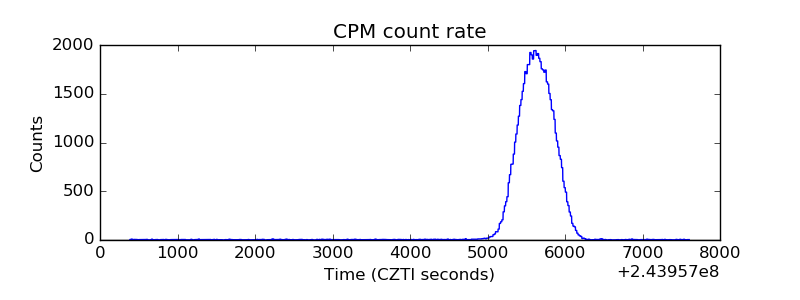 |
| CZT Counter | 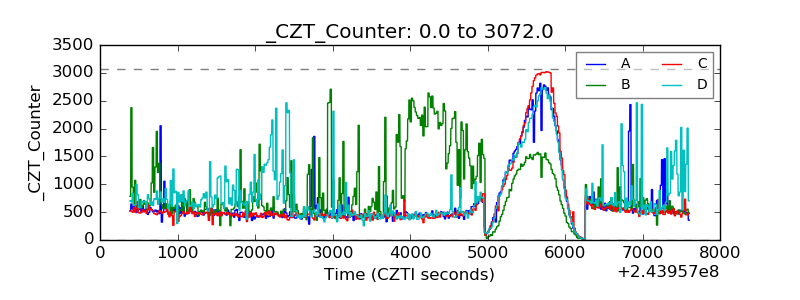 |
| +2.5 Volts monitor |  |
| +5 Volts monitor |  |
| _ROLL_ROT | 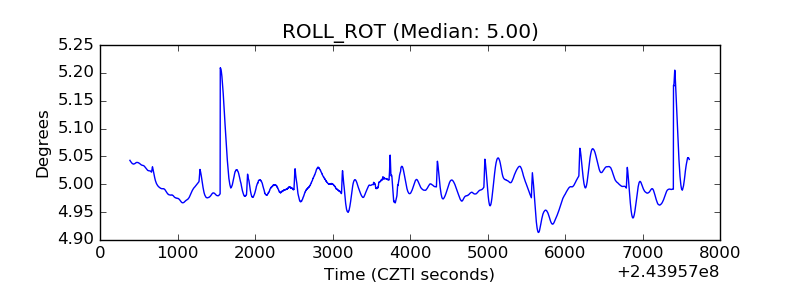 |
| _Roll_DEC | 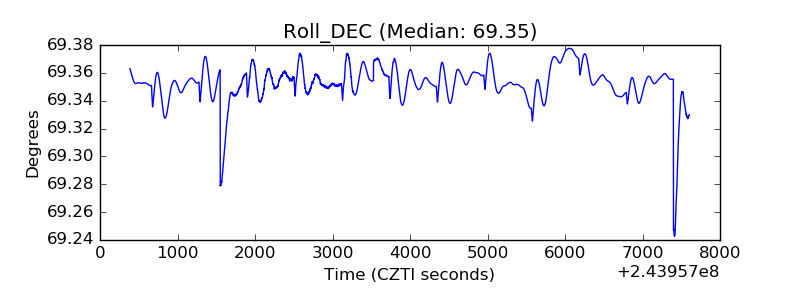 |
| _Roll_RA | 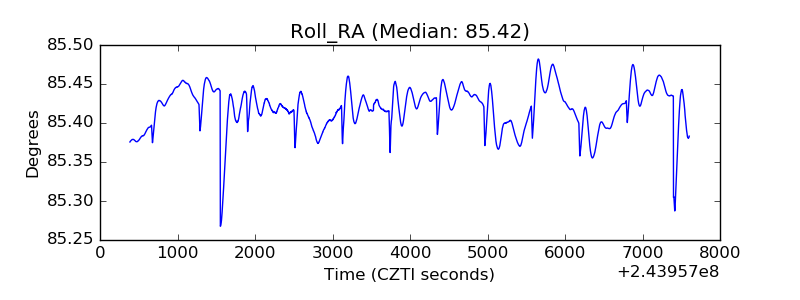 |
| Veto Counter | 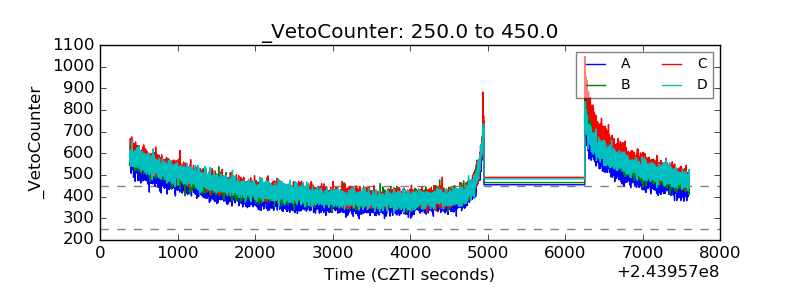 |