| Param | Original file | Final file |
|---|---|---|
| Filename | modeM0/AS1G07_057T03_9000001552_10769cztM0_level2.evt | modeM0/AS1G07_057T03_9000001552_10769cztM0_level2_quad_clean.evt |
| Size (bytes) | 521,714,880 | 124,326,720 |
| Size | 497.5 MB | 118.6 MB |
| Events in quadrant A | 3,781,067 | 824,431 |
| Events in quadrant B | 4,110,125 | 848,829 |
| Events in quadrant C | 2,937,649 | 863,637 |
| Events in quadrant D | 4,555,499 | 800,242 |
| Mode M9 | |||
|---|---|---|---|
| Quadrant | BADHDUFLAG | Total packets | Discarded packets |
| A | 0 | 14 | 0 |
| B | 0 | 14 | 0 |
| C | 0 | 14 | 0 |
| D | 0 | 14 | 0 |
| Mode SS | |||
|---|---|---|---|
| Quadrant | BADHDUFLAG | Total packets | Discarded packets |
| A | 0 | 124 | 0 |
| B | 0 | 124 | 0 |
| C | 0 | 124 | 0 |
| D | 0 | 124 | 0 |
| Mode M0 | |||
|---|---|---|---|
| Quadrant | BADHDUFLAG | Total packets | Discarded packets |
| A | 0 | 15260 | 2 |
| B | 0 | 16158 | 1 |
| C | 0 | 12648 | 1 |
| D | 0 | 17829 | 1 |
| Quadrant | Total seconds | Saturated seconds | Saturation percentage |
|---|---|---|---|
| A | 6137 | 219 | 3.568519% |
| B | 6137 | 301 | 4.904677% |
| C | 6137 | 52 | 0.847320% |
| D | 6137 | 247 | 4.024768% |
Noise dominated data is calculated using 1-second bins in cleaned event files. If a bin has >2000 counts, and if more than 50% of those come from <1% of pixels, then it is considered to be noise-dominated and hence unusable.
| Quadrant | # 1 sec bins | Bins with >0 counts | Bins with >2000 counts | High rate bins dominated by noise | Noise dominated (total time) | Noise dominated (detector-on time) | Marked lightcurve |
|---|---|---|---|---|---|---|---|
| A | 7457 | 6138 | 84 | 84 | 1.13% | 1.37% | 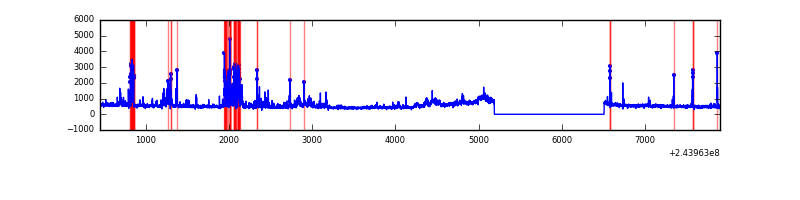 |
| B | 7457 | 6138 | 157 | 157 | 2.11% | 2.56% | 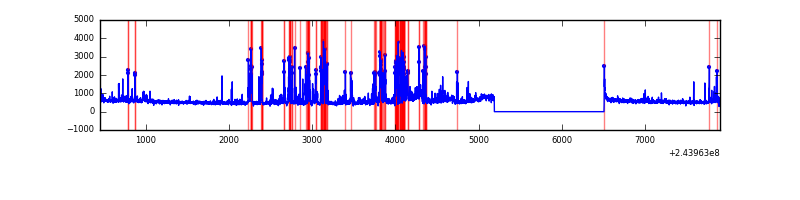 |
| C | 7457 | 6138 | 0 | 0 | 0.00% | 0.00% | 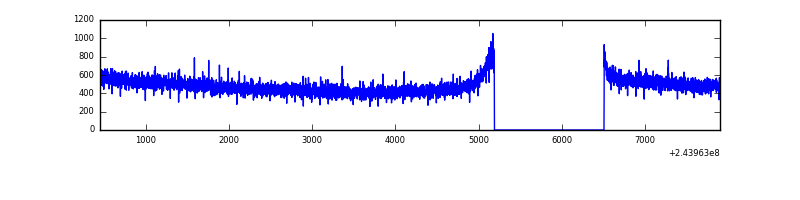 |
| D | 7457 | 6138 | 158 | 158 | 2.12% | 2.57% | 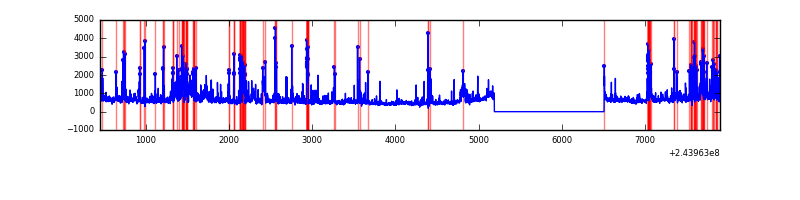 |
Top three noisy pixels from each quadrant. If the there are fewer than three noisy pixels in the level2.evt file, extra rows are filled as -1
| Pixel properties | Quadrant properties | ||||||
|---|---|---|---|---|---|---|---|
| Quadrant | DetID | PixID | Counts | Sigma | Mean | Median | Sigma |
| A | 15 | 239 | 475358 | 3164.05 | 748 | 735 | 150.0 |
| A | 15 | 223 | 241464 | 1604.81 | 748 | 735 | 150.0 |
| A | 4 | 2 | 88795 | 587.05 | 748 | 735 | 150.0 |
| B | 4 | 239 | 745630 | 5313.31 | 756 | 740 | 140.2 |
| B | 0 | 85 | 313323 | 2229.66 | 756 | 740 | 140.2 |
| B | 15 | 204 | 50231 | 353.02 | 756 | 740 | 140.2 |
| C | 13 | 61 | 5767 | 29.28 | 752 | 756 | 171.1 |
| C | 8 | 222 | 3339 | 15.09 | 752 | 756 | 171.1 |
| C | 3 | 202 | 1931 | 6.87 | 752 | 756 | 171.1 |
| D | 1 | 52 | 458799 | 2637.39 | 739 | 721 | 173.7 |
| D | 10 | 199 | 437780 | 2516.37 | 739 | 721 | 173.7 |
| D | 8 | 195 | 399524 | 2296.11 | 739 | 721 | 173.7 |
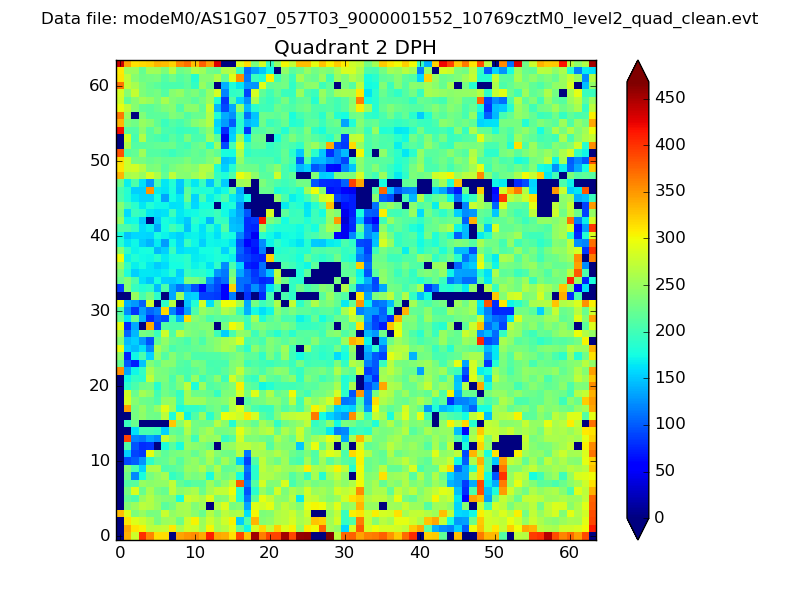
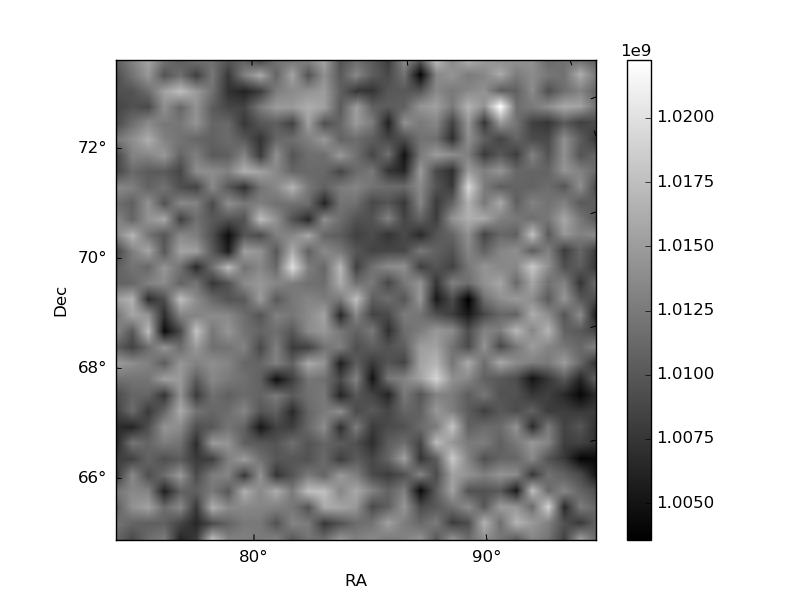
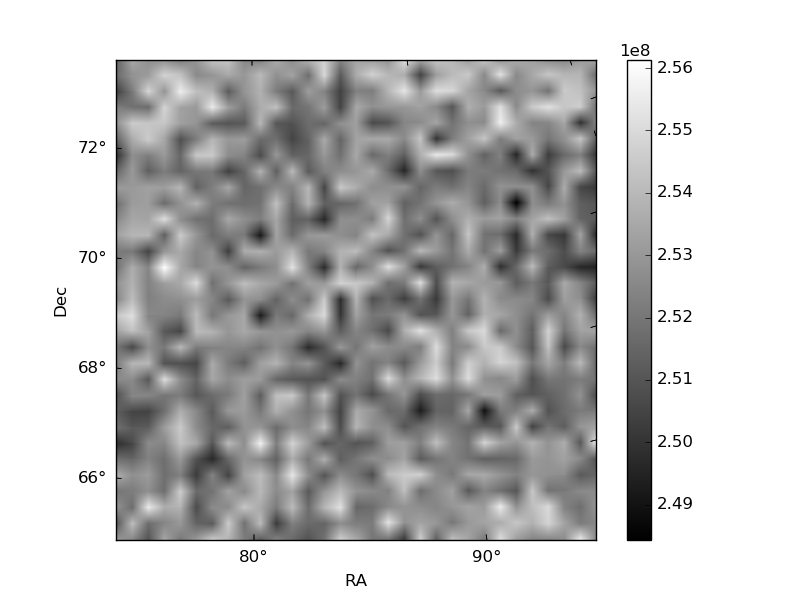
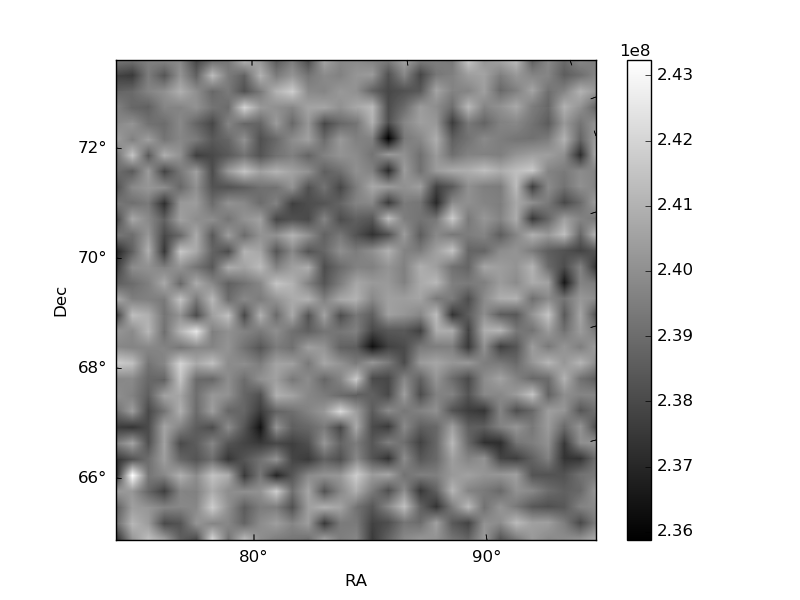
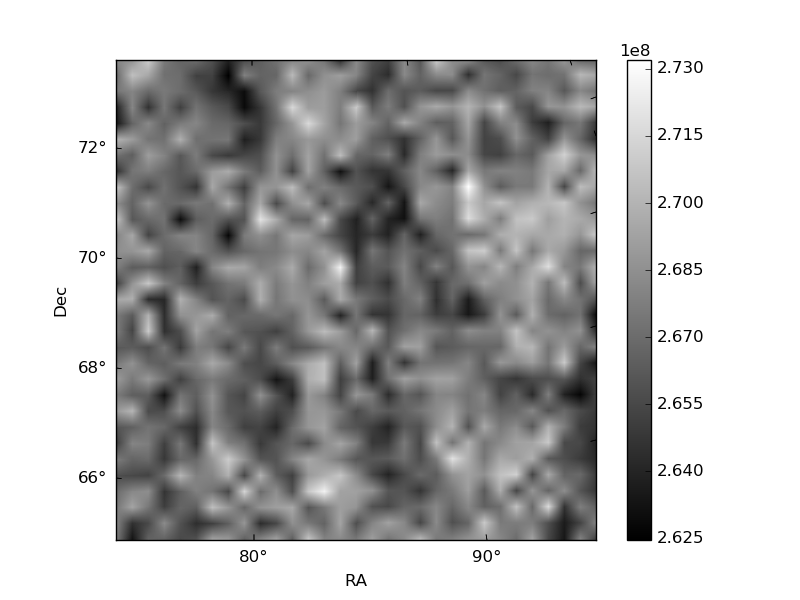
Histogram calculated using DETX and DETY for each event in the final _common_clean file
| Quadrant A | 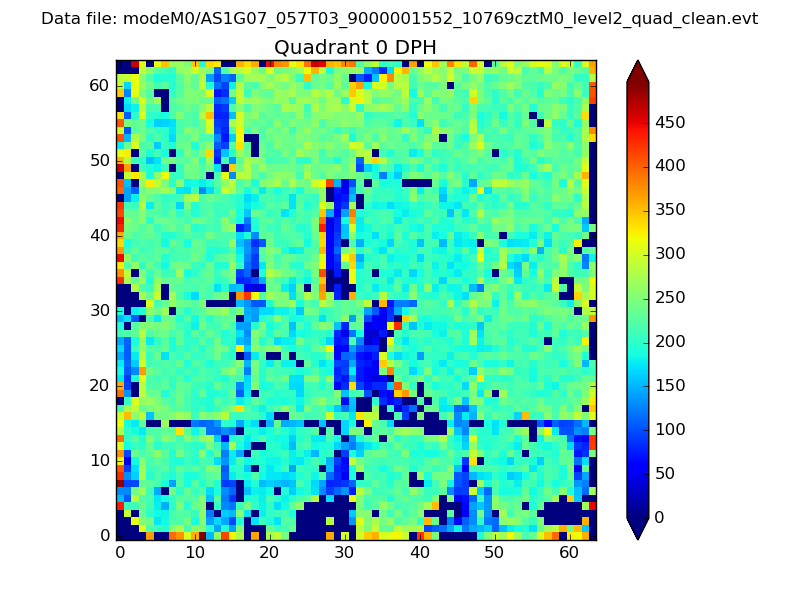 |
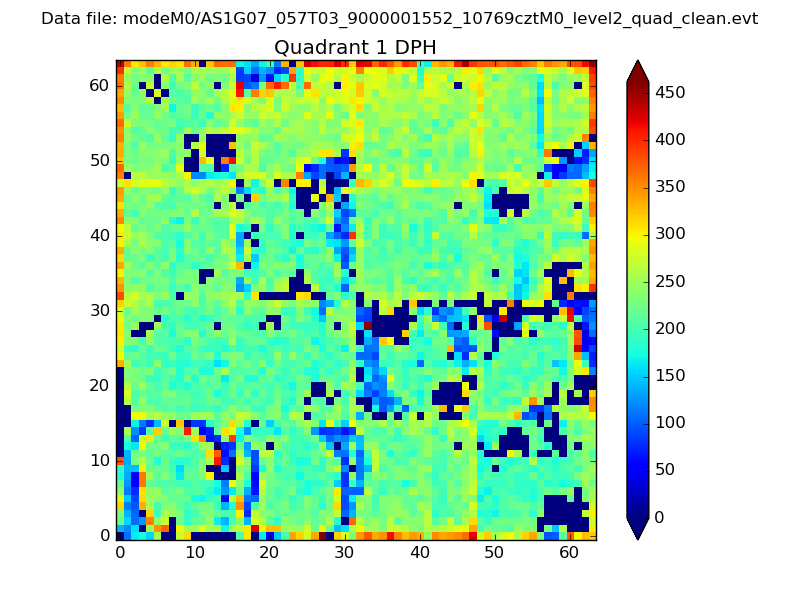 |
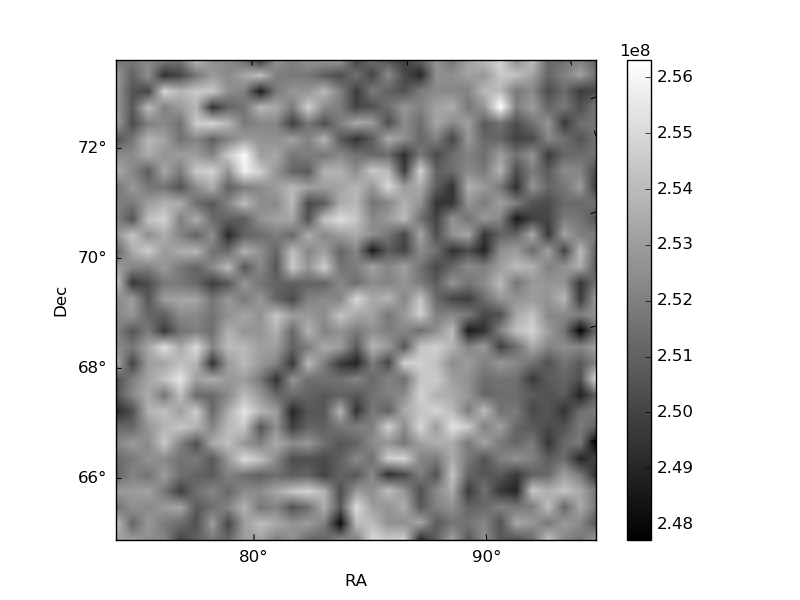
Quadrant B |
|---|---|---|---|
| Quadrant D | 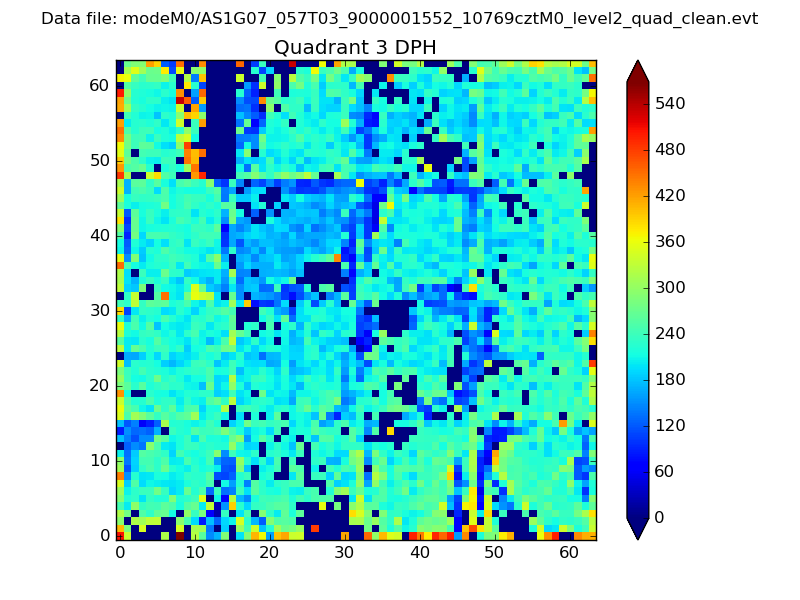 |
 |
Quadrant C |
| Plot type | Count rate plots | Images |
|---|---|---|
| Comparison with Poisson distribution Blue bars denote a histogram of data divided into 1 sec bins. Red curve is a Poisson curve with rate = median count rate of data. |
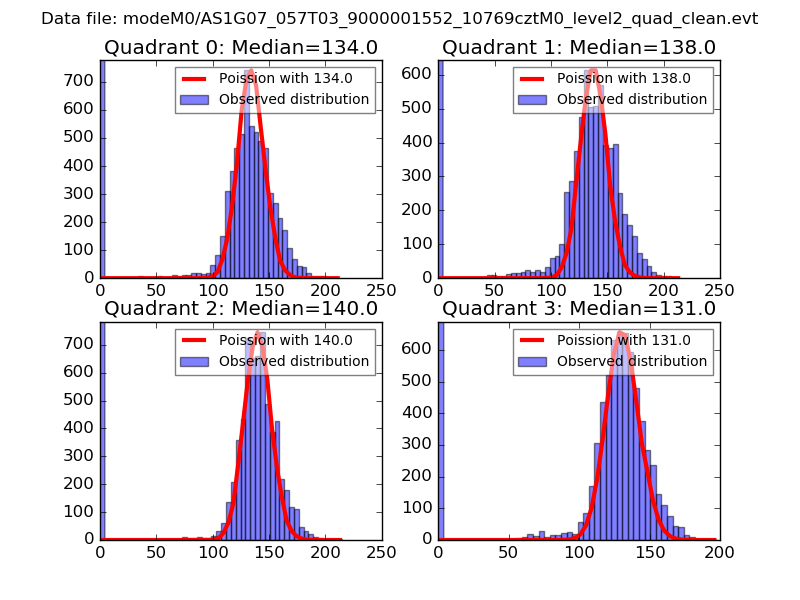 |
 |
| Quadrant-wise count rates Data is divided into 100 sec bins |
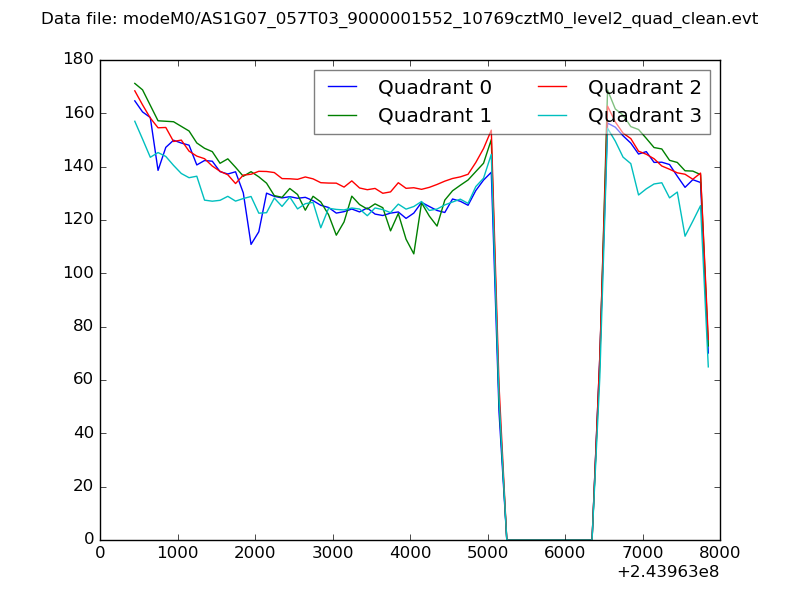 |
|
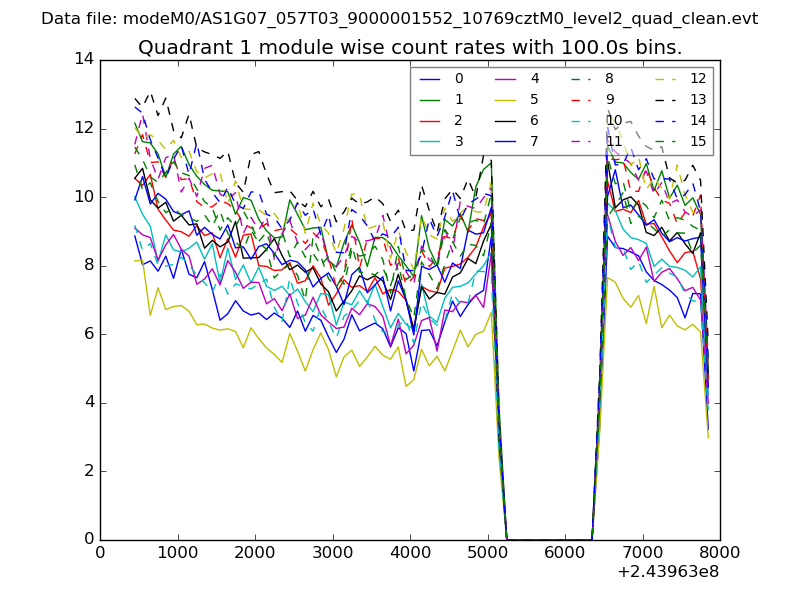
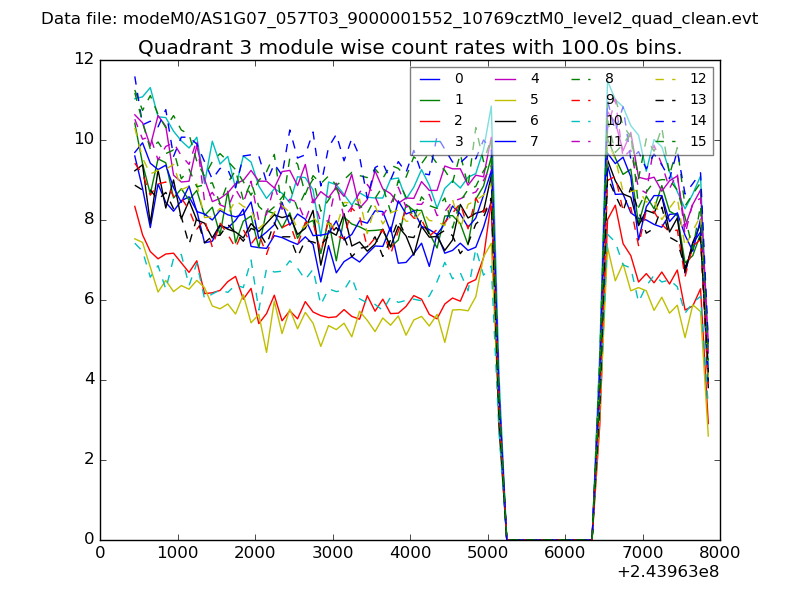
| Module-wise count rates for Quadrant A Data is divided into 100 sec bins |
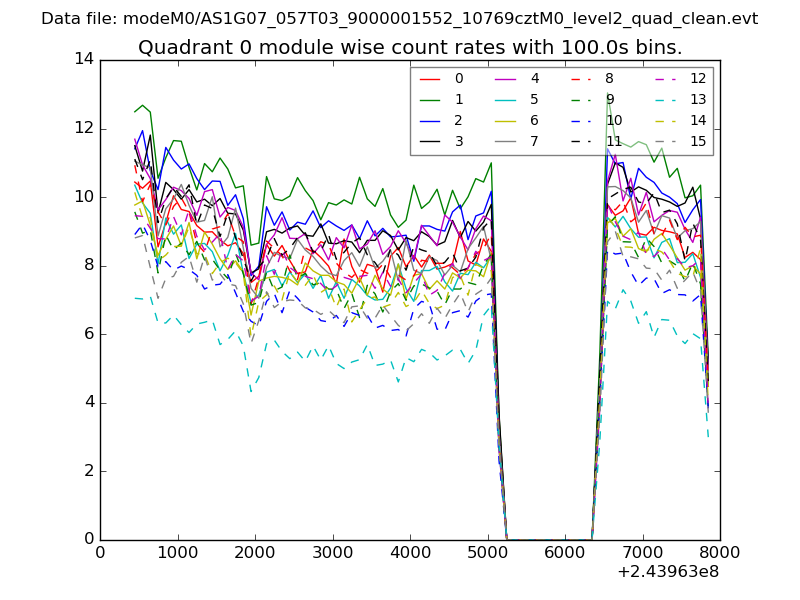 |
 |
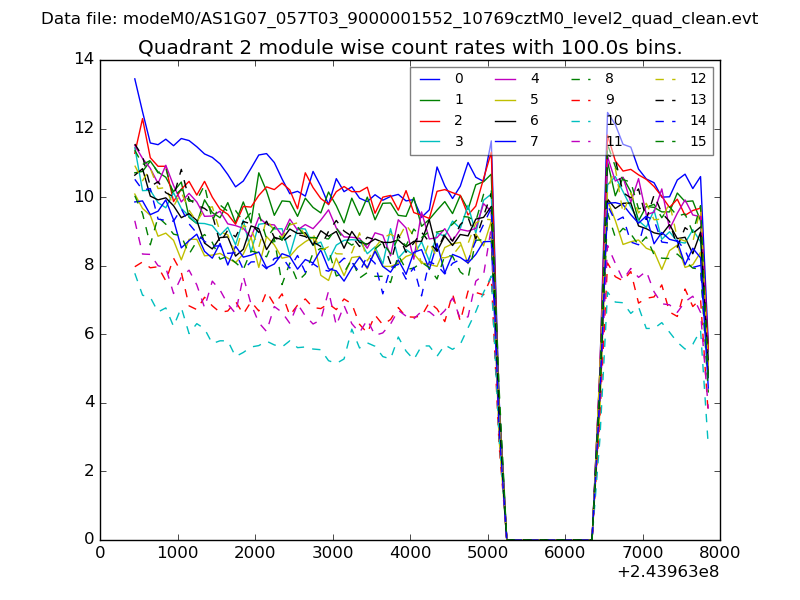
| Module-wise count rates for Quadrant B Data is divided into 100 sec bins |
 |
 |
| Module-wise count rates for Quadrant C Data is divided into 100 sec bins |
 |
 |
| Module-wise count rates for Quadrant D Data is divided into 100 sec bins |
 |
 |
| Parameter | Plot |
|---|---|
| CZT HV Monitor | 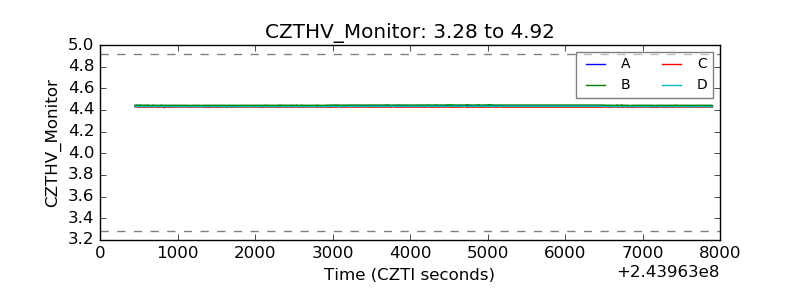 |
| D_VDD | 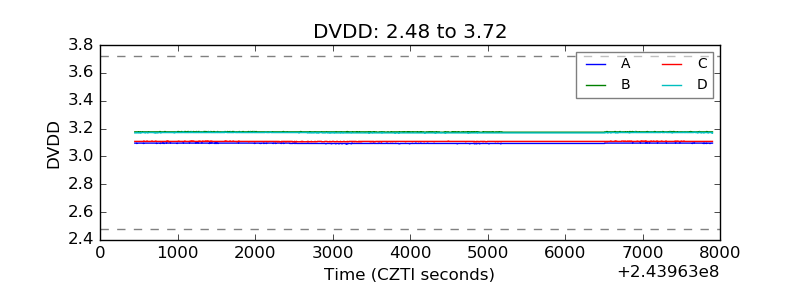 |
| Temperature 1 | 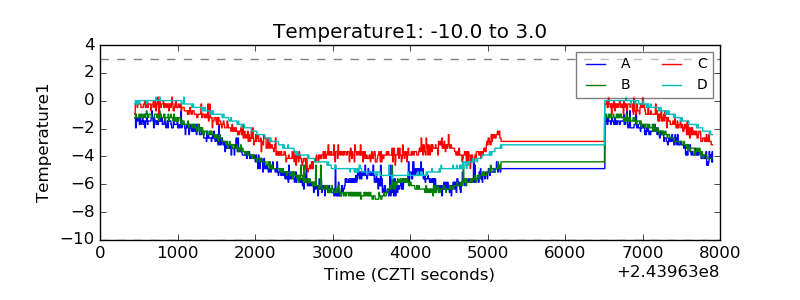 |
| Veto HV Monitor |  |
| Veto LLD | 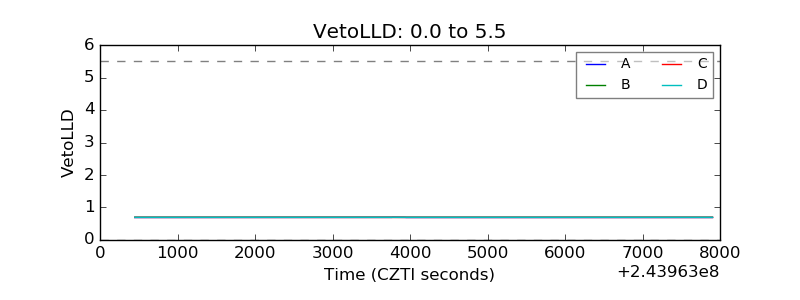 |
| Alpha Counter | 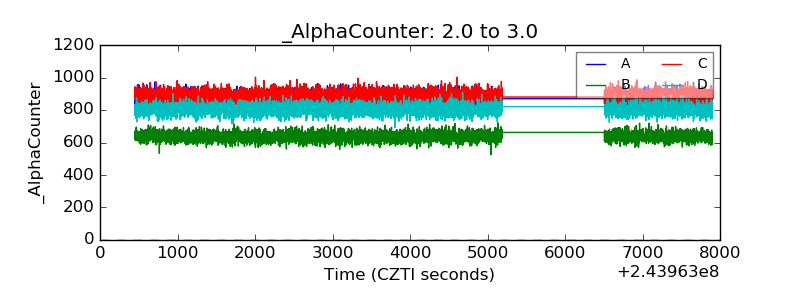 |
| _CPM_Rate | 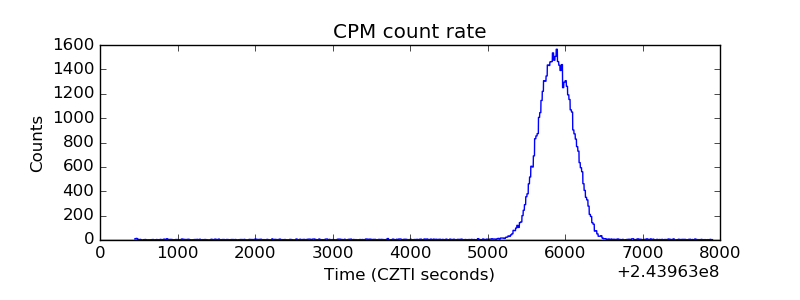 |
| CZT Counter | 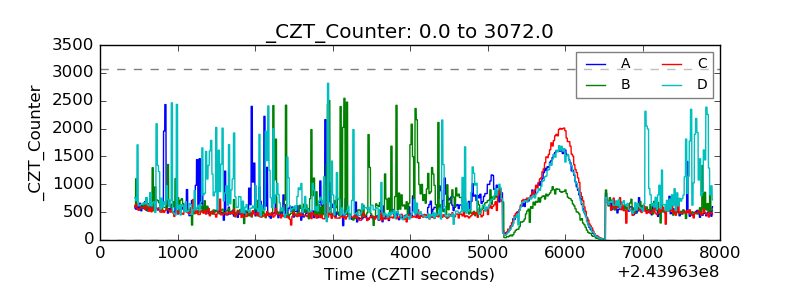 |
| +2.5 Volts monitor |  |
| +5 Volts monitor |  |
| _ROLL_ROT | 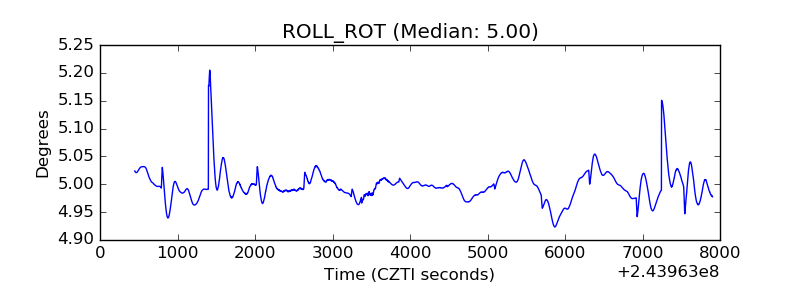 |
| _Roll_DEC | 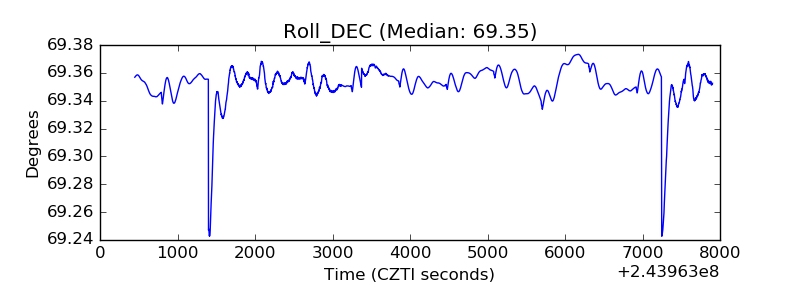 |
| _Roll_RA | 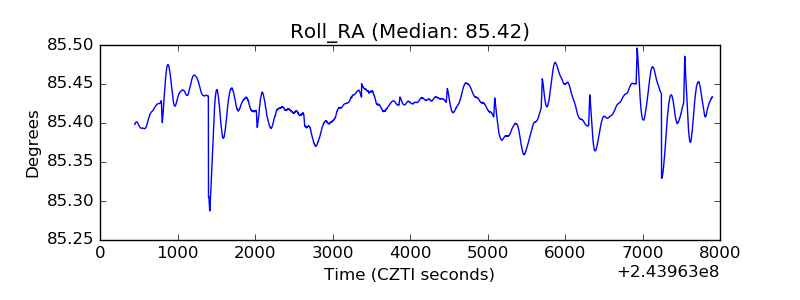 |
| Veto Counter | 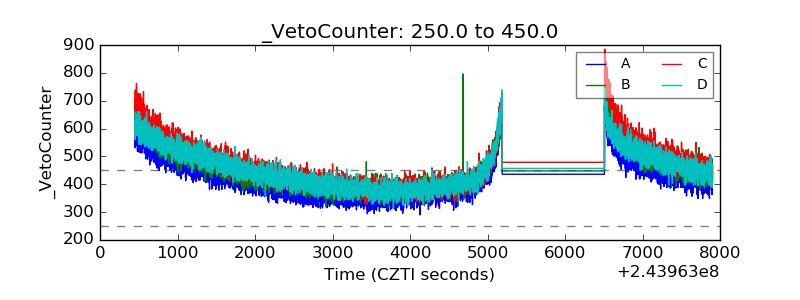 |