| Param | Original file | Final file |
|---|---|---|
| Filename | modeM0/AS1G07_057T03_9000001552_10770cztM0_level2.evt | modeM0/AS1G07_057T03_9000001552_10770cztM0_level2_quad_clean.evt |
| Size (bytes) | 227,358,720 | 55,238,400 |
| Size | 216.8 MB | 52.7 MB |
| Events in quadrant A | 1,440,333 | 368,787 |
| Events in quadrant B | 1,858,093 | 372,569 |
| Events in quadrant C | 1,286,792 | 381,021 |
| Events in quadrant D | 2,110,630 | 352,402 |
| Mode SS | |||
|---|---|---|---|
| Quadrant | BADHDUFLAG | Total packets | Discarded packets |
| A | 0 | 56 | 0 |
| B | 0 | 56 | 0 |
| C | 0 | 56 | 0 |
| D | 0 | 56 | 0 |
| Mode M0 | |||
|---|---|---|---|
| Quadrant | BADHDUFLAG | Total packets | Discarded packets |
| A | 0 | 6070 | 1 |
| B | 0 | 7296 | 1 |
| C | 0 | 5614 | 1 |
| D | 0 | 8237 | 1 |
| Quadrant | Total seconds | Saturated seconds | Saturation percentage |
|---|---|---|---|
| A | 2765 | 26 | 0.940325% |
| B | 2765 | 137 | 4.954792% |
| C | 2765 | 1 | 0.036166% |
| D | 2765 | 108 | 3.905967% |
Noise dominated data is calculated using 1-second bins in cleaned event files. If a bin has >2000 counts, and if more than 50% of those come from <1% of pixels, then it is considered to be noise-dominated and hence unusable.
| Quadrant | # 1 sec bins | Bins with >0 counts | Bins with >2000 counts | High rate bins dominated by noise | Noise dominated (total time) | Noise dominated (detector-on time) | Marked lightcurve |
|---|---|---|---|---|---|---|---|
| A | 2765 | 2765 | 20 | 20 | 0.72% | 0.72% | 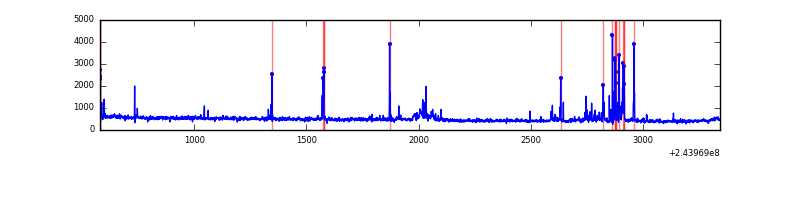 |
| B | 2765 | 2765 | 105 | 105 | 3.80% | 3.80% | 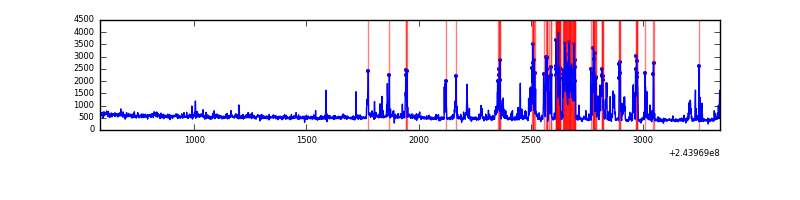 |
| C | 2765 | 2765 | 0 | 0 | 0.00% | 0.00% | 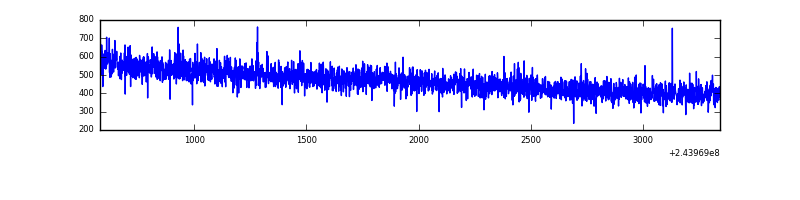 |
| D | 2765 | 2765 | 85 | 85 | 3.07% | 3.07% | 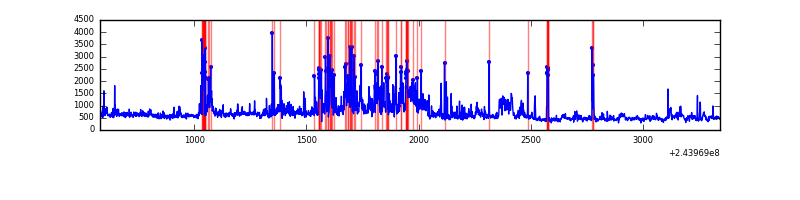 |
Top three noisy pixels from each quadrant. If the there are fewer than three noisy pixels in the level2.evt file, extra rows are filled as -1
| Pixel properties | Quadrant properties | ||||||
|---|---|---|---|---|---|---|---|
| Quadrant | DetID | PixID | Counts | Sigma | Mean | Median | Sigma |
| A | 15 | 223 | 94239 | 1406.27 | 325 | 318 | 66.8 |
| A | 15 | 239 | 45489 | 676.34 | 325 | 318 | 66.8 |
| A | 14 | 254 | 18880 | 277.93 | 325 | 318 | 66.8 |
| B | 4 | 239 | 512305 | 8287.36 | 328 | 321 | 61.8 |
| B | 0 | 218 | 21268 | 339.06 | 328 | 321 | 61.8 |
| B | 15 | 204 | 12986 | 205.01 | 328 | 321 | 61.8 |
| C | 13 | 61 | 2516 | 28.79 | 329 | 330 | 75.9 |
| C | 8 | 222 | 1898 | 20.65 | 329 | 330 | 75.9 |
| C | 3 | 202 | 861 | 6.99 | 329 | 330 | 75.9 |
| D | 10 | 199 | 270605 | 3543.07 | 321 | 312 | 76.3 |
| D | 8 | 195 | 176057 | 2303.71 | 321 | 312 | 76.3 |
| D | 7 | 71 | 145501 | 1903.17 | 321 | 312 | 76.3 |
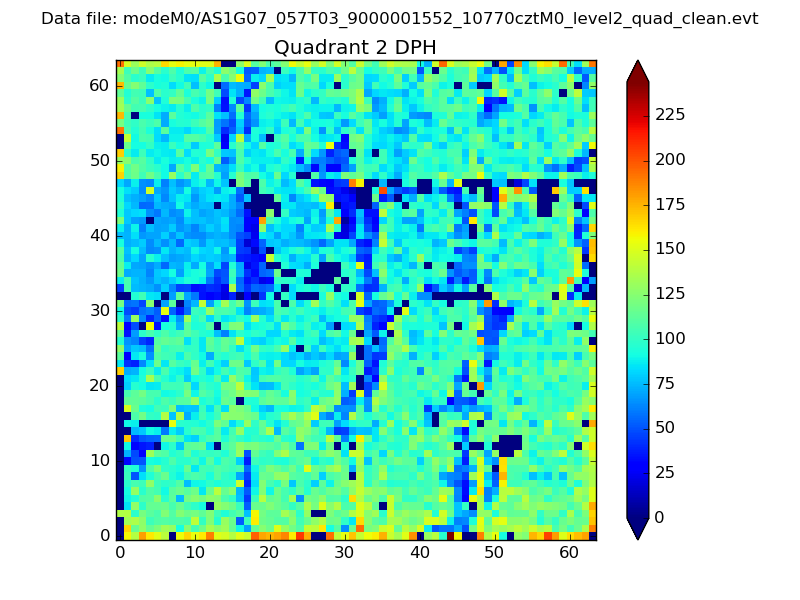
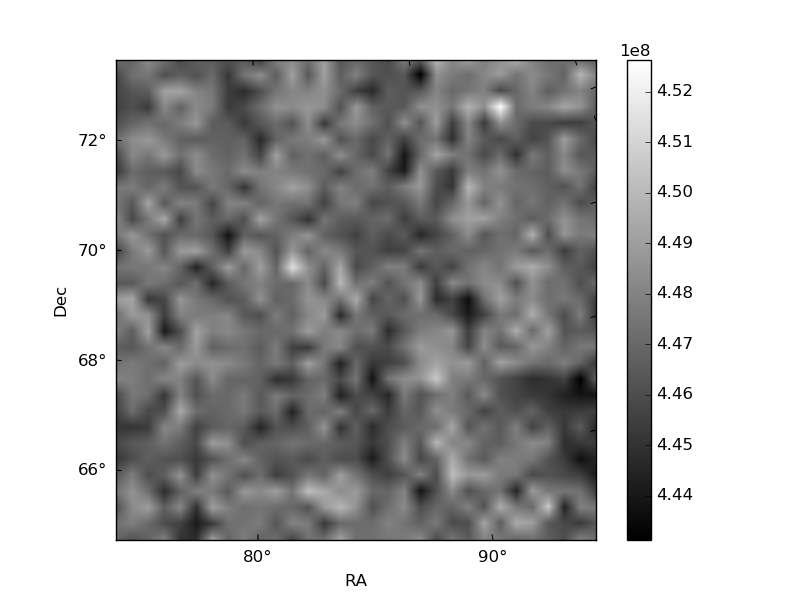
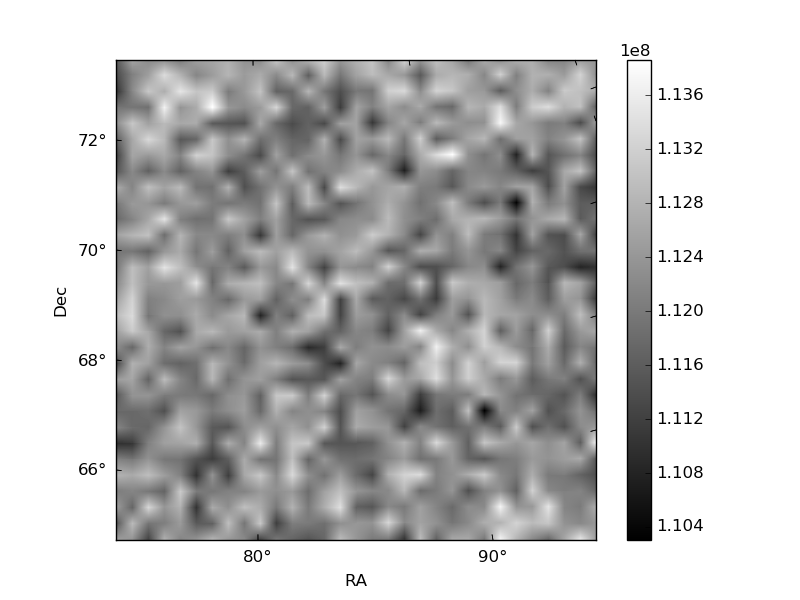
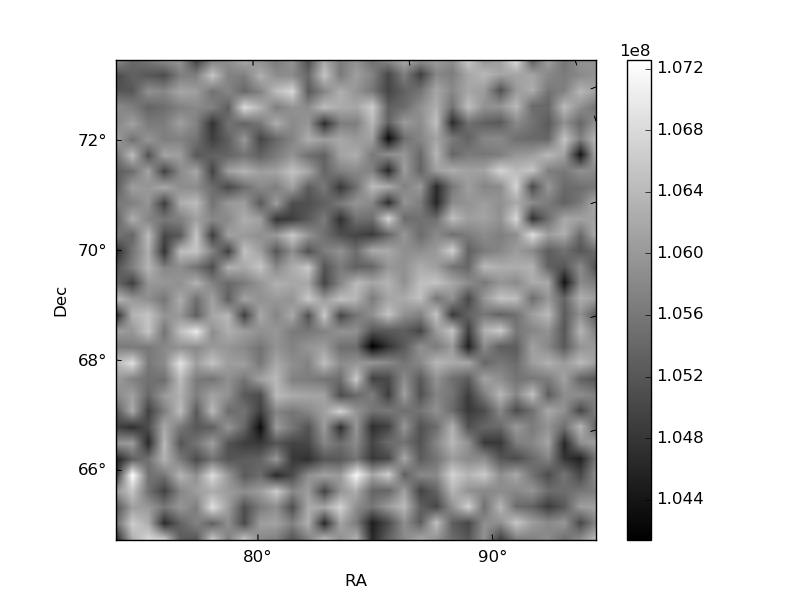
Histogram calculated using DETX and DETY for each event in the final _common_clean file
| Quadrant A | 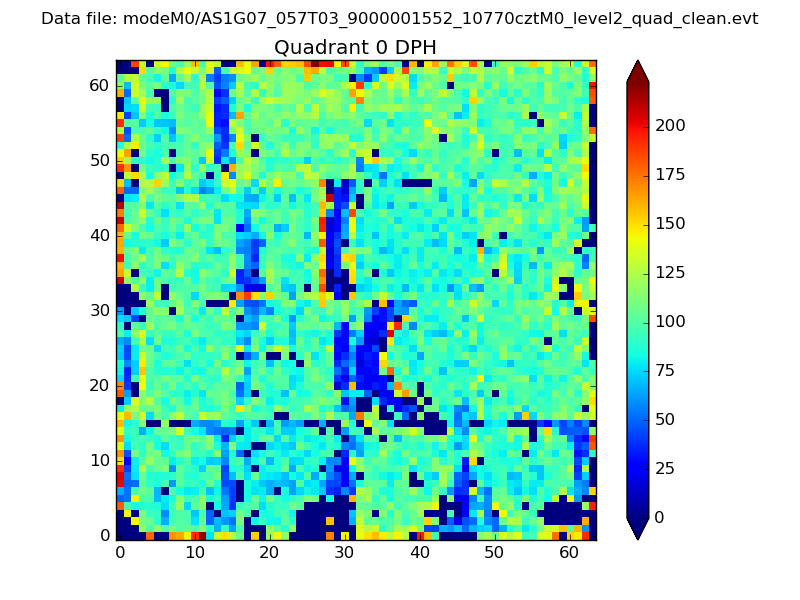 |
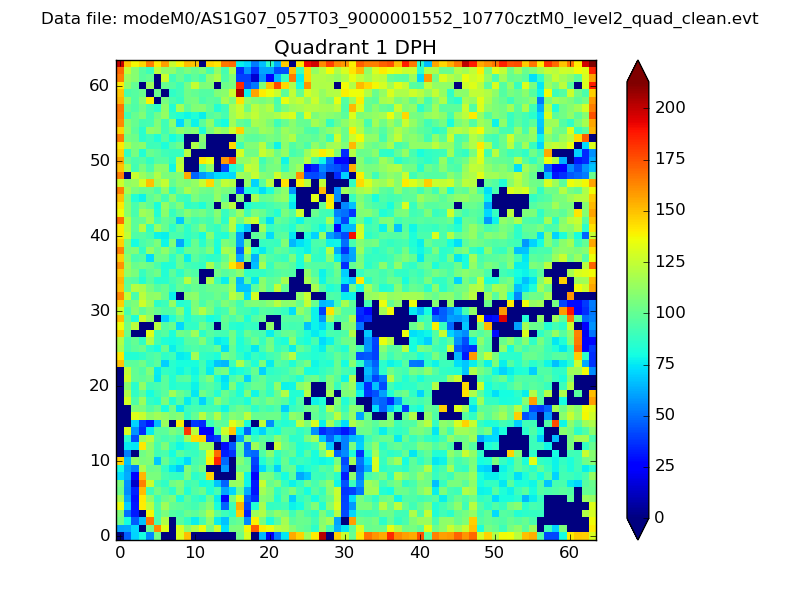 |
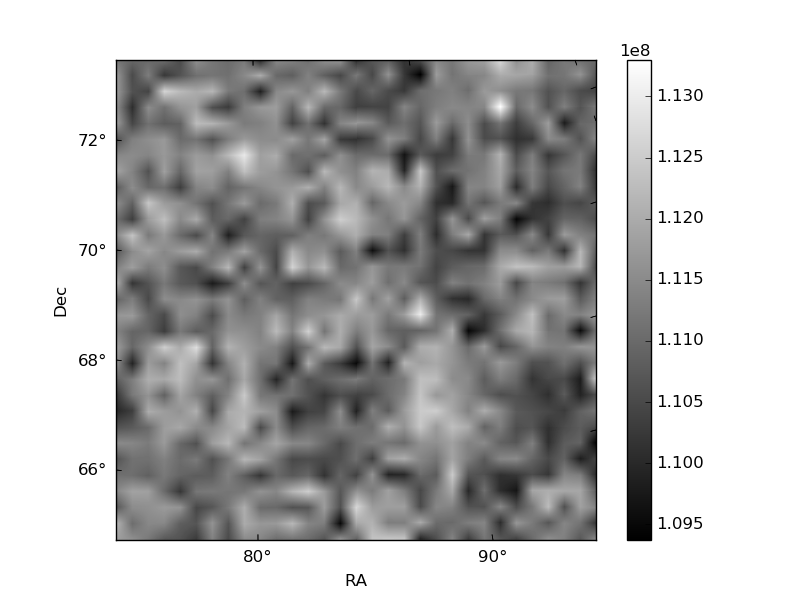
Quadrant B |
|---|---|---|---|
| Quadrant D | 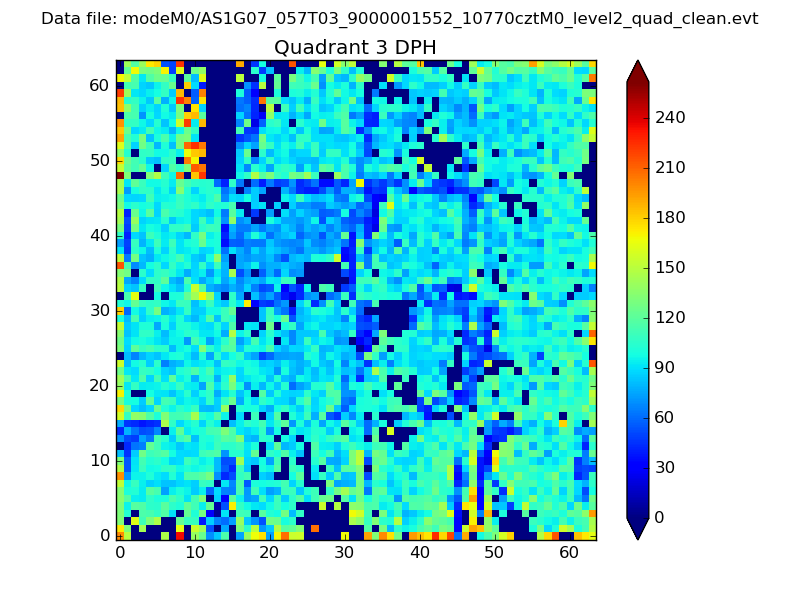 |
 |
Quadrant C |
| Plot type | Count rate plots | Images |
|---|---|---|
| Comparison with Poisson distribution Blue bars denote a histogram of data divided into 1 sec bins. Red curve is a Poisson curve with rate = median count rate of data. |
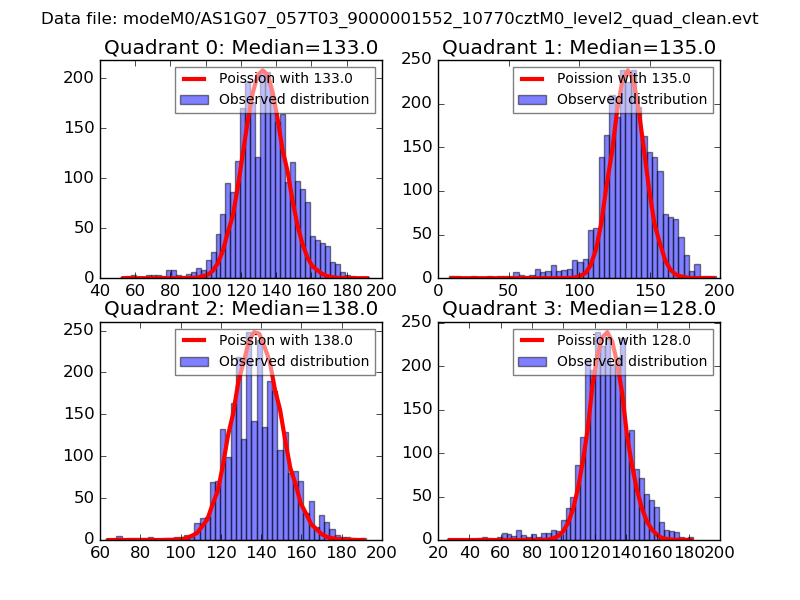 |
 |
| Quadrant-wise count rates Data is divided into 100 sec bins |
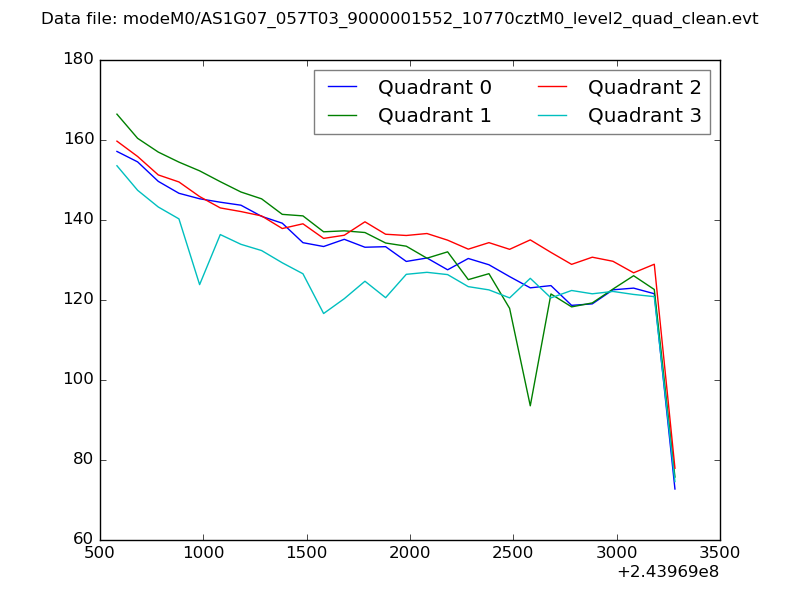 |
|
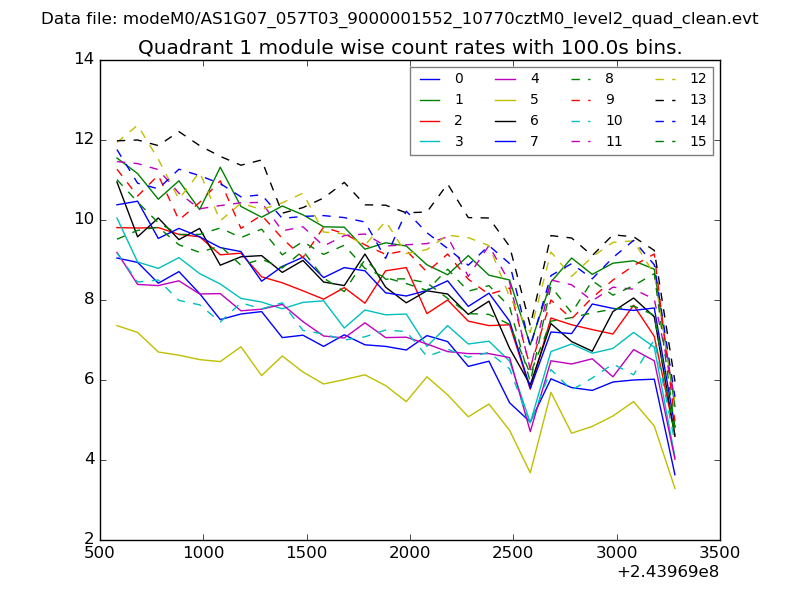
| Module-wise count rates for Quadrant A Data is divided into 100 sec bins |
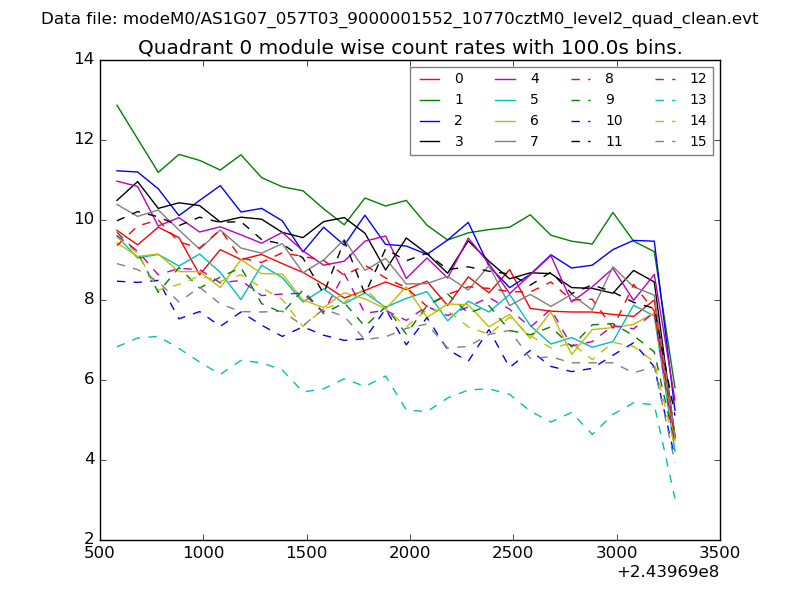 |
 |
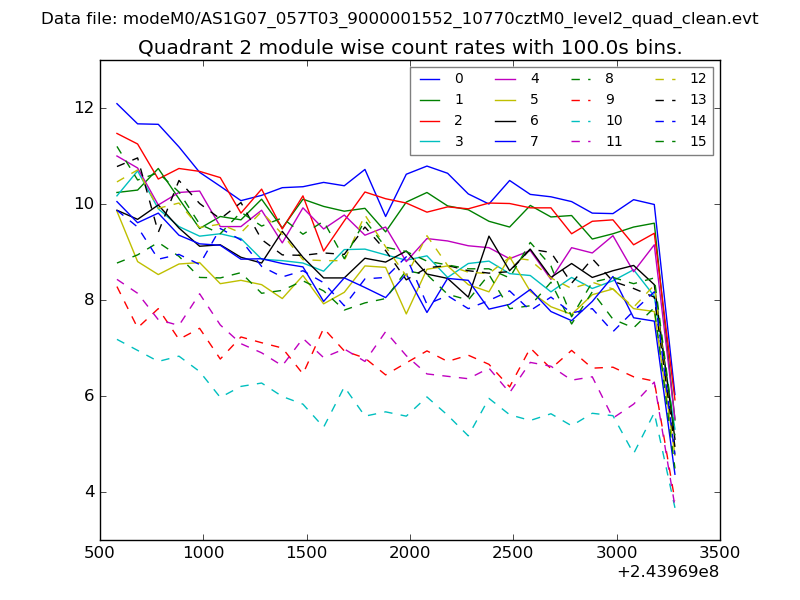
| Module-wise count rates for Quadrant B Data is divided into 100 sec bins |
 |
 |
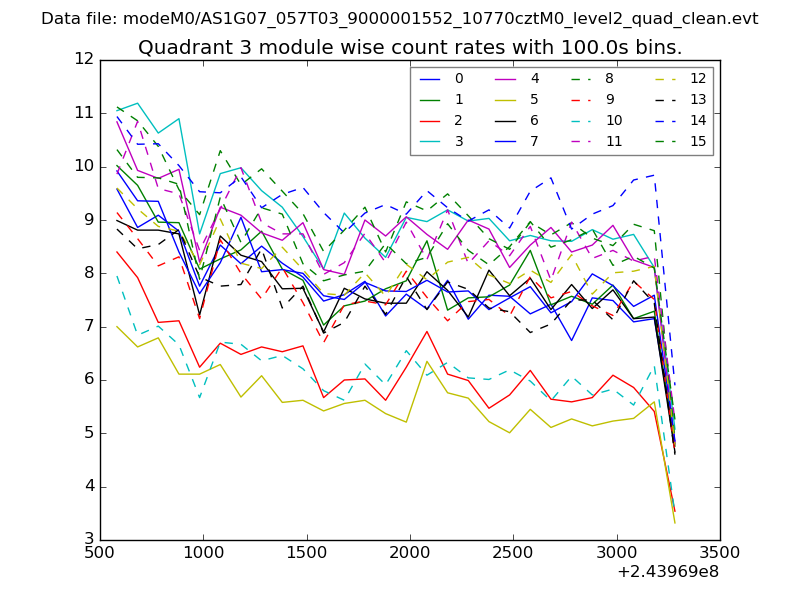
| Module-wise count rates for Quadrant C Data is divided into 100 sec bins |
 |
 |
| Module-wise count rates for Quadrant D Data is divided into 100 sec bins |
 |
 |
| Parameter | Plot |
|---|---|
| CZT HV Monitor | 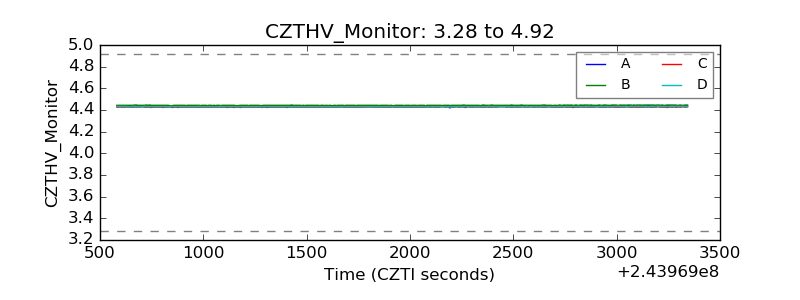 |
| D_VDD | 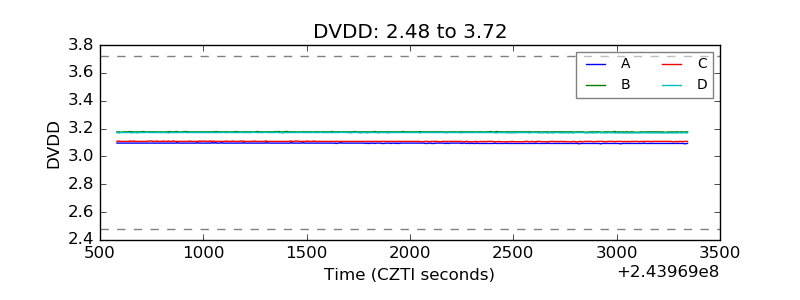 |
| Temperature 1 | 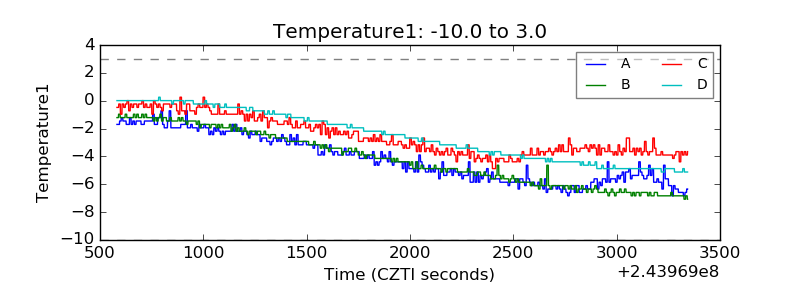 |
| Veto HV Monitor |  |
| Veto LLD | 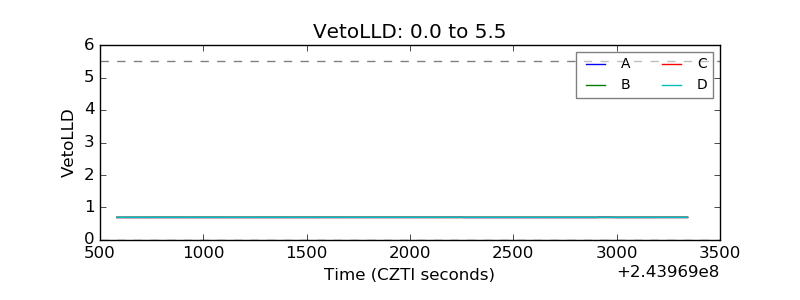 |
| Alpha Counter | 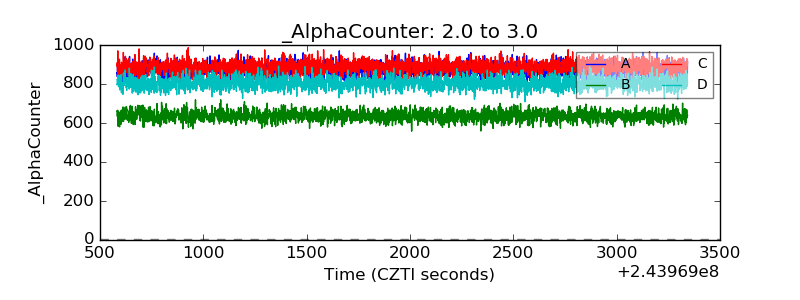 |
| _CPM_Rate | 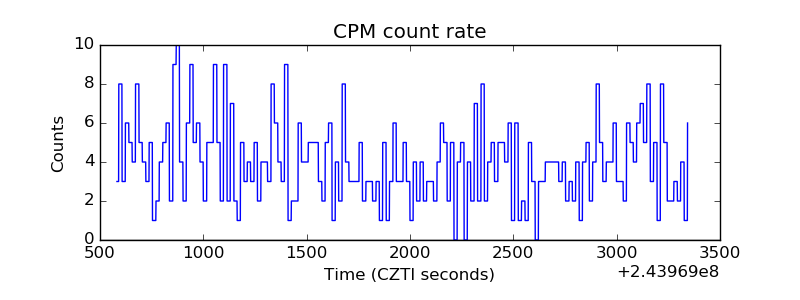 |
| CZT Counter | 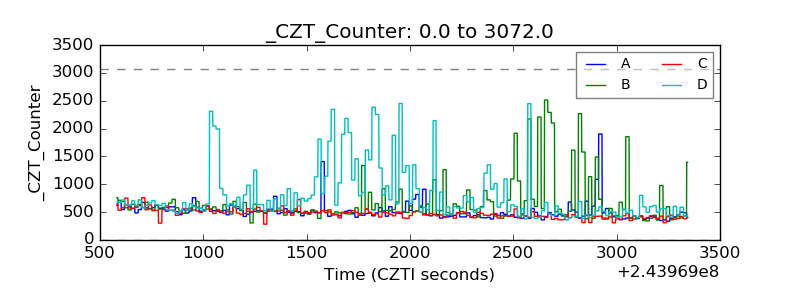 |
| +2.5 Volts monitor |  |
| +5 Volts monitor |  |
| _ROLL_ROT | 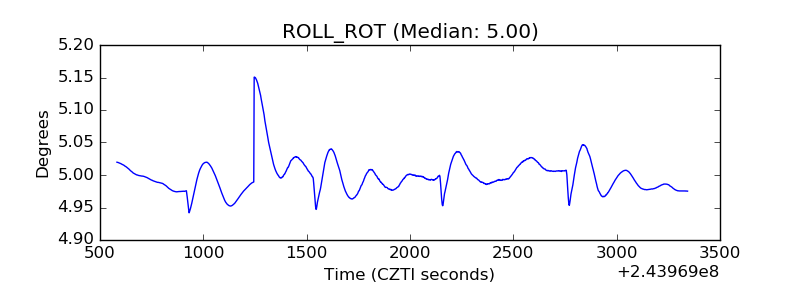 |
| _Roll_DEC | 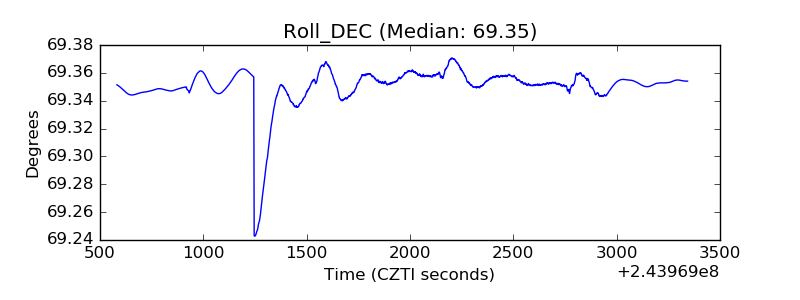 |
| _Roll_RA |  |
| Veto Counter | 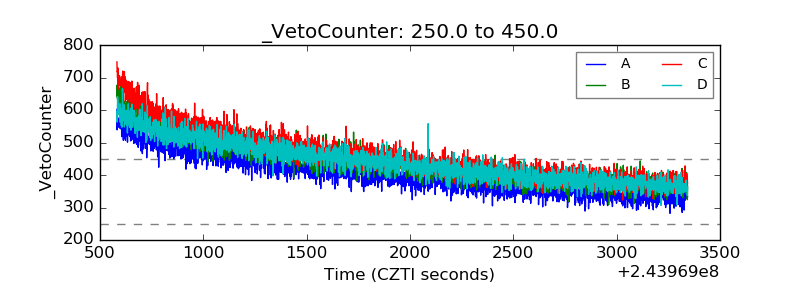 |