| Param | Original file | Final file |
|---|---|---|
| Filename | modeM0/AS1C02_045T03_9000001558cztM0_level2.fits | modeM0/AS1C02_045T03_9000001558cztM0_level2_quad_clean.evt |
| Size (bytes) | 77,425,920 | 80,184,960 |
| Size | 73.8 MB | 76.5 MB |
| Events in quadrant A | 487,536 | 513,162 |
| Events in quadrant B | 459,330 | 480,531 |
| Events in quadrant C | 473,632 | 491,573 |
| Events in quadrant D | 394,330 | 412,865 |
| Mode SS | |||
|---|---|---|---|
| Quadrant | BADHDUFLAG | Total packets | Discarded packets |
| A | 0 | 156 | 0 |
| B | 0 | 156 | 0 |
| C | 0 | 156 | 0 |
| D | 0 | 156 | 0 |
| Mode M0 | |||
|---|---|---|---|
| Quadrant | BADHDUFLAG | Total packets | Discarded packets |
| A | 0 | 16832 | 0 |
| B | 0 | 21598 | 0 |
| C | 0 | 15820 | 0 |
| D | 0 | 22447 | 0 |
| Mode M9 | |||
|---|---|---|---|
| Quadrant | BADHDUFLAG | Total packets | Discarded packets |
| A | 0 | 25 | 0 |
| B | 0 | 25 | 0 |
| C | 0 | 25 | 0 |
| D | 0 | 25 | 0 |
| Quadrant | Total seconds | Saturated seconds | Saturation percentage |
|---|---|---|---|
| A | 7613 | 223 | 2.929200% |
| B | 7609 | 650 | 8.542515% |
| C | 7618 | 118 | 1.548963% |
| D | 7613 | 676 | 8.879548% |
Noise dominated data is calculated using 1-second bins in cleaned event files. If a bin has >2000 counts, and if more than 50% of those come from <1% of pixels, then it is considered to be noise-dominated and hence unusable.
| Quadrant | # 1 sec bins | Bins with >0 counts | Bins with >2000 counts | High rate bins dominated by noise | Noise dominated (total time) | Noise dominated (detector-on time) | Marked lightcurve |
|---|---|---|---|---|---|---|---|
| A | 10187 | 7624 | 0 | 0 | 0.00% | 0.00% |  |
| B | 10187 | 7624 | 0 | 0 | 0.00% | 0.00% |  |
| C | 10187 | 7627 | 0 | 0 | 0.00% | 0.00% |  |
| D | 10187 | 7618 | 0 | 0 | 0.00% | 0.00% |  |
Top three noisy pixels from each quadrant. If the there are fewer than three noisy pixels in the level2.evt file, extra rows are filled as -1
| Pixel properties | Quadrant properties | ||||||
|---|---|---|---|---|---|---|---|
| Quadrant | DetID | PixID | Counts | Sigma | Mean | Median | Sigma |
| A | 0 | 29 | 452 | 9.99 | 127 | 121 | 33.1 |
| A | 7 | 110 | 441 | 9.66 | 127 | 121 | 33.1 |
| A | 14 | 79 | 360 | 7.22 | 127 | 121 | 33.1 |
| B | 2 | 9 | 421 | 11.78 | 121 | 117 | 25.8 |
| B | 14 | 254 | 315 | 7.67 | 121 | 117 | 25.8 |
| B | 3 | 17 | 308 | 7.4 | 121 | 117 | 25.8 |
| C | 1 | 81 | 358 | 7.15 | 124 | 117 | 33.7 |
| C | 2 | 191 | 347 | 6.83 | 124 | 117 | 33.7 |
| C | 1 | 80 | 343 | 6.71 | 124 | 117 | 33.7 |
| D | 6 | 231 | 291 | 6.02 | 112 | 103 | 31.2 |
| D | 7 | 3 | 285 | 5.83 | 112 | 103 | 31.2 |
| D | 3 | 14 | 281 | 5.7 | 112 | 103 | 31.2 |
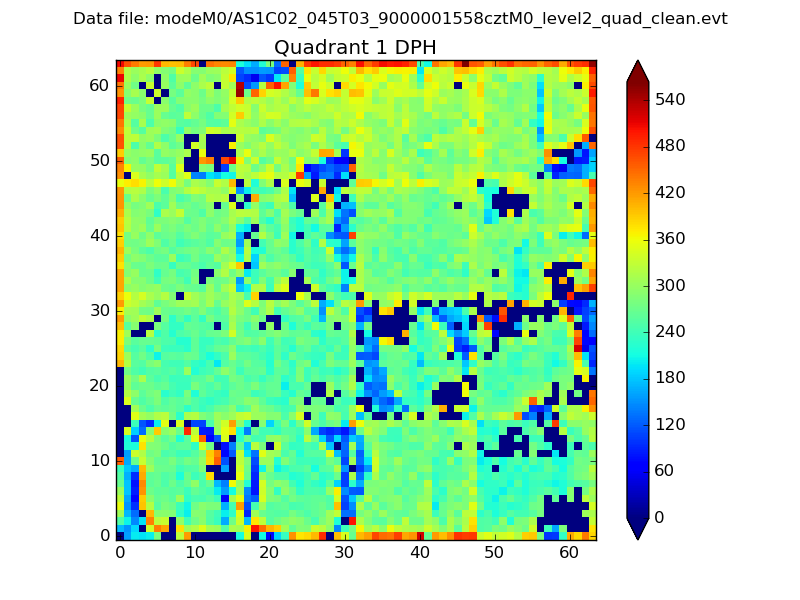
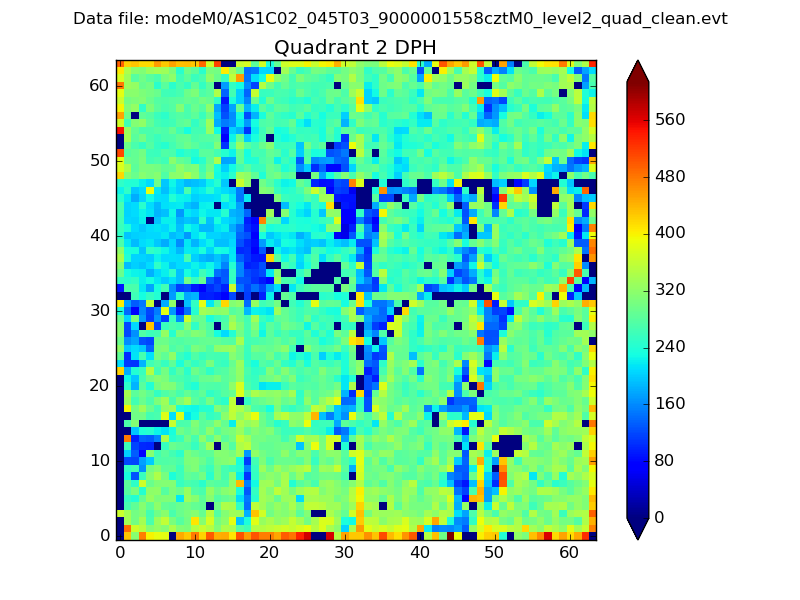
Histogram calculated using DETX and DETY for each event in the final _common_clean file
| Quadrant A |  |
 |
Quadrant B |
|---|---|---|---|
| Quadrant D | 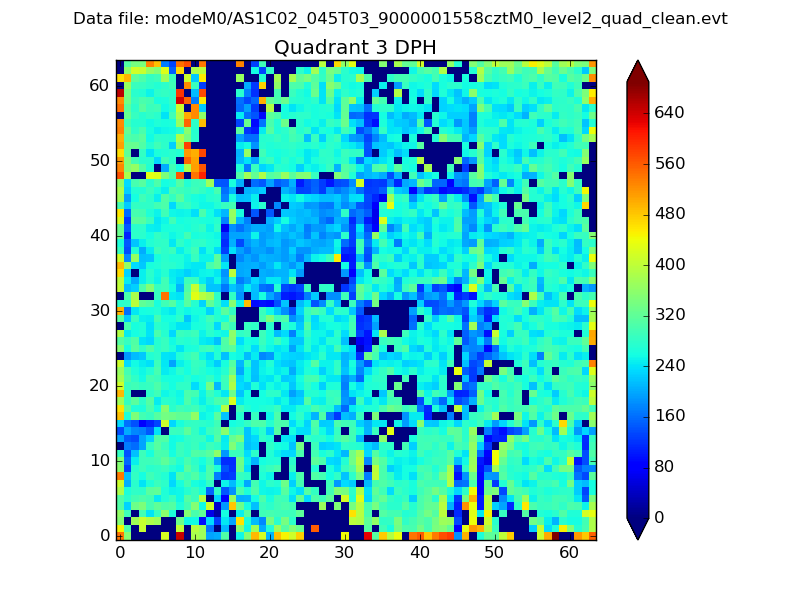 |
 |
Quadrant C |
| Plot type | Count rate plots | Images |
|---|---|---|
| Comparison with Poisson distribution Blue bars denote a histogram of data divided into 1 sec bins. Red curve is a Poisson curve with rate = median count rate of data. |
 |
 |
| Quadrant-wise count rates Data is divided into 100 sec bins |
 |
|
| Module-wise count rates for Quadrant A Data is divided into 100 sec bins |
 |
 |
| Module-wise count rates for Quadrant B Data is divided into 100 sec bins |
 |
 |
| Module-wise count rates for Quadrant C Data is divided into 100 sec bins |
 |
 |
| Module-wise count rates for Quadrant D Data is divided into 100 sec bins |
 |
 |
| Parameter | Plot |
|---|---|
| CZT HV Monitor |  |
| D_VDD | 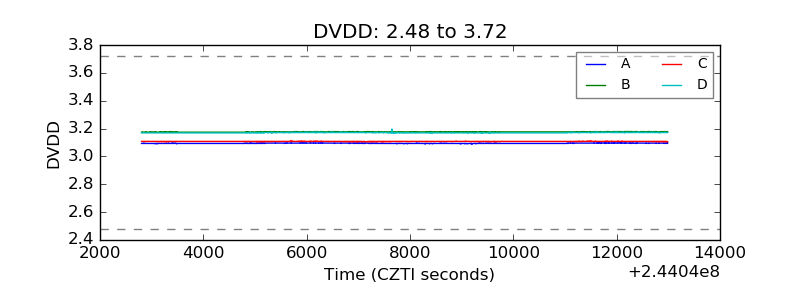 |
| Temperature 1 |  |
| Veto HV Monitor |  |
| Veto LLD |  |
| Alpha Counter |  |
| _CPM_Rate |  |
| CZT Counter |  |
| +2.5 Volts monitor |  |
| +5 Volts monitor |  |
| _ROLL_ROT |  |
| _Roll_DEC |  |
| _Roll_RA |  |
| Veto Counter |  |